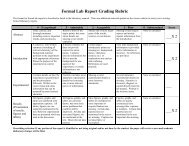
Beach Stabilization - Stockton College
Beach Stabilization - Stockton College
Beach Stabilization - Stockton College

Create successful ePaper yourself
Turn your PDF publications into a flip-book with our unique Google optimized e-Paper software.
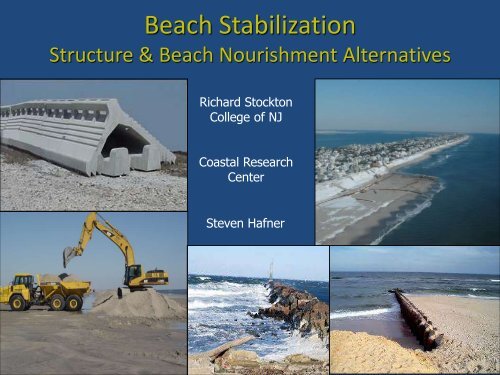
<strong>Beach</strong> <strong>Stabilization</strong>Structure & <strong>Beach</strong> Nourishment AlternativesRichard <strong>Stockton</strong><strong>College</strong> of NJCoastal ResearchCenterSteven Hafner
Overview Coastal Overview• Coastal Processes• Coastal Development <strong>Beach</strong> stabilization structures• Hard Structure• Soft Structure <strong>Beach</strong> nourishment• Methods Backpassing and Bypassing• Economics Review
Shoreline Stability Concerns• Reduce beach erosion• Ensure tourism revenue• $51 billion in federal taxdollars• approximately $23 billionspent in NJ• Prevent storm propertydamage• Limit loss of publicinfrastructure• Preserve wildlife habitat
What happens when we’re not prepared• <strong>Beach</strong>es are dynamic locations• Homes and infrastructure eventually threatened or damaged• Sensitive habitats are degraded or lost
Barrier Islands• Formed 18,000 years ago as sea level started rising after the last ice age• Geologic transgression - a process where islands move landward with sealevel rise• Barrier islands are long, narrow, offshore shifting sand deposits separatedby tidal inlets
Natural Barrier Islands• Natural barrier islands are dynamic features in motion responding to conditions• New Jersey of 130 miles of shoreline just 31 miles are undeveloped• Remaining
Developed Barrier Islands• Atlantic City (Absecon Island) most densely developed island in NJ• A lack of understanding coastal processes & unwise land use policies• Development impedes the Island’s natural landward progression• 76% is densely developed prompting us to make the beaches more static• Resulting shore stabilization efforts to protect property & infrastructure
Structural Options for <strong>Beach</strong> <strong>Stabilization</strong>• Hard Structure options include, wood and rock groins, seawalls, inlet jetties,emergent or submerged sills and breakwaters• Soft Structure options include, building dunes, planting vegetation installing Geotubes,sand bags• A variety of other innovative options have been tried with mixed results.
Wood and Rock Groins• Earliest efforts to stabilize the beach were engineered structures with varied results• Shore perpendicular groins are designed to hold and trap sand• Constructed out of wood and rocks groins are built to all different sizes and widths
• Groins restrict longshore sand flow• Sand builds up updrift of the structure• Down drift beach starved of sand• Groin fields built to limit effects over regional beaches
Limiting Groin Effects• Notched groins allows lateral longshore sand movement• Low profile elevation groins reduce offsets and formation of pocketbeaches• Modifications limit the impact on down drift beaches
Inlet Jetties• Jetties are engineered attempts to stabilize inlets and improve navigation• Jetties restrict inlet channel migration and inlet shoaling• Jetties normally built shore perpendicular and constructed of rock and concrete• Jetties disrupt sand by passing across inlets causing offsets and down drift deficits
Seawalls• Seawalls normally constructed of rock and concrete• Seawalls protect property and infrastructure from wave assault• Reflected wave energy causes wave scouring• Results in no sandy beach seaward of the seawall
Emergent Breakwaters• Constructed of rock and concrete designed to break wave energy• Emergent structures are built to protect exposed harbors and beaches• Near shore structures can cause build up of sand behind the structure• Sand is shifted from adjacent shoreline causing beach scalloping• Emergent sills pose risk to surf activity and restrict access to the water
Submerged Breakwaters• Most often constructed using rocks or concrete• Designed to form a “perched” beach effect landward of the structure• Submerged sills and artificial breakwaters have met with mixed success• Structures can be hazardous forrecreational water activities
US ACOE CMP 227• An experimental program co-sponsored by the ACOE and State• Compared “<strong>Beach</strong>saver” reefs and double tee structure’s ability to holdsand• Installed end to end to form a closed systems within groin cells• Create essentially a “perched beach” effect retaining sand in the cell
Performance Assesment• Foundation support critical to success of structures function• Early installations placed on rock mattress remain stable• Later installations placed on fabric had settlement issues• Double tee structure was buried• “<strong>Beach</strong>saver” units retained sand• Design allowed additional sand to accumulate
Soft Structures• Common soft structures include, building dunes, planting vegetation, Geo-tubes& sand bags• Sand bags are temporary emergency features• Geo-tubes more durable emergency protection features serve as dune cores• Not recommended for continuous exposure to high wave energy environments• Structure's retain sand, no sand is added to the system
<strong>Beach</strong> Nourishment• A commonly used technique to restore eroded shorelines through sand placement• The process supplements the diminishing supply of natural sediment• Nourished shorelines provide two primary benefits: enhanced recreation, andcoastal storm protection.• Other benefits include restored wildlife habitats, increased coastal access, andreduced need for hard structures• <strong>Beach</strong> nourishment restores recreational beach, it doesn't stop erosion
<strong>Beach</strong> Nourishment Methodology• Requires and abundant sand source compatible with native beach material• Identified sand sources include offshore relics, inlet shoals and mainland quarries• Sand is trucked to the beach or hydraulically pumped using dredges• Types of dredges commonly used include hopper and cutterhead suction dredges
<strong>Beach</strong> Nourishment Performance• Each nourishment cycle has a project "lifetime" expectancy• Maintenance nourishment repeated to maintain the design beach template• <strong>Beach</strong> nourishment projects usually shed sand in four ways including• Storms tropical and Noreaster’s have a regional erosional effect• “Compensating slopes” normally by design• “End effect” erosion caused by equilibrium between adjacent shorelines• “Hotspots”, accelerated erosional areas compared to adjacent shoreline
Compensating Slope
End Effect Erosion25-Year Coastal Changes at Site 173, West End Avenue, Long Branch, Monmouth Co.Cu. Yds. of Sand per Foot or Shoreline Position (feet)250200150100500-50-100Positioned at theSouthern End of theNorth Segment of thisMassive Project, the FillPerformance Sufferesfrom End Effect Losses.Sand is Lost Far MoreRapidly at this Locationthan Elsewhere in LongBranch.The Placement Value tothe Right Suffered >50% Loss During the2009-2010 StormSeason. Sand MovedNorth (see Site 174)-150F 1986F 1987F 1988F 1989F 1990F 1991F 1992F 1993F 1994F 1995F 1996F 1997Annual Sand Volume ChangeF 1998F 1999YEARF 2000F 2001F 2002F 2003F 2004F 2005F 2006F 2007F 2008F 2009Annual Shoreline PositionF 2010F 2011Cumulative Volume ChangeCumulative Shoreline Position
Erosional “Hotspot”
Dune Vulnerability Study of Surf City• Comparison using 2005 Pre nourishment dune conditions (top)• Repeated after the ACOE project completed in 2007 (bottom)• Red indicates dune failure• Blue and green colors indicate minimal dune damage• Pre-construction shows dune failure• After construction No dune failures
Large Projects Benefit from Long Shore Drift
<strong>Beach</strong> Nourishment Economics• Hydraulic beach nourishment has an expensive mobilization cost• Recent bids $2,950,000 for mobilization• Sand per cubic yard approximately $7• Dredging - cost effective for large scale projects over 200,000 cubic yards• Mobilization cost make it inefficient & cost prohibitive for smaller projects
<strong>Beach</strong> Nourishment Economics• Truck-hauled sand from mainland requires less equipment mobilization• Recent bids $40,000 for mobilization• Much higher delivery and spreading cost $ 17.50 per cubic yard• Hidden cost include wear and tear on public infrastructure• Cost efficient for emergency repairs• Expensive and time consuming for large nourishment projects• Quarry sand color is often stained by iron oxide in NJ
By Passing & Sand Back Passing• By passing compensates for disruption of natural sand flow across inlets• Lower cost on long term maintenance options for chronic erosion areas
Sand Back Passing• Sediment back passing reverses the natural migration of sediment• Sand harvested from accretive, down drift areas to erosive, up drift beach• Sand back passing objective to efficiently manage limited sand resources• Method prolongs need for repetitive large scale re-nourishment projects
Sand Back Passing• Avalon, New Jersey pilot project completed in 2006 harvested 50,000 CY• Source sites identified for long term accretion and shoreline advance• Borrow (harvest) zones require steady sand accretion above harvest rate• Sand harvesting removes a thin layer of sand two feet thick or less.
Borrow Zone Concerns• Disturbing shorebird nesting habitat or threatened plants species• Unearthing or damaging buried historical shipwrecks and cultural items• Alleviate concerns with careful planning and site selection• Conduct work outside of nesting seasons• Allows natural beach recovery and stable habitat prior to nesting season• Careful selection of the harvest region ensure no historical targets
Avalon Back Passing Performance• GIS Volume Change Map shows regions of change following harvesting• Coral colored regions show sand losses• Green represents gains & purple no changes• 3.5 weeks post construction beach gained 7,200 cubic yards of sand
Sand Back Passing Economics• Equipment mobilization cost $70,000 similar to quarry sand delivery• Sand per cubic yard cost about $7.50• Today’s cost Avalon pilot project would cost today about $445,000• For a 100,000 cubic yard project back passing would cost $820,000• Sand Back Passing offers more economical method to address “Hotspots”
Avalon, NJ Estimate Cost Analysis• ACOE estimates Avalon’s “hotspot” loses 135,000 cubic yards (CY) annually• ACOE estimates 3 year maintenance cycles for Avalon• Triggered when the beach reaches a loss of 405,000 yards• Three hydraulic maintenance projects cost at today’s rates $16,747,500 million• Includes $8.85 million in mobilization cost and $7,897,500 for sand• Total sand required nearly 1,215,000 CY of sand• Approximately 110,000 CY carried to permitted borrow zone beach• 100,000 cubic yards recycled annually to erosional hotspot to slow the loss rate• Reduces erosion rate to 35,000 yards per year through back passing• Back passing would extend the cycle to every 11.5 years
Sand Back Pass SavingsMethod ofDeliveryCubic YardsRequiredPrice Per CubicYardMobilizationCostTotal ProjectCostBack PassSavingsHydraulicDredging 100,000 $7.00 $2.95 million $3.65 Million $2.83 millionTruck-HauledQuarry 100,000 $17.50 $40,000 $1.8 Million $980,000Sand BackPassing 100,000 $7.50 $70,000 $820,000• 3 nourishment cycles cost for hydraulic dredging estimated at $16,747,500 million• Sand Back Passing cost same timeframe $7.38 million saving $9,367,500 million• Recycles 900,000 CY vs pumping 1.21 million CY of sand from offshore sources
Potential for Jersey Communities• Other New Jersey’s coastal communities can benefit from sand back passing• Brigantine New Jersey’s erosional “hotspot” located on the north end• Erosion zone losses 95,000 CY annually while south end gains 131,500 CY annually• Ocean City has similar areas of excess sand accumulation to use in erosion zones• The City of North Wildwood is defining a surplus zone on its beach to utilize• In addition NW has reached out to its island neighbors• City of Wildwood and Wildwood Crest receive excess sand causing maintenanceissues• Back Passing can reduce expense of chronic erosion maintenance by recycling sand
<strong>Beach</strong> Cross-section of Avalon Borrow Zone
Ocean City Accretive ZoneShed project sand accumulates between 16 th & 34 th Streets
North Wildwood & Wildwood 20-Year Trend• North Wildwood beach shows 20-year erosional trend• City of Wildwood and Wildwood Crest are recipients of excess sand carried longshore• North Wildwood, Wildwood & Wildwood Crest mutually benefit from Back Passing20- Year Sand Volume Changes at Site 111, No. Wildwood20- Year Sand Volume Changes at Site 110, Wildwood1005000400-100Cu. Yds. of Sand per Foot-200-300-400Cu. Yds. of Sand per Foot300200100-500-6000-700-100F 1987F 1988F 1989F 1990F 1991F 1992F 1993F 1994F 1995F 1996F 1997F 1998F 1999F 2000F 2001F 2002F 2003F 2004F 2005F 2006F 1987F 1988F 1989F 1990F 1991F 1992F 1993F 1994F 1995F 1996F 1997F 1998F 1999F 2000F 2001F 2002F 2003F 2004F 2005F 2006YEARYEARSite111CumulativeSite110Cumulative
Jersey Shore <strong>Stabilization</strong> Efforts• Approximately 5.6 miles (4.4%) of armoring (revetments and seawalls)• Approximately 1 mile breakwater installation• 24 Inlet jetties and 368 groins armor the coastline• Structures often have an effect on the beaches updrift and downdrift• As of 2008, over $800 million dollars was spent on beach fill projects in New Jersey
Atlantic City Northend <strong>Stabilization</strong> Project• Federal, State and City project designed to stabilize northend erosivebeaches• Joint use of stabilization structures and beach nourishment• Includes extending and rehabilitating existing groins• Construction of submerged rock sill to retain sand• Construction of low profile groin to form a closed cell• Project designed to maintain modest shore protection in erosion zone• While allowing initial post nourishment sand loss to downdrift beaches
Review• Overdevelopment on NJ coast limits natural landward beach migration• Development sand motion in response to changing sea and climate• Overdevelopment threatens property & infrastructure from storm damage• Requires attempts to turn a dynamic environment into a static system• Sand back passing can supplement shoreline stabilization efforts• Sea level rise requires better management practices to preserve ourshoreline for future generations