Box and Whisker Plots WHY? HOW?
Box and Whisker Plots WHY? HOW?
Box and Whisker Plots WHY? HOW?

You also want an ePaper? Increase the reach of your titles
YUMPU automatically turns print PDFs into web optimized ePapers that Google loves.
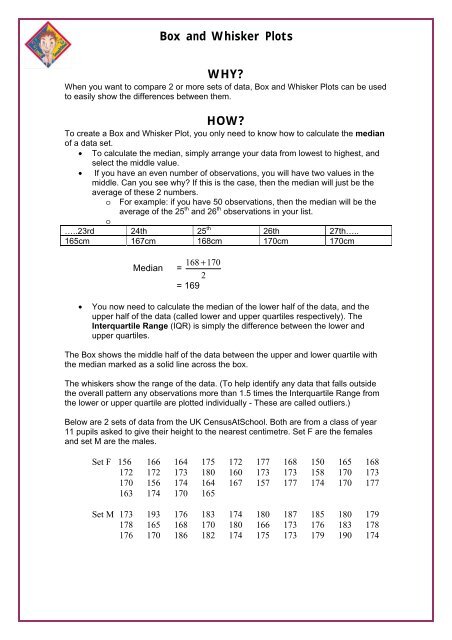
<strong>Box</strong> <strong>and</strong> <strong>Whisker</strong> <strong>Plots</strong><strong>WHY</strong>?When you want to compare 2 or more sets of data, <strong>Box</strong> <strong>and</strong> <strong>Whisker</strong> <strong>Plots</strong> can be usedto easily show the differences between them.<strong>HOW</strong>?To create a <strong>Box</strong> <strong>and</strong> <strong>Whisker</strong> Plot, you only need to know how to calculate the medianof a data set.• To calculate the median, simply arrange your data from lowest to highest, <strong>and</strong>select the middle value.• If you have an even number of observations, you will have two values in themiddle. Can you see why? If this is the case, then the median will just be theaverage of these 2 numbers.oFor example: if you have 50 observations, then the median will be theaverage of the 25 th <strong>and</strong> 26 th observations in your list.o…..23rd 24th 25 th 26th 27th…..165cm 167cm 168cm 170cm 170cm168 +170Median =2= 169• You now need to calculate the median of the lower half of the data, <strong>and</strong> theupper half of the data (called lower <strong>and</strong> upper quartiles respectively). TheInterquartile Range (IQR) is simply the difference between the lower <strong>and</strong>upper quartiles.The <strong>Box</strong> shows the middle half of the data between the upper <strong>and</strong> lower quartile withthe median marked as a solid line across the box.The whiskers show the range of the data. (To help identify any data that falls outsidethe overall pattern any observations more than 1.5 times the Interquartile Range fromthe lower or upper quartile are plotted individually - These are called outliers.)Below are 2 sets of data from the UK CensusAtSchool. Both are from a class of year11 pupils asked to give their height to the nearest centimetre. Set F are the females<strong>and</strong> set M are the males.Set F 156 166 164 175 172 177 168 150 165 168172 172 173 180 160 173 173 158 170 173170 156 174 164 167 157 177 174 170 177163 174 170 165Set M 173 193 176 183 174 180 187 185 180 179178 165 168 170 180 166 173 176 183 178176 170 186 182 174 175 173 179 190 174
EXAMPLEFor Set F1. Order the data from smallest to highest (34 obs)150 156 156 157 158 160 163 164 164 165 165 166167 168 168 170 170 170 170 172 172 172 173 173173 173 174 174 174 175 177 177 177 1802. Median = 170 + 170 2= 170cmUpper quartile = 173 cmRange 180 – 150 = 30Lower Quartile = 164 cmIQR = 9 cm<strong>Box</strong>plot of F emale150160170180Fem aleUse the figures given to check on the outlier shown i.e. using the IQR rule we can seethat the lower quartile minus 1.5 times the IQR is equal to 150.5 cm.Now construct a <strong>Box</strong> <strong>and</strong> <strong>Whisker</strong> Plot for the set M <strong>and</strong> compare with set F. Whatare you conclusions? ****Note that there are no outliers. Check yourself that the lower <strong>and</strong> upper limits foroutliers are 159.5cm <strong>and</strong> 195.5cm respectively.You may wish to record your class heights <strong>and</strong> compare these with the year 11 UKstudents.Additional thoughtsWhat do you think would happen to the median of the UK year 11 boys if the tallest boywas actually 213cm? Do you think it would change? Obviously this height would beconsidered an outlier using the IQR rule. This should tell you something about themedian, <strong>and</strong> whether it is affected by outliers. What about the mean? Does thischange?Which would be the ‘better’ measure of centre? See if you can find out when youshould use the mean instead of the median, <strong>and</strong> when the 2 values will be the same.**** For Set MMedian = 177 cmUpper quartile = 182 cmRange 193 – 165 = 28Lower Quartile = 173 cmIQR = 9 cm