FEDERATION OF EURO-ASIAN STOCK EXCHANGES ANNUAL REPORT <strong>JUNE</strong> <strong>2013</strong>FEDERATION OF EURO-ASIAN STOCK EXCHANGESMustafa BaltaciSecretary General of <strong>FEAS</strong>As of December 2012, the number of tradedcompanies admitted to listing only, in <strong>FEAS</strong>member markets reached a regional totalof 6,306 and market capitalization reachedUS$ 705,726.2 million showing an increaseof US$ 83,981.5 million or 11.0% over 2011.2012 Market Activity in the Region:The <strong>FEAS</strong> Region contains 34 memberexchanges and 16 affiliate members(represented by clearing and settlementinstitutions, dealer’s associations and regionalfederations) in 30 countries.As of December 2012, the number of tradedcompanies admitted to listing only, in <strong>FEAS</strong>member markets reached a regional totalof 6,306 and market capitalization reachedUS$ 705,726.2 million showing an increaseof US$ 83,981.5 million or 11.0% over 2011.The <strong>FEAS</strong> region over the last 5 years has forthe most part grown consistently with a breakin that pattern in 2009 due to the aftermath ofthe global crisis in 2008. We can see that theeffects of the crises were more strongly felt in2008 as compared to 2009 thru 2012 althoughequities have not shown a full recovery we dosee improvement in the fixed income market.In 2012 Equity EOB Turnover was US$ 426,934million. The 5-year statistical comparison showsthat markets are providing stronger listings withgreater transparency, and that market forcescontinue to push toward issuer quality versusmaterial privatization quantity. The average dailytrading volumes in the stock segment continuedto grow over the last 5 years 22% increase in<strong>2013</strong> in terms of number of shares traded. Theregional figures show a shift in trading fromStocks to Bonds and other instruments as t-bills,currency, repo/reverse repo and derivativesIn addition, the development in the <strong>FEAS</strong>markets can be seen through results in theadjusted annualized return on member indices.*For individual member statistics, please go to the statisticssection at the end of the Report.<strong>2013</strong> CALENDAR OF MEETINGSApril 28-305th International Orientation Course on IslamicCapital Markets, Tehran, IranMay 1-2First National Corporate Governance Conference(Achieving Iran’s Development Vision), Tehran, IranMay 7-107th International Exhibition of Exchange,Bank & Insurance (Finance Industry & InvestmentFair “FIIF”), Tehran, IranMay 23Spring Working Committee Meeting, Sarajevo,Bosnia & HerzegovinaMay 24SASE Annual MeetingJune 8Kazakhstan Stock Market Presentation DayJune 18Euromoney Events for Borsa - Istanbul EuroasianFinancial Forum, Istanbul, TurkeySeptember 19OIC, Istanbul, TurkeySeptember 20Turkish Arab Capital Markets ForumSeptember 25-27SFOA 34th Bürgenstock Meeting, Geneva,SwitzerlandSeptember 30BIFEC (Borsa Istanbul Finance and EconomyConference)October 16-1923rd Zagreb Stock Exchange and 7th FundManagement ConferenceNovemberCelebration of the 20th Anniversary of KazakhstanStock ExchangeDecember 1-4General Assembly & Executive Board of DirectorsMeeting & Working Committee, Muscat, OmanPAGE 6
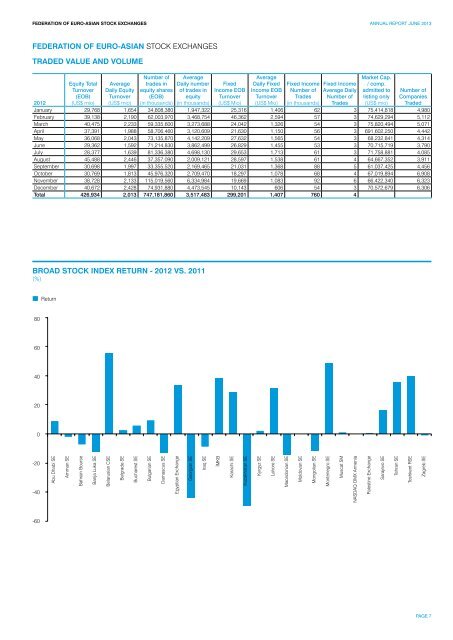
FEDERATION OF EURO-ASIAN STOCK EXCHANGES ANNUAL REPORT <strong>JUNE</strong> <strong>2013</strong>FEDERATION OF EURO-ASIAN STOCK EXCHANGESTRADED VALUE AND VOLUMEEquity TotalTurnover(EOB)(US$ mio)AverageDaily EquityTurnover(US$ mio)Number oftrades inequity shares(EOB)(in thousands)AverageDaily numberof trades inequity(in thousands)FixedIncome EOBTurnover(US$ Mio)AverageDaily FixedIncome EOBTurnover(US$ Mio)Fixed IncomeNumber ofTrades(in thousands)Fixed IncomeAverage DailyNumber ofTradesMarket Cap./ comp.admitted tolisting only(US$ mio)Number ofCompaniesTraded2012January 29,768 1,654 34,808,380 1,947,322 25,316 1,406 62 3 75,414,818 4,980February 39,138 2,190 62,003,970 3,468,754 46,362 2,594 57 3 74,629,294 5,112March 40,475 2,233 59,335,600 3,273,688 24,042 1,326 54 3 75,820,494 5,071April 37,391 1,988 58,706,460 3,120,609 21,630 1,150 56 3 691,602,250 4,442May 36,068 2,043 73,135,870 4,142,209 27,632 1,565 54 3 68,232,841 4,314June 29,362 1,592 71,214,830 3,862,499 26,829 1,455 53 3 70,715,719 3,790July 28,377 1,639 81,336,380 4,698,130 29,653 1,713 61 3 71,758,881 4,085August 45,488 2,446 37,357,090 2,009,121 28,597 1,538 61 4 64,667,352 3,911September 30,698 1,997 33,355,520 2,169,465 21,031 1,368 88 5 61,037,425 4,456October 30,769 1,813 45,976,320 2,709,470 18,297 1,078 68 4 67,019,894 6,908November 38,728 2,133 115,019,560 6,334,984 19,669 1,083 92 6 66,422,340 6,323December 40,672 2,428 74,931,880 4,473,545 10,143 606 54 3 70,572,679 6,306Total 426,934 2,013 747,181,860 3,517,483 299,201 1,407 760 4Broad Stock Index Return - 2012 vs. 2011(%)Return806040200-20-40Abu Dhabi SEAmman SEBahrain BourseBanja Luka SEBelarusian CSEBelgrade SEBucharest SEBulgarian SEDamascus SEEgyptian ExchangeGeorgian SEIraq SEİMKBKarachi SEKazakhstan SEKyrgyz SELahore SEMacedonian SEMoldovan SEMongolian SEMontenegro SEMuscat SMNASDAQ OMX ArmeniaPalestine ExchangeSarajevo SETehran SEToshkent RSEZagreb SE-60PAGE 7