resource states - Stellwagen Bank National Marine Sanctuary - NOAA
resource states - Stellwagen Bank National Marine Sanctuary - NOAA
resource states - Stellwagen Bank National Marine Sanctuary - NOAA
- No tags were found...

Create successful ePaper yourself
Turn your PDF publications into a flip-book with our unique Google optimized e-Paper software.
IV.Re s o u r c eSt at e sThis section documents the status, pressuresand current protections for sanctuary <strong>resource</strong>s.These <strong>resource</strong>s include seafloor andwater column habitats, benthic invertebrates,fishes, seabirds, sea turtles, marine mammalsand maritime heritage <strong>resource</strong>s. This sectionprovides context and validation for the sanctuaryaction plans.47
Co n t e x tThe nutrient-rich waters of the <strong>Stellwagen</strong> <strong>Bank</strong> sanctuarysustain an abundant biodiversity largely representative ofthe GoM LME and totaling well over 575 species of marinelife including over 80 species of fish, 34 species of seabirdsand 22 species of marine mammals, for example. As acomparatively shallow continental shelf area, offering greatvariety among its geological features and topographic relief,the sanctuary is a biodiversity haven when compared to theopen ocean of the North Atlantic. In addition to the arrayof different kinds of species, the sanctuary exhibits diversehabitats, biological communities and species assemblagesand displays a complex tapestry of interwoven environmentalprocesses, all of which are extensively impacted bymultiple human uses.Biodiversity in the sanctuary is heavily mediated throughhabitat type and condition. In this document, habitats aredivided into two principal categories: seafloor (benthic)and water column (pelagic) habitats. These habitats arecomposed of multiple types, such as gravel beds and piledboulder reefs. Habitat quality and structural complexityare important factors in supporting biodiversity. Forexample, the condition of benthic habitat affects the lifehistory processes of recruitment, survivorship and growthof the organisms that occupy the seafloor. The condition ofhabitats also influences the community processes of competition,predation and symbiosis. Within water column habitats,water quality can affect biodiversity by prohibiting orenabling survival of rare or cosmopolitan species.Understanding the processes that control the abundance,distribution and interaction of species (i.e., the functionalcomposition of communities) is a central challenge facingmanagement of the sanctuary. The level of difficulty inmeeting this challenge is heightened by recognition thatthe sanctuary’s <strong>resource</strong> <strong>states</strong> are greatly compromised.Water quality is threatened by multiple sources of pollution,including point, non-point and atmospheric sources andmarine debris. Population declines and biomass removals,degraded seafloor habitats and invasive species compromisethe ecological integrity of the sanctuary. Coastal planningand fishery management policies have limited, but notprevented, harmful impacts—both incremental and cumulative—onsanctuary <strong>resource</strong>s.This section is organized within a Pressure-State-Responseframework that mirrors the approach used in the <strong>Stellwagen</strong><strong>Bank</strong> <strong>National</strong> <strong>Marine</strong> <strong>Sanctuary</strong> Condition Report (NMSP,2006). “Pressures” are human activities (such as fishing orpollutant discharge), which alter the marine environmentleading to changes in the “state or condition” of sanctuary<strong>resource</strong>s (e.g., water quality, ecological integrity, habitatcomplexity). <strong>Sanctuary</strong> management then “responds” (e.g.,Action Plans section) to changes in pressures or <strong>states</strong> withpolicies, programs, and/or regulations intended to prevent,eliminate or mitigate pressures and/or environmental damagein order to protect and conserve sanctuary <strong>resource</strong>s.<strong>Sanctuary</strong> <strong>resource</strong>s described in this section are: seafloorhabitat, water column habitat, benthic invertebrates, fishes,seabirds, sea turtles, marine mammals and maritime heritage<strong>resource</strong>s. Each <strong>resource</strong> subsection begins with asummary of its status based on the best available informationfollowed by the known human pressures that impact thestatus. A summary of the current protection measures thatare in place affecting the <strong>resource</strong> in question is presentednext.48<strong>Stellwagen</strong> <strong>Bank</strong> <strong>National</strong> <strong>Marine</strong> <strong>Sanctuary</strong> Draft Management Plan/Environmental Assessment
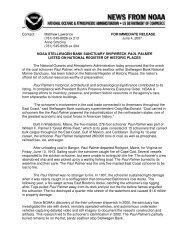
Se a f l o o r a s Ha b i t atSt a t u sThe species composition of seafloor communities in generalis highly correlated with the grain size of benthic sediments,and seafloor substrata represent an important componentof habitat for many organisms in the sanctuary. Recentstudies on the continental shelf of the northeastern UnitedStates, including portions of SBNMS, indicate that substrateand water mass characteristics are highly correlated withthe composition of benthic communities (e.g., Auster et al.,2001; Skinder, 2002) and may therefore serve as proxiesfor the distribution of biological diversity, where detailedinformation on the distributions and abundances of speciesis lacking (Cook and Auster, 2006).Infaunal invertebrates, those that burrow into the seafloor,show strong associations with grain size in sand and unconsolidatedmud sediments in the sanctuary (Grannis andWatling, 2004). Epifaunal species, those that live on theseafloor, are linked to variation in larger grain sizes at thescale of the GoM (Skinder, 2002). Within each habitat type,there are many microhabitats formed by the combinationof habitats and inhabiting organisms. For example, cerianthidanemones that burrow in mudprovide structure and shelter on theseafloor and serve as important habitatfor redfish and hake (Figure 16).Biological communities are formedby the interaction of populationswith habitats in a particular area.The interaction of fish with theirhabitat is of particular concern andhas been well-studied in the <strong>Stellwagen</strong><strong>Bank</strong> sanctuary. For purposesof discussion in this document, theecological role of seafloor habitats islargely restricted to our understandingof links to the distribution andabundance of fishes. Higher plantsare virtually absent from and playno substantive role in structuringseafloor habitats in the sanctuary; instead benthic invertebratesmake up the biogenic structure of the seafloor. In theabsence of vascular plants, benthic microalgal productionon <strong>Stellwagen</strong> <strong>Bank</strong> is important and can be high (Cahoonet al., 1993).Ha b i tat Mediated In t e r a c t i o n sFi g u r e 16. Ex a m p l e o f a m i c r o h a b i tatf o r m e d within a m u d h a b i t a t b yb u r r o w i n g a n e m o n e s.In this example, Cerianthid anemones providerefuge to juvenile Acadian redfish. Imagecourtesy: Ivar Babb and Peter Auster, NURC-UConn.There is an important biogenic component to habitatcomplexity. For instance, many fish species in the sanctuaryassociate with particular microhabitats formed by otherliving organisms (Auster, 1998). Attached and emergentinvertebrates such as erect sponges and burrowing anemonesprovide important habitat structure, while certain megafaunalorganisms such as skates produce pits and burrows,which also provide structure by adding to the complexity ofsediment surfaces. Reductions in seafloor habitat complexityincrease the mortality of early demersal phase juvenilefish, such as Atlantic cod and winter flounder that utilize thestructure provided by emergent fauna and physical substratafor protection from predation (Tupper and Boutilier, 1995;Lindholm et al., 1999; Scharf et al., 2006). Modeling studieshave demonstrated that such habitat-mediated mortalityof juvenile fish can have significant population-level effects(Lindholm et al., 1998, 2001).The distribution and abundance of demersal fishes at largespatial scales is correlated with temperature and depth, butmedium to small-scale variation is attributed to considerableextent to habitat attributes (i.e., sediment type, structuralcomplexity, prey type and abundance) on the seafloor(Langton et al., 1995). The distribution of a variety ofdemersal fishes in the GoM LME is correlated with variousstructural habitat features such as boulder reefs, distributionof sand wave features, density of amphipod tubes, and presenceand density of sponges, anemones and other epifauna(Auster et al., 1997, 1998, 2003a, 2003b; Auster 2005;Auster and Lindholm 2006). The communities of fishes inthe sanctuary are directly correlated with particular habitatsdefined by a combination of both geologic and biologicattributes (Auster et al., 1998).The patchiness and spatial arrangementof habitats mediate many ofthe behavioral interactions of fishes.Fish exhibit, as many mobile organismsdo, a range of behavioral interactionsthat have negative, neutral,or positive consequences in termsof growth and survivorship. Forexample, predation has a positiveconsequence for the predator anda negative one for the prey. Otherinteractions include competitionand mutualism. Competition forshelter sites can be intense whenthe abundance of individuals is highand shelter space is limited, such asrock crevices for night-time shelterrequired by cunner. Mutualisticrelationships within and betweenIV. Resource States 49
fish species are often short term in scope and mediated inpart by habitat features. For example, the foraging activitiesof one species can aid in prey capture of other species.Flounders are sometimes followed by piscivores such assilver hake which gain access to disturbed prey such asshrimp and small fish when flounders sift through sedimentsin search of infaunal prey (e.g., Auster et al., 1991, 2003a).Such relationships, while lasting only tens of seconds, arerepeatedly linked to particular habitats and species groupsand constitute important feeding strategies.Habitat complexity mediates access to prey and the behavioraltrade-offs in minimizing risk of predation. For example,Acadian redfish are zooplanktivores and feed in the watercolumn above boulder reefs. Height of fishes above thereef dictates the rate of water flow that delivers prey anddistance to shelter is a measure of hunger level and the riskof predation individuals would take. In general, smaller fishventure less from shelter than larger individuals. Further,boulder reef structure also mediates the species compositionand abundance on different parts of reefs. For example,while Acadian redfish are dominant on the central parts ofreefs with deep crevices formed by piled boulders, cunnerincrease in abundance on the margins of reefs, possibly dueto the availability of smaller shelter sites that are better suitedto this species than open deep crevices. Cusk generallyoccur in deep crevices on the central parts of reefs whileocean pout and Atlantic wolfish occur in burrows along reefmargins (Auster and Lindholm, 2006).As the density of a species within a habitat increases thereis increased competition for <strong>resource</strong>s such as shelter andprey. At some stage emigration from the habitat patch anda search for new habitats is a choice made by individualswho have access only to marginal shelter sites (e.g., withincreased risk of predation) or access only to areas of reducedprey abundance (e.g., with reduced growth). Acadianredfish exhibit distribution patterns that are consistent withincreased migration from boulder reefs, due to competitionfor shelter or prey, as animals grow in size (Auster et al.,2003b). While young-of-the-year redfish were found onlyin boulder reefs due to habitat selection or extreme predationin other habitats, some older juvenile redfish move tohabitats composed of dense burrowing anemones. Suchhabitats provide some shelter away from boulder reefs aswell as access to zooplankton prey.Ha b i tat Mediated MovementMediation of fish movement by different habitat types andfeatures is not well understood for species in the GoM. Thisinformation is needed to understand how key predatorslike Atlantic cod influence the structure and compositionof biological communities in the sanctuary. The degree oflocalized movement by individuals and their tenure of residencydifferentiated by habitat type and season are importantaspects to be understood, as are the associated factorsof size and sex. The successful conservation and managementof cod and other commercially important species inthe GoM is highly dependent on this information as well.Site residency and fidelity among Atlantic cod stocks is nowwidely documented (Robichaud and Rose, 2004; Wright etal., 2006; Neat et al., 2006; Lindholm et al., 2007).A study was begun in 2001 in the sanctuary that usedacoustic telemetry technology to quantify cod movementover different habitat features of the sanctuary landscape.Cod were caught and tagged with coded-acoustic transmitters(each of which emits a unique identification code) thenreleased within the overlap of the sanctuary and the WesternGulf of Maine Closed Area (WGoMCA). Movementsof tagged cod were recorded by an array of four acousticreceivers deployed on the seafloor. Data were collected atthe scale of minutes for several months at a time. Preliminarytracking occurred in the gravel habitat of northeastern<strong>Stellwagen</strong> <strong>Bank</strong> in 2001 (Lindholm and Auster, 2003).From May 2002 through October 2002 and from September2004 through March 2005, cod movement was investigatedat additional four piled boulder reef sites (Lindholm et al.,2007). The same piled boulder reefs were used in both periodsin order to quantify any influence of seasonality on codmovement behavior.Three broad categories of movement behavior were identifiedat each of the four piled boulder reefs, across years andacross seasons: 35% of adult cod (38-94 cm total length)showed very high site fidelity to individual boulder reefs(greater than 80% of 1-hour time bins); 51% of cod left aftera couple of days and were never recorded again; the remaining13% fell somewhere in between those two extremes.Several animals were recorded at more than one reef. Afew animals exhibited behavior that may be evidence ofhoming. The behavior did not differ significantly with fishlength, among individual reefs, and between summer andwinter.These results are strong evidence that some subset of thecod population in the sanctuary is “resident” on boulderreefs. The results of this study are consistent with the resultsof a review of 100 years of cod tagging studies in the NorthAtlantic. The review revealed that 32% of the tagged codin the northwest Atlantic exhibited the sedentary behavior(Robichaud and Rose, 2004). The high site fidelity of manycod to individual piled boulder reefs suggests that habitatspecificmanagement measures, such as marine reserves,may offer significant protection to cod within the sanctuary.Neat et al. (2006) conclude that marine protected areascould be an effective management measure in sustainingsmall resident populations of Atlantic cod.Ha b i tat a n d So u n d Pr o d u c t i o nSound production by fishes can serve a variety of purposesincluding species identity, individual identity, mate location,readiness to spawn, individual size and level of aggressiveness(Lobel, 2002). Over 150 species of fish in thenorthwestern Atlantic and at least 51 from the New Englandregion are known to produce sounds (Fish and Mowbray,1970; Rountree et al., 2002). Species across a spectrum ofdiversity, like Atlantic cod, haddock, silver hake, longhornsculpin, cusk, fawn cusk-eel, American eel and cunner allproduce sounds, although the behavioral context for produc-50<strong>Stellwagen</strong> <strong>Bank</strong> <strong>National</strong> <strong>Marine</strong> <strong>Sanctuary</strong> Draft Management Plan/Environmental Assessment
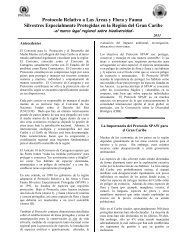
ing sounds for these and other species is not always clear.However, there are clear relationships between particularsounds and spawning events in species like Atlantic cod,haddock, cusk, and fawn cusk-eel. Assuming much ofsound production is behavior-specific, correlations betweenhabitat selection and use in terms of spawning or territorialdefense among demersal fishes is inferred.Seafloor Ha b i tat Re c ov e r yContextIn May 1998, <strong>NOAA</strong> Fisheries Service established theWGoMCA at the recommendation of the NEFMC for thepurpose of recovering groundfish stocks, specifically Atlanticcod and haddock. Gear capable of catching groundfishwas prohibited from this closed area, specifically bottomtendingtrawl gear, bottom-tending gillnets, and clam andscallop dredges. Allowable gear included lobster pots,hagfish pots, pelagic longline, pelagic hook and line fishing,recreational hook and line, pelagic gillnets, tuna purse seiningand midwater trawls. The closure area overlaps 22 %(453 km 2 ) of the sanctuary along the eastern boundary; thearea of overlap has been dubbed the “sliver” (Figure 17).In May 2004, <strong>NOAA</strong> Fisheries Service, at the recommendationof the NEFMC, designated the majority of the WGoMCAas a “Level 3” habitat closed area for the purpose of protectingEFH. A Level 3 habitat closed area is closed indefinitelyon a year-round basis to all bottom-tending mobile gear.In addition to prohibiting bottom-tending mobile gear, theclosure prohibits bottom-tending gillnets, clam and scallopdredges, and shrimp trawls. Allowable gears in this closureare: lobster pots, hagfish pots, pelagic longline, pelagic hookand line fishing, recreational hook and line, pelagic gillnets,tuna purse seining and midwater trawls except for shrimp.For a complete listing of prohibited and allowed gear visitURL http://www.nero.noaa.gov/nero/fishermen/multispecies/gom/CAYearRound.htm#wgomca.There are several properties of the sliver that make it a suitablechoice for a habitat research area, including scientific,practical and political rationales:• The sliver includes the major seafloor habitat types foundin the GoM — bedrock outcrop, boulder, gravel, mudand sand. This habitat mix enhances the exportability andextrapolation of research results to diverse areas outsidethe habitat research area.• The habitats in the sliver are distributed on both sides ofthe closure boundaries, both within the sanctuary (to thewest) and outside of the sanctuary proper (to the east),making comparative habitat studies possible across theboundaries.• The proximity of the sliver to the ports of Boston, Gloucester,Scituate, Plymouth and Provincetown make it accessibleto researchers for day-trips using small and relativelyinexpensive vessels, which makes research in the slivermore cost-effective than at alternative offshore northeastcontinental shelf locations.• The sliver has already been closed to commercial bottomfishing for nine years. From a scientific perspective, thisgreatly enhances study of the ecological processes andexpedites the timeline on which research results can beattained.Fi g u r e 17. Ma p d e p i c t i n g t h e WGoMCA (c r o s s-h a t c h e d)a n d i t s o v e r l a p w i t h t h e St e l lwa g e n Ba n k s a n c t u a r y.Majority of the WGoMCA is a Level 3 habitat closed area (redoutline) for the purpose of protecting EFH.De Facto Reference AreaThere is no formally designated undisturbed reference orcontrol area in the <strong>Stellwagen</strong> <strong>Bank</strong> sanctuary. Because ofthe compelling need for a control site, the sliver has becomea de facto reference area which the sanctuary and otherresearchers are using to discern the effects of human versusnatural disturbance on seafloor habitats and their associatedbiological communities. However, the sliver is far from atrue control area owing to three shortcomings: (1) severalextractive activities are still allowed (i.e., fishing gears listedabove) that alter the area’s ecological integrity, (2) additional<strong>resource</strong>s for enforcement are needed to assure deterrenceof unlawful incursions, and (3) deep mud habitat isseriously underrepresented (75.5% gravel, 23.5% sand and1.0% mud) in the sliver making it difficult to draw definitiveconclusions about the effects of fishing in this habitat type.These shortcomings need to be addressed. As a first step,the sanctuary formally proposed on July 2, 2003 to theNEFMC through its Amendment 13 process that the sliverbe designated a ‘habitat research area’ under the MFCMA.IV. Resource States 51
• The sanctuary has the <strong>resource</strong>s to help support enforcementof the habitat research area in ways that wouldcomplement regulation under <strong>NOAA</strong> Fisheries Servicepurview.In its current capacity as a de facto reference area, thesliver is supporting several on-going long-term studies bysanctuary staff and sanctuary-supported scientists. Projectsinclude: (1) quantification of fish movement ratesrelative to seafloor habitat type (1998 to the present), (2)recovery of seafloor habitats and associated taxa followingthe cessation of trawling, dredging and bottom gillnetfishing (1998 to the present), and (3) species-area relationshipsof multiple taxa (1999 to the present).This combined research represents a public investmenttotaling more than $1.9 million over the last five years.A comparable level of investment will be made over thenext several years. The results of these ongoing projectsin the sliver, and other projects currently in various stagesof planning and proposal preparation, will contribute toadvancing ecosystem understanding in the sanctuary andby extension the GoM. The NEFMC is in the process ofrevising its omnibus amendment to better protect EFH andhas not yet acted on the sanctuary proposal.Pr e s s u r e sDi s t u r b a n c e in GeneralDisturbance is defined as any discrete event in time thatdisrupts ecosystem, community, or population structureand changes <strong>resource</strong>s, substrate availability or the physicalenvironment (Pickett and White, 1985). Disturbancecan be caused by many natural processes such as currents,predation and iceberg scour (Hall, 1994). Human causeddisturbance can result from activities such as harbordredging, cable laying and fishing with fixed and mobilegear. Disturbance can be gauged by both intensity (asa measure of the force of disturbance) and severity (as ameasure of impact on the biotic community). Generalconcepts associated with the types and ecological implicationsof spatially mediated disturbance are described inthe accompanying Sidebar.Table 3 summarizes the effects of the range of agentswhich produce disturbance in marine communities. Thevarious forms of disturbance range from small to largein spatial scale as well as acute to chronic in periodicity.From an ecological perspective, fishing is the mostwidespread form of direct disturbance in marine systemsbelow depths (approximately 85 m) which are affectedby storms (Watling and Norse, 1998; Auster and Langton,1999; <strong>National</strong> Research Council, 2002).Activities that have the greatest potential impact on theseafloor habitats of the sanctuary are the laying of underwatercables and pipelines, the use of mobile fishing gears,removal of forage species and bycatch due to fishing, andocean dumping. The chief distinction between theseactivities is whether they produce chronic (repeated) oracute (intermittent) disturbance. Chronic disturbance hasTypes of Spatially Mediated Habitat DisturbanceThe spatial extent of disturbed and undisturbed biologicalcommunities is a concern in designing and interpretingresearch studies (Pickett and White, 1985; Thrush et al.,1994) and in managing the sanctuary. Single, widelyspaced disturbances may have little overall effect on habitatintegrity and benthic communities, and may show reducedrecovery times as a result of immigration of mobilespecies (e.g., polychaetes, gastropods). In the ecologicalliterature, this is a “Type 1” disturbance, where a smallpatch is disturbed but surrounded by a large unimpactedarea.In contrast, a “Type 2” disturbance is one where a smallpatch is unimpacted but surrounded by a large disturbedarea. Recruitment into such patches requires largescale transport of larvae from outside source patches,or significant reproductive output (and high planktonicsurvival and larval retention) from the small undisturbedpatches. Making predictions about the outcome of eithertype of disturbance, even where spatial extent is known, isdifficult since transport of colonizers by either immigrationor recruitment depends on oceanographic conditions,larval period, movement rates of juveniles and adults, timeof year and distance from source.Type 1 disturbances have habitat recovery rates that aregenerally faster because they are subject to immigrationdominated recovery versus the dependence on larvalrecruitment for the recovery of Type 2 disturbances. Theassociated population responses of obligate and facultativehabitat users to such disturbances are also variable.Obligate users are restricted by narrow requirements andhave no habitat options; facultative users have optionsbecause of less restrictive requirements. Obligate habitatusers have a much greater response to habitat disturbancethan facultative users.Comparatively, it would be difficult to detect responsesfrom populations of facultative habitat users to Type1 disturbance because of the large adjacent areas ofundisturbed habitat. Type 2 disturbances would producelarge responses in obligate habitat users because a largepercentage of required habitats would be affected.Facultative habitat users would have a measurable responseonly at population levels where habitat mediated processesbecame important.This discourse on the types of spatially mediated habitatdisturbance and the respective responses of obligate andfacultative habitat users is relevant to how the sanctuarywill eventually have to approach management of fishingactivities and other impacts to biogenic habitats (structureand associated populations). The majority of sanctuaryarea is subjected to chronic disturbance by fishing and thesliver is the only relatively unimpacted patch (see sectionson spatial distribution and density of commercial andrecreational fishing under Human Uses in this DMP).52<strong>Stellwagen</strong> <strong>Bank</strong> <strong>National</strong> <strong>Marine</strong> <strong>Sanctuary</strong> Draft Management Plan/Environmental Assessment
Ta b l e 3. Co m p a r i s o n o f i n t e n s i t y a n d s e v e r i t y o f va r i o u s s o u r c e s o f p h y s i c a l d i s t u r b a n c e t o t h e s e a f l o o r (b a s e d o nHa l l (1994) a n d Wa t l i n g a n d No r s e (1998)).Intensity is a measure of the force of physical disturbance and severity is a measure of the impact on the benthic community (adaptedfrom Auster and Langton (1999)).Source Intensity SeverityABIOTICWavesLow during long temporal periods but high duringstorm events (to 85 m depth)Low over long temporal periods since taxa adaptedto these events but high locally depending on stormbehaviorCurrentsLow since bed shear normally lower than criticalLow since benthic stages rarely lost due to currentsvelocities for large volume and rapid sedimentmovementBIOTICBioturbation Low since sediment movement rates are small Low since infauna have time to repair tubes andburrowsPredationHUMANDredgingLand Alteration(Causing silt-ladenrunoff)Low on a regional scale but high locally due topatchy foragingLow on a regional scale but high locally due to largevolumes of sediment removalLow since sediment-laden runoff per se does notexert a strong physical forceLow on a regional scale but high locally due to smallspatial scales of high mortalityLow on a regional scale but high locally due to highmortality of animalsLow on a regional scale but high locally where siltationover coarser sediments causes shifts in associatedcommunitiesFishing High due to region wide fishing effort High due to region wide disturbance of most typesof habitatlasting effects because the ecosystem does not recover fullybefore the next disturbance. Fishing impacts have the greatesteffect on seafloor habitats of any human activity in the<strong>Stellwagen</strong> <strong>Bank</strong> sanctuary for this reason.The laying of an underwater cable has occurred only oncein the sanctuary (in 2001) and is an acute impact. Theresults of this impact are discussed below. Ocean dumpingof vessel-generated wastes occurs more frequently in thesanctuary; however, at current discharge levels and dilutionrates that activity does not have the lasting effects on physicalstructure and ecological integrity as does fishing. Muchof the following discussion of pressures applies primarily toor involves fishing activities because of the pervasivenessof those activities in the sanctuary and the abundant informationavailable in the scientific literature on the habitatdisturbance effects of fishing.Di s t u r b a n c e o f Seafloor Ha b i tat s in t h e Sa n c t ua r yPreliminary results of the Seafloor Habitat Recovery andMonitoring Project (SHRMP) (see Sidebar) are listed below.This project evaluates the relative effects of disturbance dueto laying the fiber-optic cable, fishing and natural disturbanceover a decadal time frame. Samples have beencollected from 1998-2006. While analyses of the variousapproaches are at different stages, the preliminary results todate demonstrate notable patterns and trends:1. There are significant differences in epifaunal communitystructure between boulder and gravel habitats despite thefact that both are composed of hard substrate (Tamsett, inpreparation).2. Within boulder and gravel habitat types there are differencesin community structure between sites inside andoutside the sliver indicative of impacts from fishing activities(Tamsett, in preparation).3. Within mud habitat types there are differences incommunity structure between sites inside and outside thesliver indicative of impacts from fishing activities (Grannis,2001).4. Contrasts in the composition of sand habitat communitiesinside and outside of the sliver are not clearly different,suggesting that fishing effects superimposed on backgroundpatterns of natural disturbance have similar effects on sandcommunities (Grannis, 2001).5. Community structure is changing across time both insideand outside the sliver in all habitats, suggesting a dynamicenvironment where both natural and human caused disturbances(from fishing) mediate the composition and patternshift of seafloor communities (Grannis, 2001; Tamsett, inpreparation).6. Analysis of samples from inside and outside the sliveralong the route of the fiber-optic cable does not demonstratean effect of the acute impact of the cable being laid but doessuggest a chronic effect from fishing (Grannis, 2001).7. The trench produced during the cable burial operationin 2001 is still visible in 2006 along significant parts of thepath through the sanctuary based on sidescan sonar records,demonstrating that the passage of five years has been insufficienttime for sediment transport processes to fill in thefeature (Auster and Lindholm, unpublished).IV. Resource States 53
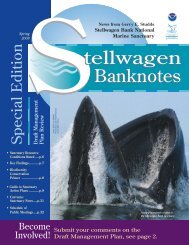
Seafloor Habitat Recovery and Monitoring Project (SHRMP)The long-term Seafloor Habitat Recovery Monitoring Project (SHRMP) was initiated in 1998, whenthe WGoMCA went into effect, and is ongoing ideally through 2010. The project uses the sliver as arelatively unimpacted reference site to quantify the recovery of seafloor habitats and associated biologicalcommunities previously subject to fishing activities and to understand the dynamics of these habitats andcommunities over time. The study design includes representative sites inside and outside the sliver in mud,sand, gravel and boulder habitat types. The study compares and contrasts the effects of natural and fishingrelateddisturbance on seafloor habitats and community structure.In 2001, <strong>NOAA</strong> permitted installation of a fiber-optic cable across the sanctuary, including the northernportion of the sliver. At that time the objectives and hypotheses of SHRMP were modified to include theeffects of the cable laying (a one-time, acute anthropogenic disturbance). The revised monitoring programbegan in summer 2001 and, pursuant to terms of the permit, will continue through 2010.Sampling. Eight sites are sampled along the fiber optic cable route, located directly over the cable trenchand in adjacent areas, both inside and outside of the sliver (Figure 18). A total of eight other sites aresampled, half inside and half outside the sliver, to monitor fishing impacts (Figure 18). Four of these sites(inside) serve as control sites; the other four (outside) sites serve as impact sites for fishing disturbance.Primary sampling of the fiber optic cable route, the fished sites and the respective control sites is done usingunderwater imaging systems (still and video) from various underwater vehicles, as well as grab samples forfine-grained sediments. Additional sampling isconducted using side-scan sonar to understandthe large scale dynamics of the seafloorlandscapes. Current meters are deployedon the seafloor to characterize the level ofoceanographic forcing of sediment transportprocesses and the related variation inlandscape features (e.g., natural disturbanceby storm driven currents).Project Objectives. The general objectiveof SHRMP is to compare the distributionsof microhabitats and associated fauna inimpacted and unimpacted areas with regard tothe laying of the fiber optic cable and fishing.This objective can be stated as two nullhypotheses (that an observed difference is dueto chance alone and not due to a systematiccause):HO(1): There are no differences in therelative abundance of each microhabitat typein impacted and unimpacted sites, and:HO(2): There are no differences in faunalabundance, density and microhabitatassociations between impacted andunimpacted sites.The specific objectives of the project are toquantify the relative impacts of the laying ofthe fiber optic cable and fishing with respectto:• fish communities• microhabitat structure• soft-sediment infaunal communities• hard-bottom epifaunal communitiesFi g u r e 18. Lo c a t i o n o f l o n g -t e r m s a m p l i n g s i t e s f o r t h eSe a f l o o r Ha b i t at Re c o v e ry Mo n i t o r i n g Pr o j e c t.Triangles indicate fiber optic cable monitoring sites; circlesindicate SHRMP sites: 1a = mud closed, 1b = mud open; 2a =sand closed, 2b = sand open; 3a = gravel closed, 3b = gravelopen; 4a = boulder closed, 4b = boulder open. Cable sites: 5a= on cable open, 5b = off cable open; 6a = on cable closed, 6b= off cable closed.54<strong>Stellwagen</strong> <strong>Bank</strong> <strong>National</strong> <strong>Marine</strong> <strong>Sanctuary</strong> Draft Management Plan/Environmental Assessment
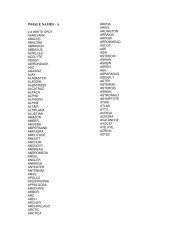
There are also trends in the composition of particular speciesand groups (Tamsett, in preparation):(a) The abundance of ascidians (primarily the tunicateMogula sp.) has increased significantly inside the sliver overtime while the brachiopod Terebratulina septentrionalis hasincreased outside. The exact mechanism is not clear fromthese observations but various types of direct and indirectinteractions, where either differential rates of survivorshipor competitive interactions mediated by fishing disturbanceresult in such patterns, are hypothesized.(b) Across the entire area there has been a decline in brittlestars, obviously resulting from some type of area-wideeffect, such as the possible heightening of predation due toincreasing demersal fish populations.(c) Finally, there is a general pattern in species groups thatprovide shelter <strong>resource</strong>s for fishes, such as sponges anderect bryozoans, to be more abundant inside the sliver thanoutside (McNaught, unpublished). This type of responseis a common pattern based on multiple reviews of fishingeffects studies.Ha b i tat Di s t u r b a n c e Du e to Fi s h i n gThe pervasiveness of disturbance by bottom trawling anddredging and the effects of that disturbance are extensivelydemonstrated by the recent literature, for example: Austeret al., 1996; Auster and Langton, 1999; Ball et al., 1999;Caddy, 1973; Churchill, 1989; Collie et al., 1997; Collie,1998; Collie et al., 2000; Dayton et al., 1995; Dupliseaet al., 2002; Engel and Kvitek, 1998; Freese et al., 1999;Friedlander et al., 1999; Hall, 1999; Hansson et al., 2000;Jennings and Kaiser, 1998; Jennings et al., 2001, 2002;Kaiser et al., 1996; Kaiser, 1998; Kaiser and de Groot, 2000;Kaiser et al., 2002; Lindegarth et al., 2000; Mayer et al.,1991; McConnaughey et al., 2000; Messiah et al., 1991;Palanques et al., 2001; Pilskahn et al., 1998; Riemann andHoffmann, 1991; Rijnsdorp et al., 1998; Roberts et al., 2000;Sanchez et al., 2000; Simpson, 2003; Simpson and Watling,2006; Smith et al., 2000; Sparks-McConkey and Watling,2001; Thrush et al., 1998, 2001; Tuck et al., 1998; Watlinget al., 2001; Watling and Norse, 1998; and Widdicombeet al., 2004. The majority of these studies were conductedin the North Atlantic, and all bear on the kinds of seafloorhabitat disturbance due to fishing that pertain to the <strong>Stellwagen</strong><strong>Bank</strong> sanctuary. Many of these studies were reviewedby the NEFMC in its Amendment 13 description of fishingeffects on the environment (NEFMC, 2003). An example ofthe intensity of bottom trawling on a seafloor habitat in thesanctuary is presented in Figure 19.Effects of DisturbanceThe disturbance of the seabed by bottom mobile fishing gear(otter trawls and dredges) is sometimes viewed as synonymouswith forest clearcutting (Watling and Norse, 1998).Structures in marine benthic communities are generallymuch smaller than those in forests but structural complexityis no less important to their biodiversity. Use of mobile fishinggear crushes, buries and exposes marine animals andFi g u r e 19. Si d e-s c a n s o n a r i m a g e o f b o t t o m o t t e r t r aw lt r a c k s o v e r t h e m u d h a b i t a t o f Gl o u c e s t e r Ba s i n in t h eSt e l lwa g e n Ba n k s a n c t u a r y.The area depicted (100 m swath width) is extensively furrowedby trawl doors during successive tows by fishing vessels. Atrawl door is attached to each side of the mouth of the net tokeep it open. Recent trawl tracks are colorized to providecontrast; earlier tracks are evident in the background. Theimage was made by side-scan sonar towed behind a researchvessel in 2005; the center stripe indicates the path of the instrument.Source: <strong>NOAA</strong>/SBNMS.structures on and in the substratum, sharply reducing structuraldiversity. It also alters bio-geochemical cycles. Thesefishing activities have a number of effects that can alter thevalue of habitats for fishes and change the composition ofepifaunal and infaunal invertebrate communities as well.A large number of research studies (e.g., Auster and Langton,1999) has shown that bottom contact fishing gearhas the following general effects on the physical structureof seafloor habitats: (1) smoothing of bedforms like sandwaves and ripples; (2) removal of habitat-forming epifaunalspecies like sponges, bryozoans and corals; and (3)removal of “ecosystem engineers” that produce variousstructures based on their activities, such as crabs and fishesthat produce burrows and depressions. Studies have alsoshown generalized effects on community composition andIV. Resource States 55
ecosystem processes. Increased disturbance from fishingcan shift stable seafloor communities from those that aredominated by slow-growing and long-lived species to thosedominated by organisms that are fast-growing and shortlived(i.e., opportunistic or weedy). While communities areoften a mosaic of both types, the large scale impacts of fishingcan homogenize communities to those dominated bythe “weedy” species that gain competitive advantage fromperiodic disturbance.Fishing activities alter the biological structure of marinehabitats as well and influence the diversity, biomass andproductivity of the associated biota (Auster et al., 1996).These effects vary according to gear used, habitats fished andthe magnitude of natural disturbance, but tend to increasewith depth and the stability and complexity of the substrate.The effects are most severe where natural disturbance isleast prevalent, where storm-wave damage is negligible andbiological processes, including growth and recruitment,tend to be slow. Benthic habitats and the effects of fishingare extensively reviewed in Barnes and Thomas, eds.(2005).Meta-Analysis of Fishing EffectsEmpirical studies of fishing effects realistically can notbe done everywhere under conditions that separate theeffects of gear type, habitat and community composition.However, it is possible to use a wide range of empiricalstudies to conduct a meta-analysis that extracts such informationfrom existing studies. Collie et al. (2000) showedthat inter-tidal dredging and scallop dredging had a greaterimpact on seafloor communities than did trawling. Further,communities in stable gravel, mud and biogenic habitats(e.g., sponges, corals) were more affected by fishing thancommunities in unconsolidated sediments like coarse grainsand. Rates of recovery after impacts were fastest in lessstable and complex habitats like sand (e.g., six months toone year), while biogenic habitats had the longest recovery,on the order of years to decades.A recent and comprehensive summary of gear effects onbenthic marine habitats was prepared by the <strong>National</strong>Research Council, which verifies and amplifies earlierresearch findings. This report, entitled “Effects of Trawlingand Dredging on Seafloor Habitat” (NRC, 2002) reiteratedfour general conclusions regarding the types of habitatmodifications caused by trawls and dredges:• Trawling and dredging reduce habitat complexity.• Repeated trawling and dredging result in discernablechanges in benthic communities.• Bottom trawling reduces the productivity of benthic habitats.• Fauna that live in low natural disturbance regimes aregenerally more vulnerable to fishing gear disturbance.The NRC report also summarized the indirect effectsof mobile gear fishing on marine ecosystems. It did notconsider the effects of all gear types, only the two (trawlsModels of Pattern Shifts in Community StateDue to DisturbanceThe first pattern is the successional model wherecommunities change from type A to B to C and soforth (Figure 20). There are empirical examplesof this type of succession in soft bottom benthiccommunities. Succession is based on one communityof organisms producing a set of local environmentalconditions (e.g., enriching the sediments with organicmaterial) which make the environment unsuitable forcontinued survival and recruitment but are favorablefor another community of organisms. Disturbancecan move the succession back in single or multiplesteps, depending on the type of conditions that prevailafter the disturbance. The successional stages arepredictable based on the conditions which result fromthe organisms themselves or from conditions after aperturbation.The second pattern is the lottery model which is lesspredictable and disturbance mediated (Figure 20).There are multiple outcomes for community recoveryafter the end of the disturbance. Empirical studies ofsuch relationships are generally found in hard substratecommunities. Shifts in community type are producedby competition and disturbance (e.g., predation,grazing, storms, fishing gear) that can result in shiftstoward community types which are often unpredictablebecause they are based on the pool of recruits availablein the water column at the time that niche spacebecomes available.Fi g u r e 20. Tw o c o n c e p t u a l m o d e l s o f pat t e r n s h i f t s inc o m m u n i t y s t at e d u e t o d i s t u r b a n c e.(from Auster and Langton, 1999).and dredges) that are considered to most affect benthichabitats.A related 2003 study of the collateral impacts of fishingmethods ranked various types of fishing gear based on severityof impacts to habitats and degree of bycatch (Morganand Chuenpagdee, 2003). The highest impact gears were:bottom-tending trawls, bottom-tending gillnets, dredges56<strong>Stellwagen</strong> <strong>Bank</strong> <strong>National</strong> <strong>Marine</strong> <strong>Sanctuary</strong> Draft Management Plan/Environmental Assessment
(e.g., scallop and clam) and pelagic gillnets. Medium impactgears were: pots and traps, pelagic longlines and bottomtendinglonglines. Low impact gears were: midwater trawls,purse seines, and hook and line.Successional Shifts in Community StateDisturbance has been widely demonstrated as a mechanismwhich shifts communities (Dayton, 1971; Pickett and White1985; Witman, 1985; 1987). Auster and Langton (1999)provide an in-depth synthesis of disturbance ecology relatedto seafloor communities and fish habitat. General modelsproduced from such work are useful for understanding fishingas an agent of disturbance from an ecological perspectiveand are discussed below.Assumptions regarding the role of fishing on the dynamicsof marine communities generally assert that the cessation orreduction of fishing will allow populations and communitiesto recover. That is, recover to a climax community state asis the case in long-lived terrestrial plant communities (e.g.,the succession of old farm fields to mature forest). That doesnot always happen in marine ecosystems.Succession of communities implies a predictable progressionin species composition and abundance. Such knowledgeof successional patterns would allow managers topredict future community <strong>states</strong> and directly managepatterns of biological diversity. While direct successionallinkages have been found in some communities, others areless predictable. Two generalized models (from Auster andLangton, 1999) that depict patterns in shifts in communitystate due to disturbance are illustrated and discussed in theSidebar.These two models of shifts in community state due to disturbanceillustrate the complexities underlying managementof biological communities in the sanctuary. Changes ofcommunity structure due to disturbance may or may notbe predictable based on numerous factors including type ofhabitat and organism. The models portend that the characterand structure of present-day communities in the sanctuaryvery likely have changed and in ways that may not bestrictly reversible.Cu r r e n t Pr o t e c t i o n<strong>Sanctuary</strong> regulations (15 C.F.R § Subpart N) prohibit drillinginto, dredging or otherwise altering the seabed of the sanctuary;or constructing, placing or abandoning any structureor material or other matter on the seabed of the sanctuary,except as an incidental result of (1) anchoring vessels; (2)traditional fishing operations; or (3) installation of navigationaids. The exemption for traditional fishing activities reducesthe effectiveness of these regulations in managing habitatdisturbance, and thereby protecting ecological integrity andmanaging for biodiversity conservation.The most effective regulations to date for protecting seafloorhabitat and communities in the sanctuary are those promulgatedby <strong>NOAA</strong> Fisheries Service under the MFCMA torestore groundfish stocks in the GoM and protect EFH. Overthe past two decades <strong>NOAA</strong> Fisheries Service, in collaborationwith the NEFMC, has promulgated fishing regulationsthat have significantly reduced fishing effort, and, therefore,habitat impacts to some degree in the northeast regionwhich includes the sanctuary. Examples of these regulationsare: reducing fishing days at sea, creating groundfishand habitat closed areas (e.g., WGoMCA), increasing netmesh size to allow escapement of juvenile fish, reducingtrawl net roller gear sizes to prevent trawlers from accessinghigh relief habitat, and creating seasonal closures to protectmigrating or spawning species.While these regulations help to reduce fishing mortality andrebuild fish stocks, with the exception of the WGoMCA androller gear size reduction, their overall effect on protectingor recovering seafloor habitats and the biological communitiesof the sanctuary is less clear.Wat e r Co l u m n a s Ha b i t atSt a t u sThe water column in the <strong>Stellwagen</strong> <strong>Bank</strong> sanctuaryrepresents important habitat for numerous planktonic andnektonic organisms as well as many fishes, turtles, seabirdsand marine mammals. In addition to the three major watermasses occurring throughout the GoM, each of whichprovides habitat for a variety of organisms, the interaction ofmoving water masses with the sanctuary’s complex seafloortopography creates local zones of upwelling and mixingthat serve as habitat as well. Additionally, features suchas thermal fronts and the thermocline (sharp temperaturegradients between water packets of differing characteristics)and shear zones (separating countervailing currents),for example, segment and highly structure the open ocean,creating ecotones that serve as unique midwater habitats.An ecotone is a transition area between two adjacentecological communities.In general, major surface currents flow counterclockwise inthe vicinity of the sanctuary. Local productivity is seasonalwith the overturning and mixing of ocean waters fromdeeper strata during the spring and fall producing a complexand rich system of overlapping midwater and benthic habitats.The heightened seasonal productivity supports a largeIV. Resource States 57
variety of marine mammal and fish species in the watercolumn. Many of these predators rely on both water columnand benthic habitats for foraging. While there is concernfor impacts to seafloor habitats due to fishing, there is alsoconcern for impacts to water column habitats due to pollutionand contamination including biological agents likeharmful algal blooms (HABs) and invasive species. Refer tothe Sidebar for a description of potential sources of pollutionand contamination. Refer to Bothner and Butman (2007) fora summary of processes influencing the transport and fate ofcontaminated sediments in Massachusetts Bay.Potential Sources of Pollution andContaminationMuch of the pollution reaching the sanctuary comesfrom non-point sources or from distant point sources.Several waste water treatment facilities dischargedirectly into Massachusetts Bay, the largest being theMassachusetts Water Resources Authority (MWRA)Boston Harbor outfall located 9.5 miles from Bostonand 12 miles west of the sanctuary border. Air pollutionfrom power plants and industrial facilities, some as faraway as the midwest, and urban smog release a varietyof chemicals over Massachusetts Bay, some of which areaccumulated by organisms.In addition, the sanctuary is heavily traveled bycommercial and recreational vessels and cruise shipsthat discharge wastes during their voyages. Shippingactivities may result in a variety of chemical releasesfrom discharges, spills and/or collisions, and thepossibility of importation of invasive species. Othersources of contamination include clean materialdisposal at the Massachusetts Bay Disposal Site(historical dumping operations there have includedhazardous military and industrial wastes anddredge spoils) and disturbances during the layingof underwater pipes and cables (only one of whichcrosses the sanctuary). Of particular concern are thecumulative impacts of multiple activities that couldcontaminate the habitats and <strong>resource</strong>s of the sanctuaryand increased environmental loading of nutrients andpollutants above scientifically established backgroundlevels.Nutrient enrichment is one factor in the developmentof harmful algal blooms (HAB). HABs are highdensities of toxic phytoplankton (Alexandrium sp.) thatcan kill marine life and impair human health. Saxitoxinfrom these organisms was implicated in the death of14 humpback whales in 1987. The most recent HABevent occurred in 2005 and covered a broad areaencompassing all of Massachusetts Bay (includingthe sanctuary) and Cape Cod Bay. While no injuryor mortality of sanctuary <strong>resource</strong>s was observed, thehighest concentration of Alexandrium cysts was recordedin the sediment of the sanctuary.Regular monitoring of key water quality indicators andassociated seafloor variables is conducted in and aroundthe sanctuary to detect and evaluate trends that could favorHABs or otherwise threaten environmental functions in thesanctuary. The <strong>Stellwagen</strong> <strong>Bank</strong> sanctuary relies on collaborationwith the MWRA for routine water quality monitoringand on the occasional assessments of the <strong>NOAA</strong> <strong>National</strong>Status and Trends (NS&T) Bioeffects (BE) Program and the<strong>National</strong> Benthic Surveillance (NBS) Program to understandand characterize the threats to and status of water columnand related seafloor habitats in the sanctuary. The NBSProgram is a collaborative effort between NS&T and <strong>NOAA</strong>Fisheries Service. The threat of introduction of water-borneinvasive species may be under-appreciated and deservingfuller understanding as provided below.Mo n i t o r i ngIn 2001, the <strong>Stellwagen</strong> <strong>Bank</strong> sanctuary increased the areacoverage of water quality monitoring within its boundariesto better determine whether the MWRA sewage outfall,which began operating in September 2000, was causingincreased eutrophication and contaminant loading. Toleverage <strong>resource</strong>s and obtain compatible information thatcould be integrated into the existing data base for ongoingmonitoring work, the sanctuary added four new stationsto MWRA’s existing five stations within the sanctuary area(Libby et al., 2006).The MWRA’s discharge permit recognizes concerns aboutpossible effects of the outfall on the sanctuary and requiresan annual assessment of those possible effects. The MWRAclassifies stations as near field and far field for the purposeof assessing potential impacts from the sewage outfall; thosein the sanctuary are included among the far field stations.Since 2001, independent contractors have sampled the fouradditional stations in August and October, which are two ofthe six MWRA survey periods each year. Sampling includesmeasurements of water column physical variables (salinity,temperature, density structure), nutrients, chlorophyll anddissolved oxygen, as well as the numbers and species ofphytoplankton and zooplankton.The four sanctuary stations are strategically placed to detectnutrient inputs to the sanctuary from the GoM and MerrimackRiver to the north, as well as from the MWRA outfallto the west (Figure 21). The data allow inferences aboutfine scale circulation patterns and water column productivityin the sanctuary. The data are also entered into a threedimensionalcomputer model that has been developed tounderstand how the system might respond to increased anddecreased levels of nutrients, dilution of outfall and dispersion(Jiang, 2006).Results to date show no evidence of increased eutrophicationor unacceptable contaminant loads in the sanctuaryrelative to the outfall startup (Werme and Hunt, 2006, 2007;<strong>NOAA</strong> 2006). Overall, water quality within the sanctuarywas excellent during 2005 and there was no indication ofany effect of the MWRA outfall (Libby et al., 2006). Whileammonium concentrations rose in the near field sampling58<strong>Stellwagen</strong> <strong>Bank</strong> <strong>National</strong> <strong>Marine</strong> <strong>Sanctuary</strong> Draft Management Plan/Environmental Assessment
Fi g u r e 21. Lo c a t i o n o f w a t e r c o l u m n s t a t i o n s ,i n c l u d i n g t h e a d d i t i o n a l St e l lwa g e n Ba n k s a n c t u a r ys t a t i o n s s a m p l e d in Au g u s t a n d Oc t o b e r 2001-2005.F32 and F33 sampled in February, March and April; otherstations sampled in February, March, April, June, August andOctober. Source: MWRA, 2006.from stations within the sanctuary and there were no changesin community parameters in 2005 (Maciolek et al., 2006).The deep-water stations continued to support a distinctinfaunal community with recognizable differences fromcommunities in the nearfield and Cape Cod Bay. Benthiccommunity parameters at individual stations showed nopattern of change following start-up of the outfall in 2000(Figure 25). Overall the numbers of individual organismsand species per sample have increased, as has the index ofspecies diversity (log series alpha), paralleling results fromthroughout Massachusetts Bay. No consistent pattern hasbeen found that relates to outfall operation.AssessmentIn 2004, field samples were taken to assess the status andtrends of chemical contamination in sediments and residentbiota and to assess the biological condition of the varioushabitat types found in the <strong>Stellwagen</strong> <strong>Bank</strong> sanctuaryarea (Figure 26). Sampling efforts employed a combinationof the <strong>NOAA</strong> NS&T BE Program and the NBS Programprotocols. The BE Program assesses sediment contamination,toxicity and benthic community condition. The NBSFi g u r e 22. An n u a l m e a n a m m o n i u m (t o p ) a n d n i t r at e(b o t t o m ) c o n c e n t r a t i o n s in t h e St e l lwa g e n Ba n ks a n c t u a r y, t h e n e a r f i e l d a n d Ca p e Co d Bay r e l at i v e t ot h e o u t f a l l s t a r t u p.Source: MWRA, 2006.stations following start of the outfall diversion, there hasbeen no parallel annual increase in the area of <strong>Stellwagen</strong><strong>Bank</strong> or Cape Cod Bay (Figure 22 top). Nitrate concentrations(Figure 22 bottom) continue to show an upwardtrend in offshore Massachusetts Bay and in the near field,a regional phenomenon that predates the outfall diversionand is not well understood.Other measurements of nitrogen and dissolved phosphatealso show these long-term trends. Concentrations of totaldissolved nitrogen (Figure 23 top) and dissolved inorganicnitrogen (Figure 23 middle) have consistently been higherin samples from the sanctuary than those measured at otherstations. In contrast, concentrations of total nitrogen havebeen similar in all regions (Figure 23 bottom).The mean annual chlorophyll levels have not changed inresponse to the outfall discharge (Figure 24). Annual chlorophylllevels were similar in the nearfield, Cape Cod Bayand <strong>Stellwagen</strong> <strong>Bank</strong>. Concentrations of dissolved oxygenand percent saturation have not declined in the <strong>Stellwagen</strong>Basin or in the near field (not shown). Rather than showinga decline, levels in 2005 were slightly high compared to thebaseline years (1992–2000).No changes in concentrations of sewage tracers or sewagerelatedcontaminants were observed in the sediment samplesIV. Resource States 59
Fi g u r e 23. To p : a n n u a l m e a n t o t a l dissolved n i t r o g e n(TDN); Mi d d l e: dissolved i n o r g a n i c n i t r o g e n (DIN);Bo t t o m : t o t a l n i t r o g e n (TN) in t h e St e l lwa g e n Ba n ks a n c t u a r y, t h e n e a r f i e l d a n d Ca p e Co d Bay r e l at i v e t ot h e o u t f a l l s t a r t u p.Source: MWRA, 2006.Fi g u r e 24. An n u a l m e a n c h l o r o p h y l l in t h e St e l lwa g e nBa n k s a n c t u a r y a n d o t h e r r e g i o n s r e l at i v e t o t h eo u t f a l l s t a r t u p.Source: MWRA, 2006.Program also addresses sediment contamination, in additionto contaminant body burdens and histological indicatorsin resident fish. Data from 2004 were contrasted withhistorical (1983–1994) <strong>NOAA</strong> data, and the data from theMWRA to assess the spatial and temporal trends in chemicalcontamination in and around the sanctuary. The workreported here was done by NCCOS in cooperation with thesanctuary and unless indicated otherwise, the followingaccount is excerpted from Hartwell et al. (2006).In an analysis of the spatial distribution of select contaminantsin sediments, the lowest concentrations were consistentlyfound in the <strong>Stellwagen</strong> <strong>Bank</strong> sites (Figure 27). Contaminantdata from the 2004 sampling effort are consistent withhistorical data. The NS&T NBS long-term sediment monitoringdata (1984–1991) showed similar spatial distributionpatterns. The larger pattern indicates a gradient of contaminantconcentration from inshore to offshore. This suggestsan export of contaminants from Boston Harbor eastwardtoward <strong>Stellwagen</strong> <strong>Bank</strong> and southward toward Cape CodBay via suspended sediments and/or the water column.The NBS data show similar patterns of spatial distributionsbased on contaminant concentrations in winter flounderliver. Overall, tissue contaminant concentrations werehigher in organisms collected in and around Boston Harborthan those from remote sites, with intermediate concentrationsin the mid-Bay area between the Harbor and <strong>Stellwagen</strong><strong>Bank</strong>. These observations also suggest that export fromBoston Harbor is a source of contamination for MassachusettsBay and possibly for the sanctuary.The Hartwell et al. (2006) study evaluates and summarizescontaminant conditions in the sanctuary area over a periodof about twenty years. The current (2004) status of chemicalcontaminants in the shallow portions of <strong>Stellwagen</strong> <strong>Bank</strong> issignificantly lower than those of the other regions of MassachusettsBay including Cape Cod Bay. Boston Harbor is themost polluted zone of the Massachusetts Bay/Cape Cod Baysystem. Sediments in the deep areas in <strong>Stellwagen</strong> basin areaccumulating contaminants from a variety of sources.The temporal assessment revealed no statistically significanttrends for trace metals and Polycyclic Aromatic Hydrocarbons(PAHs), while banned but persistent organic contaminants(DDTs and chlordanes [both pesticides]) show veryslow decreasing trends over the monitoring years. Thepersistence of some organic compounds at relative highconcentrations in Boston Harbor implies that the Harbormay be a continuing source of contaminants to other areasof Massachusetts Bay including the sanctuary. However,60<strong>Stellwagen</strong> <strong>Bank</strong> <strong>National</strong> <strong>Marine</strong> <strong>Sanctuary</strong> Draft Management Plan/Environmental Assessment
Fi g u r e 25. Be n t h i c c o m m u n i t y pa r a m e t e r s at s t a t i o n s(FF05, FF04) in o r (FF14, FF11) n e a r St e l lwa g e n Ba n ks a n c t u a r y (1992-2005) r e l at i v e t o t h e o u t f a l l s t a r t u p.Source: MWRA, 2006.Fi g u r e 26. Lo c a t i o n o f t h e <strong>NOAA</strong> NS&T BE s a m p l i n gs i t e s (2004) within Massachusetts Bay i n c l u d i n g t h eSt e l lwa g e n Ba n k s a n c t u a r y.Sampling was done within six zones indicated by the red lines:Boston Harbor, Massachusetts Bay, Area Between Bays, CapeCod Bay, <strong>Stellwagen</strong> Basin and <strong>Stellwagen</strong> <strong>Bank</strong>. Source: Hartwellet al., 2006.Invasive species are recognized as a serious emerging threatto biological diversity (Drake and Mooney, 1989). Impactsof invasive species threaten 36% of marine species, yet only8% of the conservation studies published on marine systemshave dealt with this topic (Lawler et al., 2006). Communityecology theory can be used to understand biologicalinvasions by applying new concepts to alien species andthe communities that they invade (Shea and Chesson, 2002)(see Sidebar).data in the current study indicates that pollution impactsin the sanctuary appear minimal and are largely consistentwith the finding from MWRA monitoring.In va s i v e SpeciesInvasive species, also commonly referred to as non-indigenous,alien, exotic, introduced, nuisance or bio-invaderspecies, are organisms that have moved into an area outsideof their natural geographic range. Their environmentaleffect can be similar to that of the relatively rare species in abiological community that, when triggered by environmentalsignals, suddenly expands in population and geographicdistribution with negative consequences (e.g., HABs).Specific OccurrencesFirst observed in 2003, the sea squirt (tunicate) Didemnumsp. has invaded gravel habitats on Georges <strong>Bank</strong> fishinggrounds and the infestation is persistent and increasing indensity (USGS, 2006). Within the 88 sq mi study area, thecolonies doubled at 75 percent of the sites observed in 2005and 2006. Preliminary evaluation of the sample data indicatesthat 50-75 % of the gravel is covered at some studysites. Sea-squirt mats smother the gravel habitat and renderit unusable by the native community; no other species areknown to prey on or over-grow the mats. The tunicate canbe spread by mobile bottom fishing gears that break-up thecolonies and aid in their dispersion. For more informationvisit URL http://woodshole.er.usgs.gov/project-pages/stellwagen/didemnum/.This species was noted as occurring inthe <strong>Stellwagen</strong> <strong>Bank</strong> sanctuary as early as 2003.Biological agents such as phytoplankton spores or cystswhich develop HABs can behave similarly to invasivespecies. Nutrient enrichment is one factor in the developmentof HABs, but so too are the niche opportunitiescreated by the disturbance of their associated biologicalIV. Resource States 61
Fi g u r e 27. Co n c e n t r a t i o n o f c o n t a m i n a n t s, s e l e c t m e ta l s (Cd [c a d m i u m ] a n d Pb [l e a d]) a n d o r g a n i c c o m p o u n d s(t o t a l PCBs [Po ly c h l o r i n at e d Bi p h e n y l s] a n d DDT [p e s t i c i d e]), in s e d i m e n t s within Massachusetts Bay i n c l u d i n g t h eSt e l lwa g e n Ba n k s a n c t u a r y.Source: Hartwell et al., 2006.communities. These communities occupy water columnand seafloor habitats and support the HAB organism in itsvarious life stages. Planktonic and benthic predators as wellas competitors for seafloor habitat settlement space serve asnatural controls that limit population. The only HAB eventrecorded in the sanctuary occurred in 2005 and was due tothe toxic phytoplankton Alexandrium sp. As noted above,the highest concentration of Alexandrium cysts in MassachusettsBay and Cape Cod Bay was recorded in the sedimentof the sanctuary.Means of IntroductionWhile niche opportunities for invasive species may becreated by human activities that disturb biological communitiesand their habitats, the primary means by which manyof these invasive species are introduced in the marine environmentis via ballast water from ships. Scientists estimatethat as many as 3,000 alien species per day are transportedby ships around the world; however, not all transportedspecies survive the trip or exposure to their new environment(MITSG, 2004). Other methods of introduction include:• Organisms attaching to the hulls of vessels• Algae used as packing material for fisheries products• Fouling or accumulation of organisms in fishing nets thatare then re-deployed in other areas• Mariculture of introduced marine species (e.g., fish, shellfishand seaweed)• Natural processes such as ocean currentsThe introduction of invasive species is considered to be oneof the most harmful types of disturbances that can occurwithin any ecological system (Deitz, undated). Once established,these species have the potential to change the structure,pattern and function of a biological community. Someof the ecological impacts associated with the introductionof invasive species in the marine environment include:• Occupying habitat space and competing for food of nativespecies• Altering the gene pools of native organisms through crossbreeding• Shifting predator/ prey relationships• Spreading disease and/or parasitesThese impacts can take time to present themselves. Oftentimesinvasive species, although present, remain in lowabundance until some aspect of their environment changesallowing their competitive release against native species.These changes could be the result of a change in temperaturethat allows for an increase in growth rate or reproduction,or a change in the abundance of a native competitor or62<strong>Stellwagen</strong> <strong>Bank</strong> <strong>National</strong> <strong>Marine</strong> <strong>Sanctuary</strong> Draft Management Plan/Environmental Assessment
Community Ecology Theory Relating to BiologicalInvasionsTwo concepts are relevant to understanding the introduction ofinvasive species in the GoM and the <strong>Stellwagen</strong> <strong>Bank</strong> sanctuary:community maturity and niche opportunity.Community Maturity. Community maturity is defined as theopportunity an ecosystem has had to accumulate species, and foradaptation within the ecosystem to have taken place. It depends onthe time that the ecosystem has had the current climate, includingits short-term fluctuations and recurring disturbance events.Maturity depends also on the size of the species pool that hashistorically served as a source of species to the ecosystem.Biological communities that have had less evolutionary time toassemble, and less time for their constituent species to adapt tothe local conditions, are likely to have fewer species with broaderniches. Species in these communities might also have lowercompetitive abilities than those in communities (such as coralreefs) that have had a longer time to evolve under their presentenvironmental regime.The former communities, which characterize those in the GoM,tend to be less invasion resistant. The North Atlantic is relativelyyoung, the assembly of its biota from the North Pacific is recent,i.e., 3.5 Mya (Vermeij, 1991), its nearshore environments have beenfrequently glaciated causing localized extinctions at approximately20,000 year cycles (Adey and Steneck, 2001) and its species poolis comparatively low throughout the region. On the basis ofcommunity maturity, both the GoM and the sanctuary as a subsetwould seem inherently susceptible to biological invasion.Niche Opportunity. Niche opportunity is a concept which definesconditions that promote invasions in terms of <strong>resource</strong>s, naturalenemies, the physical environment, interactions between thesefactors, and the manner in which they vary in time and space.Niche opportunities vary naturally between biological communitiesbut can be greatly increased by disruption of communities,i.e., disturbance. Recent niche theory predicts that low nicheopportunities (high invasion resistance) result from high speciesdiversity (Stachowicz et al., 1999; Shea and Chesson, 2006).The sanctuary would also seem prone to biological invasion becauseof the niche opportunities afforded (together with the sanctuary’slocation amid extensive commercial shipping traffic that can serveas primary vectors for the introduction of exotics from hull bottomsand ballast water). The majority of the sanctuary area is chronicallydisturbed by fishing, especially seafloor habitats regularly sweptby bottom otter trawling. The results of the SHRMP research(described in the section on seafloor habitats) indicate the greaterrelative ecological importance of physical disturbance by fishingversus natural events such as storms.The extensive exploitation of fish populations in the sanctuary hascaused significant declines in species abundance and in a range ofdiversity metrics that take both species richness and abundance intoaccount (Auster, 2000), although recovery to earlier higher levelsof fish species diversity has recently been documented (Auster etal., 2006). Such extensive chronic disturbance and the history oflowered species diversity are factors that create niche opportunitiesfor biological invasion.predator that enables the invasive to becomebetter established (Deitz, undated).General StatusA growing number of non-native marine organismsare appearing in the waters of the GoM(Table 4). Of these only the tunicate Didemnumlahillei is documented from the <strong>Stellwagen</strong><strong>Bank</strong> sanctuary. Researchers attribute thisincrease in number of invasive species to tworegional trends: 1) warming coastal watersbecoming more hospitable to non-nativespecies; and 2) lower biodiversity resultingfrom the urbanization of shore lands and theincrease in human activity and pollution stressingcritical marine habitats (Deitz, undated).According to the Massachusetts Institute ofTechnology Sea Grant (MITSG) Rapid AssessmentSurvey (RAS) conducted in August of 2000and 2003, a total of 34 introduced organisms,several of which were identified for the firsttime in this region, and 37 organisms whosenative geographic distribution is unknownwere discovered throughout New Englandcoastal waters (MITSG, 2003). For more informationvisit URL http://www.usm.maine.edu/gulfofmaine-census/Docs/About/Organisms/Invasive.htm.Pr e s s u r e sAlthough studies show that water quality inand around the <strong>Stellwagen</strong> <strong>Bank</strong> sanctuary iscurrently at acceptable levels by most standards,the continuing pressures of point- andnon-point sources of pollution are cause forcontinued concern and constant vigilance.Given the sanctuary’s proximity to the populouscoastal zone in Massachusetts, New Hampshireand southern Maine, as well as being“downwind” from the industrial activity of themid-west and northeastern part of the U.S., thesanctuary is exposed to pollutants from a varietyof anthropogenic sources. These sourcesinclude direct discharge of waste to coastalwaters (generally referred to as point sources)and indirect contamination (generally referredto as non-point sources).Point source discharges potentially impactingthe sanctuary include discharges from publiclyowned treatment works (POTWs), industrialdischarges permitted under the <strong>National</strong>Pollutant Discharge Elimination System, effluentsfrom combined sewer overflows (CSOs)and disposal of dredge materials at the MBDS.Nonpoint sources of contamination enteringthe sanctuary, such as pesticides, manufacturingchemicals, fertilizer and automobile runoffare primarily derived from the rivers of theIV. Resource States 63
Ta b l e 4. In v e n t o r y o f k n o w n invasive s p e c i e s t o t h e Gu l f o f Ma i n er e g i o n .Of these only the ascidian (tunicate) Didemnum lahillei is documented fromthe <strong>Stellwagen</strong> <strong>Bank</strong> sanctuary. Common name is included in parenthesesif known. Source: Dietz (2005).Scientific Name and Type of OrganismChlorophyta (green algae)Codium fragile (deadman’s fingers, green fleece)Rhodophyta (red algae)Bonnemaisonia hamiferaGrateloupia turuturuLomentaria clavellosaLomentaria orcadensisNeosiphonia harveyiPorifera (sponges)Halichondria bowerbankia (bread-crumb sponge)Cnidaria (hydroids, anemones, jellyfishes)Cordylophora caspia (colonial hydroid)Diadumene lineate (striped anemone)Sagartia elegans (purple anemone)Polychaeta (segmented worms)Janua pagenstecheri (formerly Spirorbis pagenstecheri) (bristleworm)Gastropoda (snails)Littorina littorea (common periwinkle)Bivalvia (clams, oysters, mussels)Ostrea edulis (European oyster)Arthropoda (crabs, shrimps)Praunus flexuosus (mysid shrimp)Ianiropsis sp. (isopod)Caprella mutica (skeleton shrimp)Microdeutopus gryllotalpa (amphipod)Carcinus maenas (European green crab)Hemigrapsus sanguineus (Asian shore crab)Anisolabis maritime (maritime earwig)Bryozoa (moss animals)Barentsia benedeniBugula neritinaMembranipora membranacea (lacy crust bryozoan)Ascidiacea (tunicates, sea squirts)Ascidiella aspersaBotrylloides violaceusBotryllus schlosseri (golden star tunicate)Didemnum lahilleiDiplosoma listerianumMolgula manhattensis (sea grapes)Styela canopus (formerly Styela partita)Styela clava (club tunicate)Protozoa (single-celled organisms)Haplosporidium nelsoni (Eastern oyster parasite)Perkinsus marinus (Eastern oyster parasite)Bonamia ostreae (European oyster parasite)GoM, especially the Merrimack River, dischargesfrom vessel traffic and atmospheric inputs.While it appears that inputs from point sourcedischarges have been decreasing over the pastdecade, it has been difficult to adequately estimatethe magnitude of the non-point source inputs. Amajor component missing in the present MWRAand the <strong>Stellwagen</strong> <strong>Bank</strong> sanctuary water monitoringprojects is “event-driven” sampling gearedto wastewater system failures and storm-wateroverflows. While 98% of the effluent in 2002underwent secondary treatment, for example,there was still part of the waste-stream that wasreleased untreated or only partially treated due tostorm events and temporary inability of the facilityto handle the overflow.The most significant types of point and non-pointsource discharge and disposal activities occurringin the sanctuary vicinity are discussed in greaterdetail below.SOURCESMunicipal Waste DischargesMassachusetts Bay and Cape Cod Bay historicallyhave received inputs of waste in the form of effluentor sludge from a number of pipes extendingfrom municipal wastewater treatment plants alongthe coast of Massachusetts (Figure 28). In thepast, the total combined flow of this material wasreported to be 566 million gallons per day (MGD),with approximately 500 MGD of that total beingdischarged by the MWRA treatment works at Deerand Nut Islands, the plants that served the greaterBoston Area.These discharges into Boston Harbor combinedwith CSOs were considered to be the greatestpoint sources of contaminants (metals, PAHs,PCBs, nutrients) to the Massachusetts Bay area(Menzie-Cura, 1991). However, over the yearsimproved treatment and pre-treatment methodsand technologies have helped to dramatically lessenthe quantity of pollutants discharged into theMassachusetts Bay/Cape Cod Bay system (MWRA,2002).In a major effort to improve the quality of wastewater entering into Massachusetts Bay, the MWRAconstructed a new wastewater treatment facilityon Deer Island. The facility, completed in 2000,provides a more effective, secondary treatment ofthe wastewater and eliminates the discharge ofsludge into coastal waters. This new plant alsomoved the discharge point, known as the oceanoutfall, from the entrance of Boston Harbor to thewaters between 12.7 km and 15.1 km (7.9 mi.and 9.4 mi.) east-northeast of Deer Island insideMassachusetts Bay.64<strong>Stellwagen</strong> <strong>Bank</strong> <strong>National</strong> <strong>Marine</strong> <strong>Sanctuary</strong> Draft Management Plan/Environmental Assessment
Fi g u r e 28. Lo c a t i o n o f s e w e r o u t fa l l s, t h e MWRA o u t f a l l , i n d u s t r i a ld i s c h a r g e s i t e s a n d d u m p i n g/disposal s i t e s within Massachusetts Bay.Also indicated are the locations of state ocean sanctuaries, the Cape Cod Bay Right WhaleCritical Habitat Area and the <strong>Stellwagen</strong> <strong>Bank</strong> sanctuary as well as the pattern of generalocean circulation for the area. Source: MWRA (2004).to the MOSA, existing wastewatertreatment plants may increasetheir discharge volumes if a case of“public necessity and convenience”can be made (Massachusetts Departmentof Conservation and Recreation,M.G.L. c. 132A, 12A-16F, 18,and 302 CMR 5.00).The MWRA is the discharge site of most significance to thesanctuary, with the new location being sited approximately23.12 km (12.5 nm) from the sanctuary western boundary.The facility discharges 350 million gallons of secondarytreated sewage per day. While the new MWRA outfalltunnel remains a leading source of contaminants in MassachusettsBay, the repeated environmental monitoring andassessments conducted by the MWRA and <strong>NOAA</strong> discussedabove conclude that scientifically determined baselines forkey indicator variables are not being exceeded in the sanctuaryand adjacent areas.Currently, under the Massachusetts Ocean SanctuariesAct (MOSA) any new discharge of wastewater into areasdesignated as ocean sanctuaries by POTWs and CSOs isprohibited along the coast of Massachusetts except for thearea between Marshfield and Lynn. However, accordingMassachusetts Bay Disposal SiteBetween the 1940s and the 1970s,numerous offshore areas throughoutMassachusetts Bay were used forthe disposal of a variety of industrialwaste products including canisters,construction debris, derelictvessels and radioactive waste. Theseactivities were largely unregulatedand unrecorded. Today, this typeof disposal activity is not allowedwithin Massachusetts Bay. Currentlythere are only two dredge disposalsites active within MassachusettsBay and Cape Cod Bay: the MBDSdesignated in 1993, and the CapeCod Bay Disposal site designated in1990. Each of these active sites ismonitored by the U.S. Army Corps ifEngineers under their Disposal AreaMonitoring System (DAMOS).The MBDS is the disposal site ofmost significance to the <strong>Stellwagen</strong><strong>Bank</strong> sanctuary. The MBDS islocated directly adjacent to the westernboundary of the sanctuary andencompasses an area two nauticalmiles in diameter, centered at 42°25.1’N X 70° 35.0’W (Figure 28).This site incorporates the areas of twohistoric disposal sites, the IndustrialWaste Site (IWS), an area that wasonce authorized for the disposal of toxic, hazardous andradioactive materials and the Interim MBDS (also known asthe Foul Area Disposal Site [FADS]) designated only for thedisposal of dredged materials. Given the proximity of thedumpsite to the sanctuary, there is lingering concern thatthese dumped materials have impacted sanctuary habitatsand that previously-dumped toxic materials might be leaking.Currently, the MBDS is the most active disposal sitein DAMOS, receiving dredge materials from many ports,including Scituate, Hingham, Boston, Salem and Gloucester.Since 1982, approximately 8.4 million cubic yards ofdredged material have been disposed at the current MBDSor the original MBDS location, established in 1977 andlocated one nautical mile eastward and one-half nauticalmile northward of the current MBDS location (USACE,2004). Annual disposal volumes for the period 1982-2003IV. Resource States 65
are indicated in Figure 29. While sediments derived fromdumping, as well as contaminants from the IWS (e.g., toxicchemicals, low level radioactive waste), have the potentialto contaminate the sanctuary (Wiley et al. 1992), both theEPA and <strong>NOAA</strong> concluded in 1993 that MBDS would notthreaten <strong>resource</strong>s within the sanctuary. Recent assessments(Hartwell et al., 2006) support that early assessment.In areas approved for ocean disposal of dredged material,such as the MBDS, those that utilize the site must conformto the EPA’s ocean dumping criteria regulations. The sitecan only be used for disposal following an individualdisposal determination that concludes that ocean disposal isan “environmentally appropriate alternative” as comparedwith other disposal alternatives. If there are no economicallyfeasible alternatives to a particular dumping proposal,EPA is directed to grant a project-specific waiver unless“certain unacceptable environmental harms would result.”Currently disposal of contaminated materials, as definedby state regulations, is not permitted at the MBDS (USACE,2003).Vessel DischargesThe location of many ports and harbors in MassachusettsBay and Cape Cod Bay, particularly the Port of Boston,means that large numbers of vessels regularly travel throughthe sanctuary. On average, over the period 2000-2005,there were 2,257 transits per year to/from the Port of Bostonby large deep drafts ships, the majority of which crossed thesanctuary. There are approximately 100 cruise ship departuresor ports of call from Boston annually and this numberis expected to increase; Boston is now considered one ofthe fastest growing high-end cruise markets in the country.See the Maritime Transportation section of this documentfor details.Approximately 800 commercial fishing vessels use MassachusettsBay as a fishing area or as a transit zone to openocean fishing areas. On average, 327 commercial fishingvessels and 105 party and charter boats fished the sanctuaryon an annual basis during 1996–2005. The popularityof recreational fishing and whale watching in the sanctuaryaccounts for many of the boats frequenting the area, especiallyduring the months of April through October. On average,party and charter fishing boats made 1,967 trips peryear to the sanctuary during 1996–2005. (See the Commercialand Recreational Fishing sections of this document fordetails.)Discharges from vessels have the potential to be a significantsource of pollution to the sanctuary. Appendix A providesinformation on the types of vessel discharges, their productionand current status of regulation. Cruise ships serve asthe example for type and production, but the regulationsapply generally or as specified. Time taken for representativetypes of discarded objects to dissolve in seawater isprovided in Table 5.Hazardous Material SpillsAccidental discharges and vessel casualties do occur withinthe sanctuary. According to the USCG, a total of four fishingvessels sank within the boundaries of the sanctuary overthe last three years (2003–2005). These vessel casualtiesresulted in only minor discharges of oil into the marineenvironment and had no significant impact on the sanctuary.Other than these incidents, there have been no spills oraccidental discharges in or around the sanctuary area overthe last decade that would have placed sanctuary <strong>resource</strong>sat risk (S. Lehmann, <strong>NOAA</strong>/NOS, personal communication,2005).Tr a n s p o r t Pa t h w a y sContaminant levels are a concern due to: (1) the dischargefrom the MWRA outfall, (2) the historic and current dischargeof municipal sewage from the Boston metropolitan areaFi g u r e 29. An n u a l disposal v o l u m e s at t h e Massachusetts Bay Disposal Si t e f o r t h e p e r i o d 1982–2003.Source: USACE (2004).66<strong>Stellwagen</strong> <strong>Bank</strong> <strong>National</strong> <strong>Marine</strong> <strong>Sanctuary</strong> Draft Management Plan/Environmental Assessment
Ta b l e 5. Ti m e t a k e n f o r o b j e c t s t o dissolve at s e a.(Source:IMO http://www.imo.org/Environment/mainframe.asp?topic_id=297 )Paper bus ticket2–4 weeksCotton cloth1–5 monthsRope3–14 monthsWoolen cloth1 yearPainted wood13 yearsTin can100 yearsAluminum can200–500 yearsPlastic bottle450 yearsand other cities and towns along Massachusetts Bay, (3) thehistoric dumping of toxic material at the Massachusetts BayDisposal Site, and (4) the air deposition of toxic materialstransported from the west. Knowledge of transport pathwaysand residence times of contaminants in the MassachusettsBay/Cape Cod system helps in the evaluation of thethreats they pose to sanctuary <strong>resource</strong>s.Boston Harbor, <strong>Stellwagen</strong> Basin and Cape Cod Bay arelong-term sinks for fine-grained sediments and associatedcontaminants from all sources in the region. Bottom depositson the inner shelf of the western shore of MassachusettsBay are gravel, coarse sands and bedrock. Fine sedimentsdo not accumulate here because storm currents resuspendand displace them. During much of the year, a weak counterclockwisecirculation persists in Massachusetts and CapeCod Bays, driven by the southeastward coastal current fromthe GoM. Currents flow southwesterly into the MassachusettsBay south of Cape Ann, southward along the westernshore, and easterly out of the Bay north of Race Point at thetip of Cape Cod. This flow pattern may reverse in the fall,especially near the western shore. The flow-through flushingtime for the surface waters in most of Massachusetts Bayranges from 20 to 45 days (USGS, 1998).Northeasters (storms) generate large waves that enter MassachusettsBay from the east. The currents associated withthese waves resuspend the bottom sediments in exposedareas along the western shore of Massachusetts Bay. Thewind-driven currents flow southeastward parallel to thecoast (with an offshore component near the bottom) andcarry the suspended sediments toward Cape Cod Bay andoffshore into <strong>Stellwagen</strong> Basin. Sediments settle to the seafloor along these transport pathways. Currents caused bysurface waves are the principal cause of sediment resuspension.Cape Cod Bay is sheltered from large waves bythe arm of Cape Cod, and waves are rarely large enoughto resuspend sediments at the seabed in the deep areas of<strong>Stellwagen</strong> Basin. Thus once sediments reach <strong>Stellwagen</strong>Basin or Cape Cod Bay, carried either by the mean currentflow or transported by storm waves, it is unlikely that theywill be re-suspended and transported away again.As indicated previously, sampling for this assessment wascoordinated by NS&T in collaboration with the <strong>NOAA</strong>Northeast Fisheries Science Center. Data from 2004 werecontrasted with historical data, and data from the MWRA toassess the spatial and temporal trends in chemical contaminationin the region as a whole. Both the <strong>NOAA</strong> and MWRAsampling regimes included sampling sites within the followingfour zones: Boston Harbor, Massachusetts Bay, AreaBetween Bays and <strong>Stellwagen</strong> <strong>Bank</strong> (Figure 26). The lowestcontaminant concentrations were consistently found in the<strong>Stellwagen</strong> <strong>Bank</strong> sites (Bothner et al., 1993, 1994; Bothnerand Butman 2005; <strong>NOAA</strong>, 2006).Cu r r e n t Pr o t e c t i o n<strong>Sanctuary</strong> regulations (15 C.F.R § Subpart N) specificallyprohibit:1. Discharging or depositing, from within the boundary ofthe sanctuary, any material or other matter except:• fish, fish wastes, chumming materials or bait used in orresulting from traditional fishing operations in the sanctuary;• biodegradable effluent incidental to vessel use and generatedby marine sanitation devices approved in accordancewith the Federal Water Pollution Control Act [Clean WaterAct (CWA)];• water generated by routine vessel operations (e.g., coolingwater, deck wash down and gray water as defined bythe Federal Water Pollution Control Act), excluding oilywastes from bilge pumping; or• engine exhaust.2. Discharging or depositing, from beyond the boundary ofthe sanctuary, any material or other matter except those listedabove, that subsequently enters the sanctuary and injuresa sanctuary <strong>resource</strong> or quality;3. Lightering in the sanctuary (transferring cargo, usually oil,between vessels).Oil spills or spills of hazardous substances in U.S. waterscome under regulations that are known as Natural ResourceDamage Assessments (NRDA). It is possible to apply NRDAregulations to any vessel discharge that contains oil andpetroleum, and/or toxic substances if the discharge causesinjury and damage to marine <strong>resource</strong>s and living organisms.It is also possible to apply the CWA to discharges ofpetroleum and hazardous substances as well as excessivenutrients, and sewage containing pathogens and bacteriathat could impair water quality. Lastly, the disposal of plastictrash, and other overboard trash by vessels is regulatedby the <strong>Marine</strong> Plastic Pollution Research and Control Act of1987 in the U.S. as well as MARPOL 73/78 Annex V.Vessel discharges and potential contaminants that couldbe problematic are: black water (vessel sewage), greywater (soils, cleaning solvents, metals, pesticides, medicalwaste), bilge water (fuel, oils, cleaning agents, paint, rags),ballast water (foreign marine organisms), hazardous materials(chemicals from cleaning and photo processing, paints,solvents, inks) and solid waste disposal.IV. Resource States 67
There are no direct federal regulations for control of nutrientssuch as nitrogen and phosphorous (NRC, 2000), forbiologically active agents (hormones, endocrine disrupters),or for pathogens, including viruses, parasites and bacteria(NRC, 1994). Concern over biologically active agents isincreasing because of their potential to alter the health oforganisms, the growing industrial proliferation and publicuse, and the high density of biotechnology companies in theBoston metropolitan area that may inadvertently dischargethese agents.Be n t h i c In v e rt e b r at e sSt a t u sThe sanctuary’s benthic invertebrates include species fromnearly all GoM invertebrate phyla. These animals live in(infauna) or on (epifauna) the seafloor during most of theirlives, although most species have pelagic larvae. Characterizedas “sessile” (sedentary or attached) or “motile”(free moving), benthic invertebrates range in size from littleknown microscopic forms (hydroid medusae) to the morecommon larger macroscopic organisms (e.g., scallops).Invertebrate communities vary with substrate; while cerianthidanemones may be the most visible in deep-mud basins,sand dollars might dominate shallow sand areas.The <strong>Stellwagen</strong> <strong>Bank</strong> sanctuary supports a wide varietyof seafloor substrates including mud, sand, gravel, piledboulder reefs and bedrock habitats. The seafloor providesa base for attachment by a variety of sessile invertebratesincluding bryozoans (moss animals), ascidians or tunicates(sea squirts), sponges, anemones, barnacles and hard-tubeworms that form dense encrustations. Larger sessile invertebrates,such as sea whips (gorgonians) and sponges, providerefuges for many smaller cryptic (camouflaged) invertebrates.Other dominant benthic invertebrates include brittlestars, starfish, bivalves, shrimps, crabs and lobsters.Structure-forming epifaunal invertebrates (such as spongesand anemones) provide critical habitat for juvenile fish ofmany species (such as Atlantic cod and Acadian redfish),while the greater invertebrate community provides animportant source of food for these and many other fishspecies in the sanctuary. In the GoM, invertebrates, includingsponges, jellyfish, worms, mollusks, echinoderms suchas starfish, sea urchins and sand dollars, and crustaceans,outnumber vertebrates such as fishes, birds, and mammals,almost two-to-one (1,669 known invertebrate species versus914 vertebrates).GoM a n d Northeast Re g i o nThe diversity of invertebrate animals in the GoM is onlygenerally described in the scientific literature; their manytypes are sorely under-represented in species counts. Manyof the following citations are the principal works representativeof the major taxonomic groups in the Northeastregion. Although this section is intended to be primarilyabout the macrobenthic invertebrates of the sanctuary (andprincipally those that are structure-forming), the followingannotated overview strives to recognize the greater crosssectionof invertebrate diversity. Scientific nomenclaturenot explained in the text is described in the glossary of thisdocument.The aggregate macrobenthic invertebrate fauna of the continentalshelf ecosystems of the Northeastern United Statesconsists of 44 major taxonomic groups (phyla, classes,orders) (Theroux and Wigley, 1998). A striking fact is thatonly five of those groups (belonging to four phyla) accountfor over 80% of both total biomass and number of individualsof the macrobenthos. The five dominant groups are Bivalvia,Annelida, Amphipoda, Echinoidea and Holothuridea.The macrobenthos of the New England region (a subset ofthe northeastern continental shelf area) is dominated bymembers of only four phyla: Annelida (e.g., segmentedworms), Mollusca (e.g., shellfish and squid), Arthropoda(e.g., crabs and shrimp) and Echinodermata (e.g., starfishand sea cucumbers).Hartman (1964) describes the region’s Porifera (sponges);Larson (1976) discusses Cnidarian taxonomy of the northeasternUnited States. Caims (1991) provides a checklistof the cnidaria and ctenophores from North America.The region’s species of Hydrozoa (hydroids, jelly fishes)are described in Fraser (1944). Bush (1981) discusses theTurbellaria (flat worms) in the Northwestern Atlantic. Smith(1964) covers the taxonomy of nemerteans (flat worms)and nematodes (round worms) in the region. Bryozoans(moss animals) are critical sources of benthic structure andtheir taxonomy in the northeastern United States has beenrecently revised (Ryland and Hayward, 1991). Althoughthe literature may suggest that the Bryozoa are well studiedoverall, remarkably little is known about the distribution ofspecies within the GoM.Molluscs are ever-present. Cephalopods such as squid arenektonic predators with a complex life history (Mauerer andBowman, 1985). Gastropods (snails) and Bivalves (clams,mussels) are part of the epifaunal and infaunal benthiccommunity (Maney and Ebersole, 1990). Nudibranchs (seaslugs) have been well described and many have a uniquelife history (Bleakney, 1996). Hunter and Brown (1964)describe the taxonomy of local molluscs. Work by Cookand Brinkurst (1973) covers the taxonomy of the Annelida(segmented worms) of the northeastern United States.68<strong>Stellwagen</strong> <strong>Bank</strong> <strong>National</strong> <strong>Marine</strong> <strong>Sanctuary</strong> Draft Management Plan/Environmental Assessment
Coffin (1979) and Ho (1977, 1978) wrote the classic descriptionsof the Copepoda in the region; a more recent analysiswas done by Dudley and Illg (1991a, b). Tremblay andAnderson (1984) provide an annotated list of local species.Durbin et al. (1995a,b) discuss the relationship betweenenvironmental variables and the copepod community(notably Calanus finmarchicus). Kahn and Wishner (1995)describe the spatial and temporal patterns of this and othercopepod species on baleen whale feeding grounds. Lynchet al. (1998) present a model of the population growth ofCalanus finmarchicus; Meise-Munns et al. (1990) discusslonger-term population trends and the inter-annual variabilityin availability. Copepods may play an importantlink in the ecology of toxic dinoflagellates (Teegarden andCembella, 1996); the species diversity of the two groupsmay be closely related.Bowman and Abele (1982) review the Crustacea and theirspecies diversity as a whole. Productivity and growth of theDecapoda (crustaceans e.g., lobster, crabs) is extensivelyresearched because of that taxonomic group’s commercialimportance. Steneck et al. (1991), Wahle (1995) and Rangeleyand Lawton (1999) discuss the geographical distributionof the American lobster. Fell (1982) covers the generaltaxonomy of the Echinodermata; Pawson (1997) covers theholothurians. Ecinoderms are greatly affected by physicaldisturbance to the benthos of the GoM, according to Collieet al. (1997) and Thrush et al. (1998). Smith (1964) coversthe ascidian (tunicate) taxonomy.A first-order assessment (presence/absence) of the kinds andspecies of invertebrates in the sanctuary was conductedbased on the analysis of a 19-year database (1953-1972)collected during <strong>NOAA</strong> Fisheries Service research cruisesbeginning over 50 years ago as described in Theroux andWigley (1998). The analysis was done in 2003 by JohnCrawford of the University of Pennsylvania who served asvisiting scientist with the <strong>Stellwagen</strong> <strong>Bank</strong> sanctuary duringthat year. The analysis included over 4,000 data records forthe sanctuary obtained using standardized sampling methodsinvolving four gear types: (1) Campbell grab, (2) 1.0meter dredge, (3) scallop dredge, and (4) otter trawl. Theanalysis produced a taxonomic list documenting invertebratespecies in the sanctuary, which has been incorporatedinto the sanctuary’s species list (Appendix J).Im p o rta n c e o f St r u c t u r e-Fo r m i ng InvertebratesA great diversity of structure-forming invertebrate specieslives on or in the seafloor of the <strong>Stellwagen</strong> <strong>Bank</strong> sanctuary.Many of these invertebrates create and are the source ofimportant biogenic habitats (e.g., anenome forests, spongegardens, hydroid meadows, worm tube beds, burrows andother substrate modifications) which promote and sustainbiodiversity and make a pivotal contribution to ecosystemfunction. Structure-forming macrobenthic invertebrates,such as sponges, bryozoans, tunicates and anemones, playa particularly important role in the ecology of small, juvenilefishes, offering shelter from currents and serving as nurseriesand refugia from predation, for example.As explained in the section on seafloor habitats, biogenicstructures underpin and shape the biological communitiesassociated with them; they form the “living landscapes”that carpet the sanctuary seafloor. Their three-dimensionalstructure and sessile behavior make these particular invertebrateshighly susceptible to damage from mobile fishinggear, e.g., trawls and dredges. Below are some examplesof the invertebrate species that form the living landscapesof the sanctuary. The accompanying discussion does notinclude the hundred or so other species of benthic invertebrates,such as echinoderms (e.g., starfish, brittle stars,sand dollars, sea cucumbers) and crustaceans (e.g., lobsters,crabs, shrimp, isopods) that serve different ecological roles(e.g., predators, scavengers) within the benthic communitiesof the sanctuary. Many of these structure-forming andother benthic invertebrate species are colorfully pictured inMartinez (2003).SpongesSponges are common throughout the <strong>Stellwagen</strong> <strong>Bank</strong> sanctuaryand serve as important habitat and refugia for a varietyof organisms (Figure 30). The boring sponge Cliona celatais known within the sanctuary (Ward, 1995) and grows onmollusk shells at depth to 40 m (Gosner, 1971). They attachto both living and abandoned shells, contributing to thebreakdown of shells on the sea floor. Cliona may grow toa diameter of 20 cm and can be free-standing (Ruppert andFox, 1988). Gosner reports that the gamma form may bea massive free-standing structure (Gosner, 1971). Iophonnigricans is an erect sponge that has been collected in thesanctuary (McNaught, in preparation) and lives at depths of29–740 m (Gosner, 1971).CnidariansCnidarians are a large and varied phylum including jellies,hydroids, corals and anemones. These soft-bodied invertebratesserve as refugia for other organisms and are highlyvulnerable to damage from fishing gear. Many cnidarianssuch as the hydroids have a polyp (attached) and medusa(free floating) stage (Figure 31). Each “flower” of the pinkheartedhydroids (Tubularia corcea) is an animal or polypapproximately 3 cm long with the blossom about 1 cmacross. These hydroids are found in the sanctuary (Ward,1995) and serve as habitat for other organisms. Anotherspecies, the stalked hydroid (Corymorpha pendula) is knownto extensively carpet the seafloor in some areas of the sanctuary.The branching soft coral (Gersemia rubiformis) isknown to occur within the sanctuary and grows to 15 cm ormore in height (Ward, 1995), occurring at depths of 37–91m (Gosner, 1971). Gorgonians may take 30 years to reachfull size (Ruppert and Barnes, 1994).Sea pens and pansies (Pennatulacea) are found anchored tosoft bottoms (sand or mud) and are fleshy structures whichgenerally have a stalk or pedestal anchored to the substrateand secondary polyps at the upper end of the stalk (Barnes,1974). Sea pens are common in Georges Basin, the <strong>Stellwagen</strong><strong>Bank</strong> area and Jeffreys Ledge with densities as highas 8/m-2 having been measured (Langton et al., 1990). TheyIV. Resource States 69
Fi g u r e 30. Re p r e s e n tat i v e s p e c i e s o f s p o n g e s in t h e St e l lwa g e n Ba n k s a n c t u a r y.(a) common palmate sponge (Isodictya palmata) sheltering a sculpin; (b) boring sponge (Cliona celata) on left side of image, Halichondriapanicea with knobs on right side of image; (c) Iophon nigricans; and (d) miscellaneous sponge species interspersed with hydroids(feathery organisms pictured here). Credits: (a-c) NURC-UConn; and (d) Tane Casserley, <strong>NOAA</strong> Maritime Heritage Program.are found on mud and silt bottoms, at depths of 174–351 m.They have been collected as by-catch by fishermen (Langtonet al., 1990) and are sometimes damaged by traps (Enoet al., 2001). The Pennatulacea encountered by Therouxand Wigley (1998) were feather-shaped and stood 10–25cm high.Anemones are a common, abundant class of cnidarian thatserve many important functions in the sanctuary such as:refugia, a food source, and, in turn, a predator on zooplanktonand even fish (Figure 32). They are found throughoutthe sanctuary on all bottom types, but are most commonon sandy substrata and are most abundant at depths of 100m or more (Theroux and Wigley, 1998). The colorful andabundant northern red anemone Urticina felina is found to73 m depth and is 5 cm high by 12 cm wide. The burrowinganemones, Ceriantheopsis americanus and Cerianthusborealis, may have tubes extending over 45 cm into thewater column and 4 cm in diameter. Cerianthus borealis ismost common in deep muddy basins (130 m to > 400 m)with burrowed tube lengths of 45 cm. Behavioral-ecologicalstudies have revealed a close association between Cerianthussp. and Acadian redfish within the <strong>Stellwagen</strong> <strong>Bank</strong>sanctuary (Auster et al. 2003).Annelid WormsWorms are an important food source for many bottom-dwellingfishes. They can be important detritivores (decomposers),predators or filter feeders. Some worm species buildcomplex three-dimensional structures. The serpulid worm(Filograna implexa) is an important member of the seafloorcommunity on pebble/cobble substrate in Georges <strong>Bank</strong>,where its abundance is known to be reduced by dredging(Collie et al., 1997). This species occurs in the sanctuary(McNaught, in preparation) and is found at depths from33–55 m (Gosner, 1971). It can grow to a tube length of 5cm with groups of tubes joining to form large above-surfacestructures (Ruppert and Fox, 1988). Myxicola infundibulumis a soft-bodied burrowing worm approximately 3x20 cm insize (Gosner, 1971). McNaught et al. (in prep) found themin the northern parts of the sanctuary around the submergedfiber-optic cable in the sliver (closed area). Depths rangefrom the shallow littoral zone to 55 m (Gosner, 1971).Trumpet worms (Pectinari goudi) are known in the sanctuary(Ward, 1995). Their delicate tubes are made from sandgrains and most of the tube is buried.70<strong>Stellwagen</strong> <strong>Bank</strong> <strong>National</strong> <strong>Marine</strong> <strong>Sanctuary</strong> Draft Management Plan/Environmental Assessment
Fi g u r e 31. Re p r e s e n tat i v e s p e c i e s o f c n i d a r i a n s in t h e St e l lwa g e n Ba n k s a n c t u a r y.(a) stalked hydroid (Corymorpha pendula); (b) pink-hearted hydroid (Tubularia corcea); (c) soft coral (Gersemia rubriformis);and (d) stalked jelly (Haliclystus auricula). Credits: (a) NURC-UConn; (b) Tane Casserley, <strong>NOAA</strong> Maritime Heritage Program;(c) Bob Michelson; and (d) Jeff Hannigan.BryozoansBryozoans are sessile colonial animals, commonly referredto as “moss animals.” They are most common on shell andgravel substrata and are most abundant in shallow water(less than 100 m) in Massachusetts Bay (Theroux and Wigley,1998). Colonies of spiral tufted bryozoans (Bugulia turrita)are found within the sanctuary (Ward, 1995) and are knownfrom very shallow depths to more than 27 m. Colonies ofBugula spp. tend to be small, less than 2.5 cm in height(Gosner, 1971), and are soft, bushy and plant-like in form(Ruppert and Fox, 1988; Ruppert and Barnes, 1994). Twospecies of erect bryozoans were reported from the sanctuaryin the SHRMP study, Caberea ellisii and Idmidronea atlantica.These species were more abundant within the cableclosed area (sliver), which is protected from the effects offishing that occur outside the closed area.MolluscsMolluscs such as clams, mussels and scallops are an importantcomponent of the sanctuary ecosystem serving ashabitat and a food source for many species, while filteringplankton and organic particles from the water column. TheIV. Resource States 71
Fi g u r e 32. Re p r e s e n tat i v e s p e c i e s o f a n e m o n e s in t h e St e l lwa g e n Ba n k s a n c t u a r y.(a) mud anemone (Cerianthus borealis); (b) northern red anemones (Urticina felina) shown on boulder [These animals catch, kill anddigest prey as large as fish. They sting prey with nematocysts on their tentacles and draw the stunned prey into the mouth in the centerof the tentacles.]; (c) shipwrecks can serve as substrate for frilled anemones (Metridium senile); and (d) unidentified frilled anemonespecies. Credits: (a-c) NURC-UConn; and (d) Norman Depres.shells of dead ocean quohog (Arctica islandica) are knownto provide habitat for juvenile hake (Auster et al. 1991) andother fish as well as invertebrate species (Figure 33). Foundat depths from 11–165 m, shells may be 10 cm in length(Gosner, 1971). Ocean quohogs can live to be more than100 years old and have been aged in excess of 200 years(NMFS, 2000).TunicatesThe tunicates (sea squirts) fall within the phylum Chordata,meaning they are primitive relatives of vertebrates (Figure34). Ciana intestinalis and Mogula spp. are reported from thelittoral zone to depths of about 500 m (Gosner, 1971) andare found throughout the sanctuary. Ciana intestinalis formscolonies to a height of 12 cm; Mogula spp are smaller, withthe largest species forming colonies to only 7 cm, and mostless than 3 cm (Gosner, 1971) (Ruppert and Fox, 1988).Pr e s s u r e sPressures are the same as those for seafloor habitats, principallyfishing practices that disturb seafloor communities andthe laying of cables or pipelines.Cu r r e n t Pr o t e c t i o n<strong>Sanctuary</strong> regulations (15 C.F.R § Subpart N) prohibit drillinginto, dredging or otherwise altering the seabed of the sanctuary;or constructing, placing or abandoning any structureor material or other matter on the seabed of the sanctuary,except as an incidental result of (1) anchoring vessels; (2)traditional fishing operations; or (3) installation of navigationaids. The exemption for traditional fishing activities72<strong>Stellwagen</strong> <strong>Bank</strong> <strong>National</strong> <strong>Marine</strong> <strong>Sanctuary</strong> Draft Management Plan/Environmental Assessment
Fi g u r e 33. Em p t y o c e a n q u o h o g s h e l l s (Ar c t i c ai s l a n d i c a) s e r v e a s h a b i t a t f o r a va r i e t y o f fish s u c h a st h e b l e n n y s h o w n h e r e.(Credit: NURC-UCconn).Fi g u r e 34. Re p r e s e n tat i v e s p e c i e s o f t u n i c a t e s in t h eSt e l lwa g e n Ba n k s a n c t u a r y.(a) sea grape (Molgula spp.); (b) sea peach (Halocynthia pyriformis);and (c) stalked tunicate (Boltenia ovifera). Credits: (a) JeffHannigan; (b) Bob Michelson; and (c) Kevin McCarthy.reduces the effectiveness of these regulations in protectingecological integrity including habitat and biodiversity.Several indices of biodiversity are based on numbers ofindividuals of a species as well as the number of species.These measures of diversity are sensitive to the effects oftraditional fishing. A reduction in biodiversity in the sanctuarydoes not require that species are entirely removed (i.e.,local extinction). “Local extinction” is a common scientificterm in community ecology and conservation biology. Itis defined as the eradication of any geographically discretepopulation of individuals while others of the same speciesor subspecies survive elsewhere.The most effective regulations for protecting benthic invertebratesare those promulgated by <strong>NOAA</strong> Fisheries Serviceunder the MSA in order to restore groundfish stocks in theGoM and protect EFH. Specifically, over the past twodecades <strong>NOAA</strong> Fisheries Service in collaboration withthe NEFMC has promulgated fishing regulations that havesignificantly reduced fishing effort, and therefore disturbanceto invertebrates, in the entire northeast, includingthe sanctuary. Some examples of these regulations are:reducing fishing days at sea, creating groundfish and habitatclosed areas (e.g., WGoMCA), reducing trawl net roller gearsizes to prevent bottom trawlers from accessing high reliefhabitat, and creating seasonal closures to protect migratingor spawning species. The protections provided by theWGoMCA and the results to date are previously described.IV. Resource States 73
Fi s h e sSt a t u sFish are a vital component of the sanctuary’s biologicaldiversity and also one of its strongest links to the humanpopulation. The groundfish community in the sanctuary,made up of fishes such as cod, haddock, whiting (silverhake) and various flatfish, has been sought for food fromthe earliest European settlements to the present. The fishspecies found in the sanctuary are generally representativeof fish assemblages in the GoM region. Of the known 652GoM species, over 80 species of fish exist in the sanctuary.These known species are listed by common and scientificname in Appendix J.The diverse seafloor topography and nutrient-rich waters inthe sanctuary result in increased primary productivity andlarge zooplankton populations, which support abundantpopulations of small schooling species such as sand lance,herring and mackerel. Many groundfish and larger pelagicfish prey upon these schooling species, which also formpart of the varied diet of marine mammals and seabirds.Fish found in the sanctuary range in size from small snakeblennies to basking sharks. Some fish, such as giant bluefintuna, are annual migrants to the area, while others, such asthe Acadian redfish, are likely year-round residents.Fishes are among the species most identified with use ofand co-dependence on both seafloor and water columnhabitats because of their obvious mobility. Their distributionand abundance in the sanctuary was used to illustratethe ecological role of seafloor habitats and was describedextensively in that section. As juveniles and adults, manyspecies become closely associated with benthic habitats andcommunities (e.g., Atlantic cod, haddock), but virtually allspecies spend part of their life in the water column as eggs orlarvae (as also do many benthic invertebrate species). Manyspecies of fish live on the seafloor and feed in the watercolumn (e.g., Acadian redfish, sand lance) and many otherspecies live entirely in the water column (Atlantic herring,bluefin tuna). Out of the wide array of ecological nichesfilled by fishes, and the related sets of selective forces thatshape their speciation, diverse species have evolved.Species DiversityOne of the most geographically comprehensive data sets ofspecies composition and abundance across the GoM LMEis for demersal fishes (e.g., cod, haddock). <strong>NOAA</strong> FisheriesService has collected a unique time series of data thatstretches across decades (1963-present). This time serieshas been the basis for two comprehensive analyses of fishspecies diversity in the GoM inclusive of the sanctuary thataddress both temporal trends and spatial patterns.TrendsThe first analysis of these trawl data using a 25-year timeseries (1970–1994) found that the sanctuary had 41 of 48Fi g u r e 35. Se a s o n a l m e a n fish s p e c i e s diversity (s p e c i e s r i c h n e s s) a c r o s s t h e GoM f o r t h e p e r i o d 1975–2005.(Figure excerpted from Auster et al, 2006.)74<strong>Stellwagen</strong> <strong>Bank</strong> <strong>National</strong> <strong>Marine</strong> <strong>Sanctuary</strong> Draft Management Plan/Environmental Assessment
Fi g u r e 36. Ge o g r a p h i c s t r at a o f similar b at h y m e t r i cp r o f i l e u s e d t o c o m pa r e diversity indices w i t h t h eSt e l lwa g e n Ba n k s a n c t u a r y.(Figure excerpted from Auster et al., 2006.)resident fish species, 7 of 17 annual migrants, and 6 of12 shallow coastal species suggesting that the sanctuarysupported a significant number of the species representedin the GoM LME (Auster, 2002). While the effects of heavyexploitation of fish populations in the GoM did not resultin local extinctions over this period, there were significantdeclines in a range of diversity metrics in the sanctuary thattake both species richness and abundance into account.Notably, both Shannon and Simpson indices showed asteep decline over time (1970–1994) at the sanctuary scalewhile remaining stable at the regional GoM scale (Auster,2002). The author concludes that these declines in diversitysuggest that patterns in species richness and evennessare conservative properties of fish assemblages at the scaleof the GoM but not at the scale of the sanctuary and thatmanaging fishing at the regional scale does not necessarilymaintain trends in diversity in the sanctuary. These declinesin diversity were attributed to extensive fisheries exploitationof dominant species and bycatch mortality of species oflower abundance and of little economic value.The second analysis of the <strong>NOAA</strong> Fisheries Service trawldata using a 30-year time series (1975–2005) showed thatthe <strong>Stellwagen</strong> <strong>Bank</strong> sanctuary is in an area of high fishspecies diversity in the GoM (Auster et al., 2006) (Figure35). Values for mean species richness at the regional scalewere variable across the GoM and between spring and fallin most of the sample strata, but were consistently high inthe sanctuary. Overall, slightly lower richness values wereevident in spring than in fall. This difference is attributedto colder temperatures in spring and a reduced number ofsouthern migrants that draw from a more diverse speciespool than do migrants from the north during this season.This seasonal difference is also evident in trends amongseveral diversity indices for fish species within the sanctuary(presented below).In order to contrast the uniqueness of the <strong>Stellwagen</strong> <strong>Bank</strong>sanctuary with other similar regions in the GoM, six differentdiversity indices within the sanctuary were compared acrossother geographic strata that have similar bathymetric ranges(Figure 36). In general, comparison of fish diversity indicesfor the six strata yielded variable results (Figure 37a and b)(Auster et al., 2006). Diversity patterns were quite similarfor some indices, while there was little correlation amongothers. However, fish diversity indices within the sanctuarywere overall higher than or equal to indices within most ofthe other strata. Figures 35, 36 and 37a and b are based on<strong>NOAA</strong> Fisheries Service sampling strata for the GoM.Trends among the fish diversity indices within the sanctuarywere relatively stable or slightly increasing or decreasingover the 30-year time period examined, demonstratingno consistent pattern (Figure 37a and b). This more recentanalysis (Auster et al., 2006) shows a reversal in the Shannonand Simpson indices, which were in decline in theprevious study and attributed to extensive fisheries exploitation(Auster 2002). The proximate cause of this change isunclear, since most fishery management actions occurredbeginning around the mid 1990s.The lower diversity index values for the Margalef’s, Shannon,Simpson, and taxonomic diversity indices in the springduring the 1975–1989 time period all occurred becausesand lance dominated trawl sample abundance within thesanctuary and this species alone comprised more than 50%of the total abundance. The high abundance of sand lancecaptured within the sanctuary during spring 1980-1984severely depressed the diversity index value of these indices.High fish larval abundance within the sanctuary during thewinter and spring months during 1977–1988 was also drivenby sand lance (Auster et al., 2006), where their long hatchingperiod (Nov-May) and persistent larval stage maintains adominant presence in the sanctuary area (Reay, 1970).The diversity indices presented in the foregoing analysesare described as follows. Species richness is the simplestindex and represents the total number of species from eachsample. Margalef’s index incorporates both species richnessand the number of individuals in a sample; it is a measureof the number of species per individual. The Shannon indexis a measure of both species richness and the number ofindividuals of each species in a sample; it is most sensitiveto changes in the number of rare species in a sample.The Simpson index is an estimate of the probability that anytwo individuals drawn from a sample are members of thesame species; it is most sensitive to changes in number andabundance of dominant species in a sample. The other twoindices are based on the relatedness of species through linksof a classification tree (i.e. number of links between speciesin a sample based on connections at generic, family, classlevels, etc.). Taxonomic diversity is based on the averagenumber of links between two individuals chosen at randomfrom the sample. Taxonomic distinctiveness is based onaverage distances of random pairs of individuals that arenot the same species. Magurran (2004) and Clarke andWarwick (2001) provide overviews of the range of diver-IV. Resource States 75
Fi g u r e 37a. Co m p a r i s o n o f fish s p e c i e s diversity (s p e c i e s r i c h n e s s, Ma r g a l e f’s a n d Sh a n n o n indices) b e t w e e n t h eSt e l lwa g e n Ba n k s a n c t u a r y a n d o t h e r similar s t r at a within t h e GoM.(Figure excerpted from Auster et al., 2006.)sity indices available, their calculation and issues regardinginterpretation.PatternsIn general, the greater an area that is sampled the greaternumber of species that are found. An analysis of the rate atwhich fish species increase with increasing area sampled inthe sanctuary showed that more complex habitats do notnecessarily harbor greater species diversity overall. Differenthabitats (i.e., gravel, boulder reef, mud) were found tocontain some similar and some unique species and thatparticular habitats, like boulder reefs, were not significantlymore species diverse than others; however the highestslope for both species-area and species-individual curveswas for mud habitat (Auster et al., 2006). These data werecollected using an ROV and counts of fish and classificationof habitats were accomplished using video observations offish communities on the seafloor, much like divers countingfish on coral reefs, and allowed sampling within particularhabitats.76<strong>Stellwagen</strong> <strong>Bank</strong> <strong>National</strong> <strong>Marine</strong> <strong>Sanctuary</strong> Draft Management Plan/Environmental Assessment
Fi g u r e 37b. Co m p a r i s o n o f fish s p e c i e s diversity (Si m p s o n , t a x o n o m i c diversity a n d t a x o n o m i c d i s t i n c t n e s s indices)b e t w e e n t h e St e l lwa g e n Ba n k s a n c t u a r y a n d o t h e r similar s t r at a within t h e GoM.(Figure excerpted from Auster et al., 2006.)The patterns of species diversity identified for both thelarge and small scale studies cited above suggest that habitatswithin regions and the regions within the larger GoMLME contain part of the overall pool of species. That is, thenumber of species coexisting in local communities, such asin the sanctuary, must be a result of processes that functionat both local and regional spatial scales. Any sites withinthe GoM should be expected to have some, but not all ofthe species represented within the LME and that a networkof sites across the GoM would be needed to contain representativeexamples of diversity for the entire biogeographicprovince.These findings support the role that can be attributed tothe sanctuary as an important biodiversity “coldspot”(sensu Kareiva and Marvier, 2003) and as a priority areafor networked marine ecosystem management in the GoM(Crawford and Smith, 2006). A study of marine invertebratecommunities that occur on shallow rock walls from aroundthe world has found similar patterns for epifaunal species(Witman et al., 2004), suggesting this is a common attri-IV. Resource States 77
Fi g u r e 38. An n u a l p e r c a p i t a e g g p r o d u c t i o n (inm i l l i o n s o f e g g s) f o r c o d (Ga d u s m o r h u a) a s a f u n c t i o no f a g e (a n d b y implication size).Fecundity estimated from Bireta and Warwood (1982); meanlengths at age estimated from O’Brien (1999). (Figure excerptedfrom Palakovich and Kaufman, in preparation).bute of species distributions in marine ecosystems. (See theBiogeographic Context section of this document for backgrounddiscussion.)Tr u n c at i o n o f Si z e a n d Ag e St r u c t u r eThe fact that large fish produce many more offspring thansmall fish is well established in the scientific literature (Figure38). This is largely because eggs are produced in proportionto a fish’s volume, which is proportional to the cubeof its length, but also because larger fish devote a greaterproportion of energy stores to egg production. It is nowalso evident that old fish produce healthier eggs and larvaethan do young fish (Berkeley et al., 2004a; Marteinsdottirand Steinarsson, 1998; Wright and Gibb, 2005). The eggsof older fish are invariably of higher quality than the eggs ofyounger fish due to the greater amount of oil stored in theyolk sac at parturition (i.e., hatching). This produces larvaethat grow faster and which are more resistant to starvationthan larvae from younger females. A doubling of the growthrate of larval Atlantic cod for example, due to sufficientenergy stores in the yolk sac, can produce a 5- to 10-foldincrease in survival rate (Meekan and Fortier, 1996).Many species of marine fish are long-lived, with the maximumage of species in a diverse range of families oftenexceeding 100 years (Cailliet et al., 2001). The associationof longevity with variability in recruitment is also widespreadamong many fish species (Longhurst, 2002). The adaptivevalue of a long life span is that reproductive output is allocatedacross many years, a bet-hedging strategy that ensuressome reproductive success despite potentially long periodsof environmental conditions unfavorable for larval survival(e.g., Secor, 2000a). A growing body of evidence indicatesthat a broad age distribution can also reduce recruitmentvariability (Lambert 1990; Marteinsdottir and Thorarinsson1998; Secor, 2000b).Berkeley et al. (2004) offer two mechanisms by whichreproductive optimization due to broad age distributioncan occur: (1) there may be age-related differences in thetime and location of spawning, effectively spreading larvalproduction over temporally and spatially variable environmentalconditions (Hutchings and Myers, 1993; Lambert,1987), and (2) older fish may produce more fit eggs andlarvae, which can survive under conditions inadequatefor survival of progeny from younger fish (Hislop, 1988;Marteinsdottir and Steinarsson, 1998). Whereas older fishare likely to produce larvae of better condition, in largernumbers and in more frequent batches than younger fish,thereby ensuring population viability, fishing obliterates thisbenefit by selectively removing larger, older individuals.These findings are important considerations for sanctuarymanagement because it is becoming abundantly apparentthat high numbers of larger, older fish are what ultimatelysustain fish populations (Lambert, 1990; Leaman andBeamish, 1984; Marteinsdottir and Thorarinsson, 1998;Trippel et al., 1997). And larger fish, especially amongkeystone species such as Atlantic cod, are important agentsin the structuring of biological communities through sizemediated differences in food habits and rates of predation,as well as in competitive outcomes between species of thesame or similar feeding guilds. Large fish are also the targetof commercial and recreational fishing activities, which inlight of current knowledge may be contrary to optimizingconservation benefit (Berkeley et al., 2004b; Birkeland andDayton, 2005), depending on the management objective,e.g., maintenance of biological communities.Big Old Fat FemalesResearch on a variety of fish species clearly indicates thegreat importance of experienced spawners (BOFFs or “bigold fat females”) to the future of a fish population. Empiricalstudies indicate that Atlantic cod exhibit a BOFF effect.In a paper recently submitted for peer review (Palakovichand Kaufman), researchers examined the strength and significanceof this effect to stock rebuilding using a dynamicmodel and the <strong>Stellwagen</strong> <strong>Bank</strong> sanctuary as the target area.Results of this modeling study indicated that first, secondand third-time spawners were cod ages 1 to 9 years old andexperienced (BOFF) spawners were ages 10 and 11. BOFFspawners contributed about ten times more offspring thatsurvived their first year than did younger, less experiencedspawners. Third-time spawners contributed the greatestproportion of recruits but still had much lower per capitareproductive output than BOFF year classes. The reproductivevalue of first and second-time spawners was negligibledue to both low output and low larval survival.Current fisheries management practice in New England,based upon the paradigm of optimum sustainable yield(OSY), favors a population dominated by young breeders.Palakovich and Kaufman (in review) conclude that failureto protect large, experienced female cod produces a yieldthat may be optimal in a conventional sense but may notbe sustainable under historic high levels of exploitation. Inaddition, the truncation of the cod size distribution favoredby current management eliminates large “old growth” codas a functional component of the ecosystem, altering the78<strong>Stellwagen</strong> <strong>Bank</strong> <strong>National</strong> <strong>Marine</strong> <strong>Sanctuary</strong> Draft Management Plan/Environmental Assessment
food web and possibly alsoother aspects of communitystructure. Palakovich andKaufman (in review) concludethat if fishery managementobjectives are for cod populationsto rebuild and for cod toonce again become a majorfunctional part of the ecosystem,then the BOFF effectshould be incorporated intomanagement models for fishingin the <strong>Stellwagen</strong> <strong>Bank</strong>area; most likely they shouldapply to the GoM as a wholefor the sanctuary to appreciatemajor benefits.Fi g u r e 39. De c r e a s e in m a x i m u m l e n g t h o f w h i t e h a k e s a m p l e d in t h e St e l lwa g e n Ba n ks a n c t u a r y b y <strong>NOAA</strong> Fi s h e r i e s Se r v i c e s ta n d a r d i z e d t r aw l s u rv e y s o v e r t h e p e r i o d1963–2000.(Figure excerpted from Crawford and Cooke, in preparation.)Changes in Fish MaximumLengthRetrospective time series ofmean body length of Atlanticcod from kelp forests in thecoastal GoM declined from1.0 m 3550 yrs B.P. (beforepresent) to 0.3 m at presenttime, indicating a 3-folddecrease in trend due to fishing(Jackson et al., 2001). Thisanalysis was conducted ondata derived from archaeologicaland historic sources. Thistrend has extended offshoreto Georges <strong>Bank</strong> (Sherman,1991) and, as explainedbelow, to the <strong>Stellwagen</strong><strong>Bank</strong> sanctuary for cod andother species as well. In the1960s and 70s, the maximumlength of cod in the sanctuaryapproximated what the meanlength had been historically inthe GoM.A study was conducted in2003 that analyzed the 38years of <strong>NOAA</strong> FisheriesService research trawl datathat was available at the time(1963-2000) to assess changesin fish maximum length withinthe sanctuary over this period(Crawford and Cook, in preparation). The length of thelargest individuals sampled each year (for example Figure39), and by separate analysis the length of the 90 percentilepoint, were regressed over time for each of the 15 speciesstudied with comparable findings. Based on the regressionsof the length of the largest individuals sampled, all of thespecies examined showed decreasing trends in maximumFi g u r e 40. Re d u c t i o n in m a x i m u m l e n g t h o f 15 s p e c i e s o f e c o l o g i c a l ly a n dc o m m e r c i a l ly i m p o r t a n t fish o v e r a 38-y e a r p e r i o d (1963–2000) within t h e St e l lwa g e nBa n k s a n c t u a r y.All species showed decreases in maximum length; those signified by the blue bars were statisticallysignificant. The number in parenthesis following fish name was the number of trawl samplesanalyzed for the respective fish species identified (Crawford and Cook, in preparation).length over the 38-year period (Figure 40). For seven ofthese species (white hake, goosefish, winter flounder, silverhake, cod, yellowtail flounder, haddock), the decrease wassignificant. Estimated maximum length decreases for theseven species ranged from 15% to 49% for this period.The maximum length of white hake was reduced by nearlyhalf (49%) and Atlantic cod was reduced by 27% over thisIV. Resource States 79
period, for example. The average decrease for all 15 speciescombined was 20%. While the study did not address thecause of the decrease in maximum length, the simplestexplanation is the consequence of nearly four decades ofheavy exploitation.A subsequent analysis of the maximum length of fish caughtin the sanctuary for a more recent time period (1990-2005)offers some cause for optimism for a subset of the speciesoriginally examined by Crawford and Cooke (i.e., Atlanticcod, haddock, white hake, American plaice, winter flounder,witch flounder, and yellowtail flounder). Since the onsetof fishery management actions in the 1990s, the maximumlength of some species, particularly cod and haddock,appears to be increasing (Figure 41). Other species (particularlythe flatfishes) show signs of a reversing trend in maximumsize but are still of concern. The data analyzed arefrom the <strong>NOAA</strong> Fisheries Service research trawl surveysconducted within the sanctuary and serve to update theresults of the analysis by Crawford and Cooke presentedabove.The finding of the great extent to which the size and (byimplication) age structure of key commercial and ecologicallyimportant fish species has been truncated in thesanctuary compounds the likely population consequencesof the BOFF effect, if it extends to these species as well.Related work with haddock suggests that it does (Wrightand Gibb, 2005). The removal (i.e., absence) of large sizeclasses among these key predatory species should also havea profound effect on the composition of their associatedbiological communities within the sanctuary due to ontogeneticdiet shifts associated with predator morphology and/or habitat. Size-based diets are a common pattern in theNortheast shelf fish community and diet shifts have importantimplications for trophic dynamics and both sanctuaryand fisheries management (Garrison and Link, 2000). In thecase of piscivores (such as cod), the range of available preygenerally increases with predator size related to increases inpredator gape width (size of mouth), swimming speed andvisual acuity (reviewed in Juanes, 1994).The truncation of old-growth age structure due to fishingcan also have a profound effect on the genetic make-upand expression of traits within exploited fish populations.Selective fishing pressure on the larger (older) individuals offishes over recent decades has caused the rapid evolution ofdecreased body size and fecundity of northern cod (Olsen etal., 2004). An evolutionary change more troublesome thanthe reduction in body size and fecundity is the reductionof genetic diversity within fish species due to the harvestingof old-growth age structure. <strong>Marine</strong> fish populationsare vulnerable to the loss of genetic variability, potentiallyleading to reduced adaptability and population persistencewhen the older members of the fish population are removed(Hauser et al., 2002).Management ImplicationsOne of the principal objectives of the sanctuary is to protectand restore the ecological integrity of the sanctuary. In orderto do this, the recent evidence discussed above suggeststhat old-growth age structure and large body-size classesbe maintained in the population. As previously explained(Habitat Mediated Movement section this document), 35%of Atlantic cod tagged in the sanctuary demonstrated a highdegree of site fidelity and a meta-analysis of 100 years ofcod tagging studies across the North Atlantic showed a highrate (32%) of sedentary behavior for the species. These findingssuggest that management directed at the sanctuary areaalone (as opposed to the entire GoM) may be effective inmeeting the sanctuary’s objectives.Fi g u r e 41. Ch a n g e in m a x i m u m l e n g t h o f a subset o f fish s p e c i e s s a m p l e d in t h e St e l lwa g e n Ba n k s a n c t u a r y d u r i n g1990–2005.80<strong>Stellwagen</strong> <strong>Bank</strong> <strong>National</strong> <strong>Marine</strong> <strong>Sanctuary</strong> Draft Management Plan/Environmental Assessment
Old-growth age structure in long-lived fish (such as cod) canbe maintained by three approaches (Berkeley et al., 2004b):(1) lowering catch rates substantially, which can be economicallyinfeasible; (2) implementing slot limits (release of bothsmall and large individuals), which may be impractical dueto capture mortality (e.g., via swimbladder expansion); and(3) implementing marine protected areas (MPAs) to ensurethat at least part of the stock can reach old age and largesize. The obvious conclusion is the need to minimize whathas conventionally been seen as an expected and harmlessside-effect of fishing to maximize density-dependent surplusproduction: age and size truncation (the loss of older ageclasses and large size classes) (Francis et al, 2007).As indicated below under regulatory provisions, <strong>NOAA</strong>Fisheries Service has instituted regulations that are workingto lower catch rates in the GoM region and establishedthe WGoMCA in 1998 (although only overlapping 22% ofthe sanctuary area), hence implementing two of the threeapproaches identified that could help restore and maintainold-growth size and age structure of fishes in the GoM. Thedata series used to examine old-growth size structure in thesanctuary will continue to be extended to include the mostrecent data years available for all 15 species and analyzedto evaluate whether and to what degree these managementactions are effective at restoring the old-growth size (andhence age) structure of these ecologically important fishspecies within the sanctuary.Pr e s s u r e sCommercial fishing with mobile gear, such as trawls andscallop dredges, together with fixed gear, such as bottomtendinggill nets and lobster pots, occurs extensively throughoutthe sanctuary. Commercial fishermen take species fromfour principal categories: groundfish, pelagics, other finfishand invertebrates. On average, 327 commercial fishingvessels per year fished in the sanctuary during 1996-2005(see Commercial Fishing section of this document fordetails). Stressors resulting from commercial fishing includealteration of habitat and biological communities, removalof biomass, disturbance of feeding whales, entanglement ofmarine mammals, discharges of pollutants and destructionof historic <strong>resource</strong>s. Other stressors, i.e., water quality,HABs, invasive species, are addressed in previous sectionsof this document.The sanctuary is also a popular destination for recreationalfishing boats. Recreational fishing by party, charter andprivate boats in the sanctuary targets primarily groundfishbut also pelagic species such as tuna, shark and bluefish.On average, 69 party and charter boats per year fished inthe sanctuary during 1996-2005 (see Recreational Fishingsection of this document). Party boat and charter boat recreationalfishing occurs over much of the sanctuary; however,the precise amount of private recreational use of the sanctuaryhas not been quantified. The recreational fishing fleetis estimated to take 25% of the Atlantic cod in the GoM(NEFMC, 2003). Stressors resulting from recreational fishingactivities include targeted removal of large fish, fishingat times and places associated with spawning aggregations,discard mortality, disturbance of feeding whales, vesselstrikes to whales, discharge of pollutants and destruction ofhistoric <strong>resource</strong>s.Cu r r e n t Pr o t e c t i o nRe g u l at o r y ProvisionsFishery <strong>resource</strong>s in the Northeast, including in the sanctuary,are regulated by <strong>NOAA</strong> Fisheries Service with input fromthe NEFMC, the Mid-Atlantic Fishery Management Council(MAFMC) and the Atlantic States <strong>Marine</strong> Fisheries Commission(ASFMC). Some restrictions on fishing that affect thesanctuary have been put in place, including limited accessprograms and effort controls, rolling closures for groundfishing,catch and minimum size limits for individual species,and a large, permanent year-round habitat closure in theWGoMCA. See Sidebar for related considerations.The latest approved Fishery Management Plan (FMP) developedby the NEFMC and the MAFMC is currently implementedby Amendment 13 to the Northeast MultispeciesFMP (2004) (50 CFR Part 648). Other plans exist for thefollowing species: Atlantic salmon; Atlantic sea scallop;American lobster (50 CFR Part 697); northeast multispeciesand monkfish; mackerel, squid and butterfish; surfclamand ocean quahog; summer flounder; scup; black sea bass;Atlantic bluefish; Atlantic herring; spiny dogfish; Atlanticdeep-sea red crab; tilefish; and the skate complex.The Northeast Multispecies FMP establishes the following:• Reduction in the number of Days at Sea• Minimum size regulations for several major commercialand recreational species including but not limited to:monkfish, Atlantic cod, haddock, pollock, witch flounder,yellowtail flounder, American plaice and winter flounder• Closures of spawning areas over Georges <strong>Bank</strong>, southernNew England and the GoM• New habitat closed areas over Georges <strong>Bank</strong>, southernNew England and the GoM• Increase in the mesh size of mobile trawl gear and gillnets• Fish excluder devices and modified gear (raised footrope)for small mesh exempted fisheries• Limits to hook size and number for hook gear• Marking requirements for gillnet gearIn addition, federal lobster regulations (50 CFR Part 697)limit trap sizes and the number of traps allowed.Under Amendment 13, the NEFMC and the MAFMC havealso developed an updated FMP for Atlantic herring in coordinationwith the ASMFC; they also have developed a fisherymanagement plan for the Arctic surf (or Stimpson) clam,for which commercial exploitation has been initiated in the<strong>Stellwagen</strong> <strong>Bank</strong> area (Amendment 13, 50 CFR part 648).The northern shrimp FMP was developed by the ASFMC.The ASFMC is additionally responsible for striped bass andbluefish fisheries; the plan for the latter species is devel-IV. Resource States 81
oped in cooperation with the MAFMC. The MAFMC is alsocharged with sole responsibility for management plans onsummer flounder, butterfish, short and long-finned squid,surf clam, ocean quahog and mackerel.Fishing for commercial bluefin tuna is regulated under theInternational Commission for the Conservation of AtlanticRelated ConsiderationsFishing is not currently subject to regulation by the<strong>Stellwagen</strong> <strong>Bank</strong> sanctuary pursuant to the sanctuaryDesignation Document (Appendix B). In 1993 whenthe sanctuary was established, <strong>NOAA</strong>/NOS concludedthat adequate legal mechanisms existed under theMFCMA to provide appropriate management offisheries and that no supplementary fishing regulationsunder the NMSA were necessary (USDOC, 1993).In the 15 years since sanctuary designation conditionshave changed. As of the 4th quarter of 2007, twentyone stocks require rebuilding within the New Englandfisheries, the highest number among the nation’sfishery management councils; eighteen stocks areoverfished and overfishing is occurring in eightstocks (http://www.nmfs.noaa.gov/sfa/domes_fish/StatusoFisheries/2007/FourthQuarter/TablesA_B.pdf). Associated context is provided in Rosenberg etal., (2006). Moreover, the condition of <strong>resource</strong> <strong>states</strong>in the sanctuary is now more fully characterized and ismuch better understood than in 1993, when the firstmanagement plan for the sanctuary was published by<strong>NOAA</strong>.Importantly, for those stocks currently experiencingoverfishing, the MFCMA calls for all overfishing tobe eliminated by 2010. In terms of an ecosystemapproach to management, <strong>NOAA</strong> must also considerthe significant collateral effects of fishing on sanctuary<strong>resource</strong>s that must be accounted for under thecomprehensive <strong>resource</strong> protection objectives of theNMSA. These include biodiversity loss at the genetic,species and community levels; food web changes andshifts in community composition that occur throughdepletion of forage species and top level predators; thetruncation of population size and age structures; and,degradation and loss of the sanctuary’s biogenic habitatsand living landscapes.The congressionally mandated periodic review ofsanctuary management plans allows national marinesanctuaries to adjust to better protect sanctuary<strong>resource</strong>s. <strong>NOAA</strong> has determined that renewedconsideration should be given to reduction of ecologicalimpacts from fishing activities and mobile fishinggear in the sanctuary as described in the EcosystemAlteration Action Plan in this document, for example.An explanation of the regulatory coordination toolsavailable through the NMSA on fishery managementissues in national marine sanctuaries is provided inAppendix H.Tuna (ICCAT), as implemented via the Atlantic Tunas ConventionAct of 1975. Quotas for bluefin tuna are determinedby ICCAT. <strong>NOAA</strong> Fisheries Service allocates this quota bycategories assigned to the four gear types employed in thefishery: hand-line, rod and reel, harpoon and purse seinenet. The species is also caught incidentally by pelagiclongline vessels.Fishing for Atlantic striped bass in the sanctuary is prohibitedby the general provisions set forth in 50 CFR 697.7(b). Thissection <strong>states</strong> that it is unlawful for any person to do any ofthe following: (1) fish for striped bass in the US EEZ [ExclusiveEconomic Zone], (2) harvest any striped bass from theEEZ, (3) possess any striped bass in or from the EEZ (notedexceptions in areas of New York and Rhode Island), and (4)retain any striped bass taken in or from the EEZ. Boundariesof the <strong>Stellwagen</strong> <strong>Bank</strong> sanctuary fall entirely withinthe EEZ, hence this regulation applies to the sanctuary.Se a b i r d sSt a t u sSeabirds are defined as birds that spend a large proportionof their lives at sea, feeding either entirely or predominantlyon marine organisms, and coming ashore for relativelyshort periods for resting or breeding (Schreiber and Burger,2001). Most seabirds are assigned to one of three orders:the Procellariiformes (e.g., shearwaters, fulmars, petrels andalbatrosses), the Pelecaniformes (e.g., gannets, pelicans,boobies and cormorants) or the Charadriiformes (e.g., gulls,terns, auks). Seabirds are usually numerically abundant,long lived (15-70 years) and feed at a variety of TLs (i.e.,predators and scavengers). As such, seabirds can be veryresponsive to changes in their environment.The broad-ranging movements and longevity of seabirdsmean that they track environmental changes at spatialand temporal scales that are otherwise difficult to monitor82<strong>Stellwagen</strong> <strong>Bank</strong> <strong>National</strong> <strong>Marine</strong> <strong>Sanctuary</strong> Draft Management Plan/Environmental Assessment
(Diamond and Devlin, 2003; Huettmann and Diamond,2006). For example, seabird species are useful bioindicatorsby providing valuable information to define pelagichabitat types (Springer et al., 1996) and assess ecosystemhealth (Furness and Greenwood, 1993). Changes inseabird distribution and abundance, as well as breedingsuccess, growth rates, survival and diet composition, havebeen closely linked to regional climate variability (e.g.,North Atlantic oscillations and El Niño/La Niña events)and global climate change (Aebischer et al., 1990; Brown,1991; Monaghan, 1992; Montevecchi and Myers, 1997;Schreiber and Schreiber, 1989;) and changes in prey abundance(Cairns, 1987; Diamond and Devlin, 2003; Hameret al., 1991; Garthe et al., 1996). Seabirds also have thepotential to function as indicators of pollutants, particularlysince they rapidly bio-accumulate chemicals that are lipidsolublesuch as organo-chlorines (e.g., DDT, PCBs) andorgano-metals (e.g., methyl mercury) (Chapdelaine et al.,1987; Furness and Camphuysen, 1997).The GoM is locally and internationally recognized as animportant area for seabirds, with seabird densities that areconsiderably higher than adjacent oceanic waters (Powers etal., 1980; Powers, 1983; Powers and Brown, 1987; Platt etal., 1995). The shallow banks and shelves, including Brown’s<strong>Bank</strong>, Georges <strong>Bank</strong>, <strong>Stellwagen</strong> <strong>Bank</strong>, Cashes Ledge, CapeCod and the Grand Manan region, have long been knownto support large numbers of seabirds (Powers, 1983; Powersand Brown, 1987; Huettmann and Diamond, 2006). In itscapacity as the U.S. partner of BirdLife International, theMassachusetts Audubon Society (Mass Audubon) has designated<strong>Stellwagen</strong> <strong>Bank</strong> an Important Bird Area (IBA). AnIBA is a site that provides essential habitat to one or morespecies of breeding, wintering or migrating birds, and whichsupports high-priority species, large concentrations of birds,exceptional bird habitat, and/or has substantial research oreducational value.Species Fr e q u e n t i n g t h e GoMMany of the seabirds observed in the GoM are seasonalmigrants that have traveled vast distances from remoteislands in the south Atlantic where they nest (Brown, 1973).For example, Wilson’s storm-petrel migrates to the GoMduring summer from breeding sites in sub-Antarctic islands.Sooty shearwaters and greater shearwaters are also summermigrants to the GoM from breeding sites on several remotesouth Atlantic islands (Tristan da Cunha and Gough Island)and sub-Antarctic islands (Huettmann, 2000). Other birds,including some arctic terns and red phalaropes connect theGoM with southern and western Africa (Brown, 1979).Black-legged kittiwakes and great cormorants are wintermigrants, typically migrating from more northerly regionsalong with some auks, especially razorbills. Other seabirdsmigrate shorter distances (e.g., from Canada) to specific siteswithin the GoM that are considered to be important moultinggrounds for immature birds (Huettmann and Diamond,2000; Huettmann et al., in press). Non-resident seabirdsvisiting the GoM typically exhibit a spring and fall arrivaland departure pattern (Powers and Brown, 1987). Atlanticpuffins from Maine and Canada are frequently observedfeeding in the sanctuary during winter months. The majorityof shearwater species in the region are migrants and breedoutside the study area (Brown, 1988, 1990).Seabirds that have established breeding colonies in theGoM region include Atlantic puffin, black guillemot,common murre, Leach’s storm-petrel, razorbill, commoneider and several species of cormorant, gull and tern. Infact, the islands of Maine provide the only breeding sites inthe United States for Atlantic puffin and razorbill (one of therarest breeding auks in North America) and provide some ofthe southernmost breeding sites for Leach’s storm-petrel andcommon eider. These breeding sites prompted the U.S. Fishand Wildlife Service (GoM coastal program) to recognizeapproximately 300 “nationally significant” seabird nestingislands in the GoM.Relationships w i th t h e En v i r o n m e n tMany seabirds have distinct utilization patterns associatedwith specific ocean currents and water masses, and theboundaries between those features, as well as finer-scaleoceanographic and bathymetric features that affect preydispersion and availability (Balance et al., 2001; Daunt etal., 2003; Schneider, 1990b, 1997). In most regions, oceanographic(e.g., sea surface temperature and chlorophyllconcentrations) and bathymetric variables show a strongacross-shelf spatial gradient that is associated with patternsof seabird distribution and prey abundance.Seabird preference for shallow continental shelf watersversus deeper oceanic waters, proximity to shore, or tosome distinct bathymetric feature (e.g., continental shelfedge) have been found to explain broad-scale patterns inabundance for a wide range of seabird species (Schneider,1997; Wynne-Edwards, 1935; Yen et al., 2004a,b). Forexample, Yen et al. (2004a,b) found that seabirds targetregions of complex and steep topographies where oceanographicconditions lead to elevated productivity (fronts andupwelling zones) and increased prey retention.The razorbills, murres and puffins (Alcidae), terns and somegulls (Laridae), fulmars, shearwaters and storm-petrels(Procellariiformes), gannets (Sulidae) and cormorants (Phalacrocoraciidae)are key components of the offshore ecosystem,where they form an important group of predators ofsmall fish, squid and planktonic crustaceans. The primaryprey items for most of these seabird species are small fishincluding Atlantic herring, sand lance, hake and mackerel,although they will also feed on cephalopods, crustaceans,annelids and some plant material (Powers et al., 1980; Hallet al., 2000; Diamond and Devlin, 2003).Stomach content analysis of 156 individuals of nine seabirdspecies (five species of Procellariiformes and four gulls, Laridae)collected at sea from the northeastern continental shelfshowed that all species fed on fish, with sand lance beingan important prey item for most marine birds throughoutthe year (Powers et al., 1980). Squid were also a majorprey item for many species, particularly greater shearwaters,IV. Resource States 83
while euphausiids (pelagic crustaceans) were an importantcomponent of the diet of Wilson’s storm-petrel.Se a b i r d Utilization o f t h e Sa n c t ua r yAn estimated 60 species of seabird were recorded withinthe GoM, based on sightings from the Manomet Bird Observatory(MBO) surveys (1980-1988). More than half of these,32 species, were identified for the <strong>Stellwagen</strong> <strong>Bank</strong> sanctuary(34 species were identified in a separate standardizedsurvey of the sanctuary as presented below). The seabirdspecies utilizing the sanctuary are listed by common andscientific name in Appendix J. Species rank based onfrequency of occurrence was very similar between thesanctuary and the broader GoM, with the exception of gullswhich, respectively, were more frequently and shearwaters,less frequently sighted within the sanctuary. In addition,there were five separate sightings of the federally endangeredroseate tern in the GoM, one of which was recordedwithin the sanctuary. Since the surveys, MBO was renamedthe Manomet Center for Conservation Sciences.Predictive ModelingThe <strong>NOAA</strong> <strong>National</strong> Center for Coastal and Ocean Science(NCCOS) integrated the MBO seabird survey databasecovering the U.S. portion of the GoM with the PIROP (Integredes Recherches sur les Oiseaux Pelagiques) seabirdsurvey database covering the Canadian portion of the GoMfor predictive modeling purposes (Pittman and Huettmann,2006). The combined database provides large sample sizesand exceptional spatial and temporal resolution for the GoMregion and the northeastern U.S. continental shelf. Thisdatabase was used to model and predict temporal patternsof seabird distribution and total abundance across a verybroad spatial scale.Monthly total abundance data for eight focal seabird species,corrected for effort, were compared to examine temporalpatterns of abundance (Pittman and Huettmann, 2006). Forthis analysis, the GoM region was divided into 5 x 5 minutecells. Although the model presented a simplified estimateof monthly changes in seabird abundance, the temporalpatterns of presence and absence for the GoM were clearlyshown. This was true at the scale of the sanctuary area whenseasonal summer-winter comparisons were made.The sanctuary area supported all eight focal species ineither one or both seasons. The sanctuary supported a highernumber of species during winter months than summermonths. In winter months, the maximum mean number offocal species (per cell) using the sanctuary was eight. Highestseabird diversity was recorded over the northern tip of<strong>Stellwagen</strong> <strong>Bank</strong> and southern Tillies Basin. In summermonths, the maximum mean number of focal species (percell) using the sanctuary was four, with highest mean numberof species occurring over the central <strong>Stellwagen</strong> <strong>Bank</strong> areaand Tillies Basin. Non-breeding summer migrants (greatershearwater and Wilson’s storm-petrel) were particularlyprevalent within sanctuary waters.Ta b l e 6. Si g h t i n g s t o t a l i n g 5,825 s e a b i r d s o f 34 s p e c i e sLaridaein n i n e fa m i l i e s r e c o r d e d in t h e St e l lwa g e n Ba n ks a n c t u a r y d u r i n g Ju ly 1994–Au g u s t 1995.Family Common Name CountHydrobatidaeSulidaeAlcidaeAnatidaeProcellariidaePhalacrocacidaeGaviidaeScolopacidaeGreat Black-Backed Gull 1,516Herring Gull 1,431Black Legged-Kittiwake 276Common Tern 48Ring-Billed Gull 11Pomarine Jaeger 5Least Tern 4Laughing Gull 3Parasitic Jaeger 2Unidentified Gull 1Unidentified Jaeger 1Total 3,298Wilson’s Storm-Petrel 1,100Leach’s Storm-Petrel 4Total 1,104Northern Gannet 510Total 510Razorbill 219Unidentified Large Alcid 30Dovekie 14Atlantic Puffin 5Common Murre 5Black Guillemot 4Thick-Billed Murre 1Total 278Common Eider 206White-Winged Scoter 37Black Scoter 12Surf Scoter 6Oldsquaw 2Total 263Greater Shearwater 176Sooty Shearwater 64Cory’s Shearwater 6Manx Shearwater 5Northern Fulmar 5Total 256Double-Crested Cormorant 54Great Cormorant 27Total 81Common Loon 21Red Throated Loon 1Total 22Unidentified Phalarope 12Red-Necked Phalarope 1Total 13Total 5,82584<strong>Stellwagen</strong> <strong>Bank</strong> <strong>National</strong> <strong>Marine</strong> <strong>Sanctuary</strong> Draft Management Plan/Environmental Assessment
Patterns of prevalence indicated that auks used the sanctuarymore in winter than summer. Highest auk prevalencewas recorded in winter at the southern end of the <strong>Stellwagen</strong><strong>Bank</strong> and northern tip of Cape Cod. Highest prevalencefor auks in winter over the southern tip of <strong>Stellwagen</strong>Basin was also predicted in the model. Similar seasonal usepatterns were found for razorbill, with absence in summerand intermediate level prevalence in the southern part ofthe sanctuary in winter. Greater shearwaters were moreprevalent than auks in both winter and summer seasons,with sightings recorded from most cells within the sanctuaryarea. Tillies Basin supported highest prevalence of greatershearwaters, particularly in the summer months.Northern gannets were widespread throughout the sanctuaryin winter with highest prevalence in the south andcentral portions of the sanctuary. Northern gannets werealso recorded in summer, although they were both lesswidespread and less prevalent than in winter. Wilson’sstorm-petrels were also distributed throughout the sanctuaryin summer with highest prevalence over shallow waterson central <strong>Stellwagen</strong> <strong>Bank</strong> and over deeper waters of TilliesBasin. Wilson’s storm-petrels were not recorded within thesanctuary during winter months.Standardized SurveyDuring July 1994–August 1995, a 14-month long study wasundertaken by the sanctuary to quantify and map patterns ofhuman and wildlife use of the sanctuary, including seabirds(D. Wiley and S. Highley, unpublished data). Each monthdata were collected along 10 standardized shipboard surveytracklines (strip transects of 400 m width) that crossed thesanctuary at 5 km (2.5 nm) intervals providing completecoverage of the southern two-thirds of the sanctuary thatwere surveyed. The 1994–1995 survey was repeated in2001–2002 with area coverage at this later date includingthe entire sanctuary but excluded seabirds. (Refer to Wileyet al., 2003 for details of the methodologies used.)The distribution of data grouped by seabird family wasanalyzed to portray the grid density and spatial intensity ofseabird use of the sanctuary. Data were binned into 5 x 5minute grid cells for analysis, as done for the GoM regionmodel discussed above. The analysis of the standardizedsurvey data was done by NCCOS on behalf of the sanctuaryduring preparation for their larger scale GoM modeling.These results do not appear in their published work (Pittmanand Huettmann, 2006).Sightings totaling 5,825 seabirds of 34 species in ninefamilies were recorded within the sanctuary during July1994–August 1995 (Table 6). Their relative seasonal abundancegrouped by family is summarized in Figure 42 for thecalendar year July 1994–June 1995. This figure should bereferred to in the subsequent descriptions of seasonality. Thespatial distribution and density over all seasons for selectedfamilies is presented in a series of grid plots of the sanctuarythat accompany the following family accounts (Figure 43).The family Laridae (gulls, terns and jaegers) was numericallydominant over the year, being less abundant in the spring.Fi g u r e 42. Re l at i v e s e a s o n a l a b u n d a n c e o f s e a b i r d swithin t h e St e l lwa g e n Ba n k s a n c t u a r y f o r t h e c a l e n d a ry e a r Ju ly 1994–Ju n e 1995.Data are individual sightings of species from the standardizedsurvey grouped by family.Highest numbers were seen in vicinity of the northern andsouthern portions of <strong>Stellwagen</strong> <strong>Bank</strong>. Great black-backedgulls and herring gulls were most frequently seen.The family Hydrobatidae (storm-petrels) was present onlyduring spring (especially) and summer. Storm-petrels weresighted widely over <strong>Stellwagen</strong> <strong>Bank</strong> and area in spring,with highest numbers in both the northern and southernportions; but sightings in summer were entirely in the southernportion of the bank, especially the southwest corner andadjacent area.The family Sulidae (gannets and boobies) was most numerousduring fall (especially) and spring, although present inIV. Resource States 85
Fi g u r e 43. Pa r t 1. Spat i a l distribution a n d d e n s i t y o f s e a b i r d s in t h e St e l lwa g e n Ba n k s a n c t u a r y.Data are individual sightings of species from the standardized survey for the period July 1994 – August 1995 grouped by family andaggregated over all seasons. Families included in the figure are: Laridae (gulls, terns and jaegers), Sulidae (gannets and boobies),Hydrobatidae (storm-petrels), Alcidae (auks, murres and puffins), Anatidae (ducks, geese and swans), and Procellaridae (shearwatersand fulmars). Data were analyzed by ArcView’s ArcMap program.86<strong>Stellwagen</strong> <strong>Bank</strong> <strong>National</strong> <strong>Marine</strong> <strong>Sanctuary</strong> Draft Management Plan/Environmental Assessment
Fi g u r e 43. Pa r t 2. Spat i a l distribution a n d d e n s i t y o f s e a b i r d s in t h e St e l lwa g e n Ba n k s a n c t u a r y.Data are individual sightings of species from the standardized survey for the period July 1994–August 1995 grouped by family andaggregated over all seasons. Families included in the figure are: Laridae (gulls, terns and jaegers), Sulidae (gannets and boobies),Hydrobatidae (storm-petrels), Alcidae (auks, murres and puffins), Anatidae (ducks, geese and swans), and Procellaridae (shearwatersand fulmars). Data were analyzed by ArcView’s ArcMap program.IV. Resource States 87
lower numbers over other seasons. Highest numbers wereseen widely over and around <strong>Stellwagen</strong> <strong>Bank</strong> and Basin.The family Alcidae (auks, murres and puffins) was presentonly during fall and especially winter. Numbers were seenwidely over <strong>Stellwagen</strong> <strong>Bank</strong> and area in both seasons, butareas of greater concentration occurred in both the northern(especially) and southern portions of the bank in winter.The family Anatidae (ducks, geese and swans) was principallysighted during summer, fall (especially) and winter.Highest numbers were seen over <strong>Stellwagen</strong> Basin and thewestern margin of the bank.Sightings of species in the remaining four families wererelatively rare during this particular 12-month period. TheProcellariidae (shearwaters and fulmars) were sighted inspring, summer (notably) and fall; they were not sighted inthe winter. This family is customarily well-represented inthe sanctuary, which is the case when the entire 14-monthsampling period is considered (Table 6) rather than just the12 months chosen for the seasonal analysis. This variabilityin sightings is discussed below.The family Phalacrocacidae (cormorants and shags) wassighted mostly during fall and especially spring; they werenot sighted in the winter. The Gaviidae (loons and divers)were sighted in spring, summer and especially fall; theywere not seen in winter. The Scolopacidae (sandpipers andphalaropes) were sighted only in summer.Sources of VariabilityVariability in seabird sightings occurs seasonally and interannuallywithin the <strong>Stellwagen</strong> <strong>Bank</strong> sanctuary. Comparisonof the predictive modeling results over 1980-1988 (9-yearperiod) at the scale of the GoM with the standardized surveysightings over 1994–1995 (1-year period) at the scale of thesanctuary demonstrates general agreement in seasonal presenceor absence by species for some major groups. Forexample both analyses indicate that razorbills (auks) use thesanctuary more in winter and storm-petrels in summer.However, the predictive modeling indicates that northerngannets are widespread in the sanctuary in winter, especially,and summer, whereas the standardized survey sightingsmade over a shorter time frame indicate that the familySullidae (gannets and boobies) was most prevalent in fallespecially and spring. Anecdotal observations from thesanctuary tend to support the fall-spring pattern as well. Asnoted above, seabirds are far ranging and environmentallyfacile; oceanographic climate and late or early seasonalturnover of sanctuary waters and associated productivitychanges have the potential to influence seabird abundancepatterns within relatively short time frames at the geographicscale of the sanctuary.Standardized survey sightings in the sanctuary demonstratethat the relative abundance of seabird species can vary asmuch within the same month (August) between subsequentyears (1994 and 1995) as between different months (Augustand February) in the same year (1995) (Figure 41). Greatblack-backed gulls accounted for the majority (60.1%) ofthe seabirds recorded in August 1994, while Wilson’s stormpetrelsmade up the majority (76.7%) of the seabird sightingsin August 1995. Likewise, while Wilson’ storm-petrelsmade up 76.7% of the sightings in August (summer) 1995,Fi g u r e 44. De m o n s t r at e d h i g h s e a s o n a l a n d i n t e r-a n n u a l variability in t h e r e l at i v e a b u n d a n c eo f s e a b i r d s p e c i e s f r e q u e n t i n g t h e St e l lwa g e n Ba n k s a n c t u a r y b a s e d o n s ta n d a r d i z e d s u r v e y s i g h t i n g s d at af o r t h e p e r i o d Ju ly 1994–Au g u s t 1995.88<strong>Stellwagen</strong> <strong>Bank</strong> <strong>National</strong> <strong>Marine</strong> <strong>Sanctuary</strong> Draft Management Plan/Environmental Assessment
The Great AukFor 17th century European sailors to New England, the great auk (Figure 45) was a common and welcomed sight,indicating proximity to land. But by the middle of the 19th century the species had disappeared completely andforever (Eckert, 1963). While this once plentiful sea bird cannot return to life, the sad story of its extinction liveson as a stark reminder that humans do and have had a significant and sometimes permanent impact on the marineecosystem of the <strong>Stellwagen</strong> <strong>Bank</strong> sanctuary.The only flightless species of North Atlantic bird, the great auk was a noble animal of great speed and strength in thewater. The largest of the alcids, the great auk was bigger than a goose in size and penguin-like in appearance. Theywere in fact the first birds to be called “penguins” (scientific name: Pinguinus impennis), but their name was changedto great auk after scientists determined that they were not related to the birds of similar appearance in southernlatitudes. One of their closest living relatives today is the razorbill which winters in large numbers in the sanctuary.The great auk was a powerful and graceful swimmer, capable of diving to great depths in search of food. It made anannual migration in vast rafts of individuals swimming along the surface of the sea from summer breeding locationson or near Labrador, Newfoundland and points north and east, to winter feedinggrounds on <strong>Stellwagen</strong> <strong>Bank</strong>, Georges <strong>Bank</strong>, and along the New England andMid-Atlantic <strong>states</strong>. The birds spent most of their lives in the water—visiting landonly to lay one egg per pair each year in massive breeding colonies.But these terrestrial sojourns proved fatal for the great auk. Heavy bodies, smallwings and flightlessness, the very qualities that adapted the great auks so well totheir aquatic environment, coupled with the birds’ tendency to group togetherin large numbers, made the animals easy prey for human visitors to the nestingcolonies. First hunted for use as fish bait and food (fresh meat and eggs andsalted meat for long voyages), the great auk later became economically popularfor its oil and its feathers for fashion and for mattresses. The final chapter ofits existence was closed by collectors searching for specimens for public andprivate museums, but the species was doomed by the time of the inauguration ofPresident George Washington.For generations, sailors and fishermen decimated the flocks, thinking that therewould always be more. Even in the waning hours of the great auk’s existence,scientists claimed there had to be additional stocks in the more northerly areas.We know now that they were very wrong. The naming of the sanctuary’s researchvessel in honor of this icon to local extinction is a constant reminder that thepublic must be ever-vigilant in protecting the <strong>resource</strong>s of the <strong>Stellwagen</strong> <strong>Bank</strong>sanctuary.Fi g u r e 45. Il l u s t r at i o n o ft h e g r e a t a u k.Adapted from painting by JohnJ. Audubon titled “Pinguinusimpennis—Great Auk.”razorbills made up 50.7% of the seabirds recorded in February(winter) that same year.The combined use of predictive modeling and standardizedsurveys allows for the start of a comprehensive assessmentand understanding of the seabird communities in the sanctuary.Results to-date indicate that while it is certain that acharacteristic set of seabird species routinely use the sanctuary,and while there are demonstrated spatial patterns ofseasonal use among the major groups, relative abundanceamong these species varies greatly and seasonal and interannualvariability is high.Pr e s s u r e sHistorically, the main threats to seabirds have been coastaldevelopment, predation by humans and other animals,removal of prey through fisheries activity and pollution ofthe marine environment. Drury (1973, 1974) describes theextensive harvesting of seabirds for food and feather in NewEngland that resulted in extirpation of many seabird specieseven from remote outer islands by the turn of the 20th centu-ry. Great auks (Pinguinus impennis) were once frequentlysighted in the GoM where some populations over-wintered,but were hunted to extinction by 1844. Great auk boneshave been found in Massachusetts (Martha’s Vineyard, EastWareham, Marblehead, Eagle Hill and Plum Island) and atleast ten islands along the Maine coast (Burness and Montevecchi,1992). Refer to the Sidebar for more informationabout the great auk.Interactions between fisheries and seabirds have been welldocumented in many regions worldwide, with both increasesand declines of seabird populations linked to patternsof fishing activity (Tasker et al., 2000; Tasker and Furness,2003; Votier et al., 2004). Intense fishing activity canimpact seabird populations through reduction of prey abundanceand perturbation of prey population and communitystructure (Pauly et al., 1998; Tasker et al., 2000). Food webchanges related to heavy fishing over many years have beenfound to adversely affect seabirds in the GoM (Lotze andMilewski, 2004). In addition, mortality related to entanglementwith fishing gear has been reported.IV. Resource States 89
Based on <strong>NOAA</strong> Fisheries Service fishery observer data for1994–2003, entanglement currently is not considered amajor source of seabird mortality in the GoM or the sanctuary(Soczek, 2006). While occurring at a low rate, this studyfound that 88.6% of the overall observed seabird bycatchin the New England area was in the gillnet fishery, andshearwaters, particularly the greater shearwater, comprised78.6% of all identified seabirds. This species is not currentlyclassified as globally endangered or threatened (BirdLifeInternational, 2004), but the potential for declines in thepopulation have prompted its inclusion in the “ModeratelyAbundant Species with Declines or High Threats” categoryof the American Bird Conservancy’s Green List (AmericanBird Conservancy, 2004) and in the “High Concern” categoryin the North American Waterbird Conservation Plan(Kushlan et al., 2002).Possibly the greatest threat for many seabirds (particularlyterns and auks) in the GoM is from other seabirds, primarilygulls (Drury, 1965). Increases in fishery discards (offal andbycatch) and the spread of open landfills during the mid-1900s led to increased herring gull and great black-backedgull populations. This in turn led to greater pressure onother seabirds, particularly terns, through competition forprime nesting sites and increased predation by gulls on theireggs and chicks (Anderson and Devlin, 1999; Drury, 1965;Platt et al., 1995).Industrial contaminants are also a potential threat to seabirdpopulations (Burger and Gochfeld, 2002). Elevated PCBshave been found in roseate tern chicks at Bird Island(Massachusetts) (Nisbet, 1981) and a wide range of metalshas been found in common terns at breeding colonies inMassachusetts (Bureger et al, 1994). The impact of pollutantson seabirds, including sub-lethal effects, has not beenadequately assessed for the GoM.Analyses of changes in seabird populations in the Bay ofFundy (northern GoM) since European colonization haveshown that approximately 50% of marine and coastal birdspecies have been severely affected by human activity withseveral species extirpated and major colonies abandoned(Lotze and Milewski, 2004). With the exception of the greatauk, re-colonization of abandoned breeding colonies hastaken place for most species, albeit relatively slowly withestimated recolonization time considered to take as long as45 years for the common murre and 133 years for the northerngannet (Lotze and Milewski, 2002).Cu r r e n t Pr o t e c t i o n<strong>Sanctuary</strong> regulations (15 C.F.R § Subpart N) prohibit thetaking of any seabird in or above the sanctuary, except aspermitted by the Migratory Bird Treaty Act, as amended,(MBTA), 16 U.S.C. 703 et seq. or possessing within the sanctuary(regardless of where taken, moved or removed from),except as necessary for valid law enforcement purposes,any seabird taken in violation of the MBTA.In addition where applicable, the MBTA, which implementsconventions with Great Britain, Mexico, Russia and Japan,makes it unlawful except as permitted by regulations “topursue, hunt, take, capture, kill… any migratory bird, anypart, nest or egg” or any product of any such bird protectedby the Convention (16 U.S.C 703).Se a Tu rt l e sSt a t u sGeneral Kn o w l e d g eSea turtles are long-lived species that mature late in lifeand move great distances during their lifetimes, migratinghundreds or even thousands of kilometers between foragingand nesting grounds. They spend their lives at sea but returnto land to reproduce.Sea turtles are generally solitary creatures that remainsubmerged for much of the time they are at sea, whichmakes them extremely difficult to study. They rarely interactwith one another outside of courtship and mating. Adultfemales nest in multiyear cycles, usually 2–4 years. Theycome ashore several times to lay hundreds of eggs during anesting season in tropical waters. After about 50 to 60 daysof incubation, the hatchlings emerge and head for the openocean to begin life as pelagic drifters. This period is oftenreferred to as the “lost years.” In most cases, it is not knownwhere the hatchlings go or how long this period lasts. Whilematuring over the course of several decades, sea turtlesmove in and out of a variety of ocean and coastal habitats.This open ocean existence often frustrates efforts to studyand conserve them. Juvenile survival to adulthood is low.Sea turtles serve important functions in the ecosystems inwhich they are found. For example, seagrass beds wheregreen turtles graze regularly are more productive, nutrientsare cycled more rapidly and the grass blades have higherprotein content, thus benefiting other species. Some populationsof sea turtles, whose feeding areas may be hundredsor even thousands of kilometers from their nesting beaches,serve an important role in nutrient cycling by transportingmassive quantities of nutrients from the nutrient-rich feedinggrounds (in colder waters of the North Atlantic) to typicallymore nutrient-poor coastal and inshore habitats in the vicin-90<strong>Stellwagen</strong> <strong>Bank</strong> <strong>National</strong> <strong>Marine</strong> <strong>Sanctuary</strong> Draft Management Plan/Environmental Assessment
ity of the nesting beaches (in tropicalwaters).Oc c u r r e n c e in t h e Sa n c t ua r ySeven species of sea turtles occurworldwide, four of which have beenrecorded in GoM: Kemp’s ridley, leatherback,loggerhead and green. Onlythe leatherback and Kemp’s ridley areseen with any regularity in the GoM.Leatherbacks and loggerheads have been the species mostcommonly reported in the sanctuary. Two families of seaturtles are represented in the sanctuary: the Dermochelyidaeis represented solely by the unique Dermochelys coriacea(leatherback), which lacks the hard shell that characterizesthe other sea turtles that make-up the family Cheloniidae.Three of the species recorded in the GoM are listed asendangered, and the fourth as threatened, under the ESA(Table 7).Leatherback turtles have been sighted in the vicinity of thesanctuary in the spring and summer, and strandings haveoccurred in Cape Cod Bay spring, summer and fall. Thepredicted seasonality of leatherbacks is in the summer only.Loggerhead turtles have been sighted around the sanctuaryin summer and strandings in Cape Cod Bay have occurredyear-round. The predicted seasonality of loggerheadsaround the sanctuary is in the summer only. There havebeen no sightings of Kemp’s ridley turtles around the sanctuary,though they have stranded in Cape Cod Bay winter,spring and fall. This species is not predicted to occur aroundthe sanctuary throughout the year (Department of Navy,2005; Shoop and Kenney, 1991). For additional informationregarding sea turtle species accounts, visit URL http://www.iucn-mtsg.org/species/Pr e s s u r e sSea turtles are transient visitors to the <strong>Stellwagen</strong> <strong>Bank</strong>sanctuary and there is very little documentation of humanimpacts to turtles in the vicinity of the sanctuary. In general,major threats to sea turtles in the U.S. include, but are notlimited to: destruction and alteration of foraging habitats,incidental capture in commercial and recreational fisheries,entanglement in marine debris and vessel strikes. The <strong>NOAA</strong>Fisheries Service Observer Program documents fishingimpacts to protected species and is the primary source forsuch information. <strong>NOAA</strong> Fisheries Service has not recordedany sea turtles taken in gillnets or otter trawls fished withinthe sanctuary since 1994 (<strong>NOAA</strong> Fisheries Service, unpublisheddata).Sea turtles die from eating or becoming entangled in nondegradabledebris each year, including packing bands,balloons, pellets and plastic bags thrown overboard fromboats or dumped near beaches and swept out to sea. Leatherbacksespecially, cannot distinguish between floatingjellyfish—a main component of their diet—and floatingplastic bags.Ta b l e 7. Co n s e r va t i o n s t a t u s o f s e a t u r t l e s f o u n d in t h e St e l lwa g e n Ba n ks a n c t u a r y a n d GoM r e g i o n .Common Name Scientific Name ESA StatusKemp’s Ridley Lepidochelys kempi EndangeredLeatherback Dermochelys coriacea EndangeredLoggerhead Caretta caretta ThreatenedGreen Chelonia mydas EndangeredTurtles are affected to an unknown, but potentially significantdegree, by entanglement in persistent marine debris,including discarded or lost fishing gear including steel andmonofilament line, synthetic and natural rope, and discardedplastic netting materials. Monofilament line is the principalsource of entanglement for sea turtles in U.S. waters.To effectively address all threats to marine turtles, <strong>NOAA</strong>Fisheries Service and the USFWS have developed recoveryplans to direct research and management efforts for eachsea turtle species. More information on threats to marineturtles is available at: http://www.nmfs.noaa.gov/pr/species/turtles/.Cu r r e n t Pr o t e c t i o n<strong>Sanctuary</strong> regulations (15 C.F.R § Subpart N) prohibit thetaking of any marine reptile in the sanctuary, except aspermitted by the ESA, as amended, 16 U.S.C. 1531 et seq.,or possessing within the sanctuary (regardless of wheretaken, moved or removed from), except as necessary forvalid law enforcement purposes, any marine reptile taken inviolation of the ESA.Sea turtles are given legal protection in the U.S. and itswaters under the ESA, which lists the leatherback, Kemp’sridley and green turtle as endangered; the loggerhead islisted as threatened. This designation makes it illegal toharm, harass or kill any sea turtles, hatchlings or their eggs.It is also illegal to import, sell, or transport turtles or theirproducts. <strong>NOAA</strong> Fisheries Service has jurisdiction over seaturtles in the water; USFWS has jurisdiction over sea turtleswhen they are on land.Presently, all sea turtle species are listed in the InternationalUnion for the Conservation of Nature (IUCN) and NaturalResources Red List as endangered or vulnerable; includedin Appendix I of the Convention on International Trade inEndangered Species (CITES) of Wild Fauna and Flora; and,all species are listed in Appendices I and II of the Conventionon the Conservation of Migratory (CMS) Species of WildAnimals.IV. Resource States 91
St a t u sMa r i n e Ma m m a l s<strong>Marine</strong> mammals are a functional part of the biodiversityof the <strong>Stellwagen</strong> <strong>Bank</strong> sanctuary in a number of importantways, including their interdependence on seafloor and watercolumn habitats and their predator-prey relationship to keyforage species. They are a highly visible component of thespecies mix, which merits special consideration becauseof their charismatic attraction and universally protectedor endangered status. They also are highly attuned to theacoustic environment and might be especially prone toharassment and behavioral disturbance due to human activity.The major issues associated with marine mammals in thesanctuary are distinctly different from the issues otherwiseassociated with biodiversity conservation, such as biomassremoval, changes in food webs and community composition,and disturbance or degradation of seafloor habitatsand landscapes. Instead, marine mammal issues includeentanglement in commercial fishing gear, vessel strikes fromshipping, ocean noise, localized prey depletion, and marinepollution and contamination. However, the interactionswith fishing and shipping are the key mortality factors formarine mammals (<strong>NOAA</strong>, 2007).Of special note, the data set for humpback whales in the<strong>Stellwagen</strong> <strong>Bank</strong> sanctuary is the longest and most detailedstudy of baleen whales in the world. Matrilineal studiesshow evidence of four generations (1975–2006) of humpbackuse of, as well as inter-generational site fidelity to, thesanctuary as a feeding and nursery area. The newly-establishedsister sanctuary relationship between the <strong>Stellwagen</strong><strong>Bank</strong> sanctuary and the Sanctuario de Mamiferos Marinosde la Republica Dominicana (Dominican Republic humpbackwhale sanctuary) is the first conservation managementaction worldwide to protect a migratory marine mammalspecies on both ends of its range (between sanctuary feeding/nurserygrounds and the largest mating/calving groundsfor humpback whales in the North Atlantic) by functionallylinking two important nationally acclaimed marine protectedareas.Ce tac e a n s a n d Pi n n i p e d sThe marine mammal fauna of the <strong>Stellwagen</strong> <strong>Bank</strong> sanctuaryis diverse and has significant ecological, aesthetic andeconomic value. At least 22 species of marine mammals areknown to occur in the waters over and around the sanctuary—sixspecies of baleen whales (Mysticeti), eleven speciesof toothed whales (Odontoceti), and five species of phocidseals (Pinnipedia) (Table 8). For many of these species, thebiological productivity of sanctuary waters provides primaryhabitat for feeding and other critical activities such as nursing.In fact, the sanctuary is one of the most intensively usedcetacean habitats in the northeast continental shelf region ofthe United States (Kenney and Win, 1986).Both cetaceans and pinnipeds are subject to a variety ofhuman-related pressures, ranging from the visible impactsof human activities (e.g., vessel strikes, entanglements infishing gear) to ubiquitous threats such as pollution, boattraffic, and noise. In some instances, the impacts may bedifficult to assess but may be particularly significant, especiallyfor marine mammals that live in coastal areas or anenvironment that brings them into close contact with humanactivities.CetaceansCetaceans are divided between two suborders: the Mysticetes(baleen whales) and the Odontocetes (toothed whales).Representatives of both suborders are found in the sanctuaryand throughout the GoM. Two morphological featuresdistinguish cetaceans: mysticetes have baleen and twoblowholes, and odontocetes have teeth and a single blowhole.Baleen WhalesBaleen whales in the sanctuary range in maximum lengthfrom 6.4 m (26 ft.) for the minke whale to 30 m (100 ft.)for the blue whale. They have evolved baleen, instead ofteeth, to feed upon zooplankton and small schooling fish.The plates of baleen form an efficient filtration system thatseparate prey from vast volumes of water taken into themouth. Baleen whales typically forage throughout the watercolumn, preying on species (such as sand lance, herring andcopepods in the sanctuary) that are found from the surfaceto several hundred feet down. Humpback whales also areknown to feed along the ocean bottom, scouring sand andgravel seafloor habitats that shelter sand lance; other speciesmight also engage in similar behavior.Within the sanctuary, the mysticetes are represented by sixspecies arranged into two families, the Balaenopteridae(rorqual whales) and the Balaenidae (right whales) (Table 8).The Baleanopteridae are characterized by their sleek bodyform, generally, and the “rorqual” pleats on the undersideof the mouth. This family includes the blue, fin, sei, minkeand humpback whale, with the latter being alone in its owngenus. The rorquals are ‘gulpers,’ feeding in discrete events,taking prey a mouthful at a time.92<strong>Stellwagen</strong> <strong>Bank</strong> <strong>National</strong> <strong>Marine</strong> <strong>Sanctuary</strong> Draft Management Plan/Environmental Assessment
Ta b l e 8. Co n s e r va t i o n s t a t u s o f 22 s p e c i e s o f m a r i n e m a m m a l s s i g h t e d in t h e St e l lwa g e n Ba n k s a n c t u a r y.Group Common Name Scientific Name MMPA Status ESA StatusBlue whaleBalaenoptera musculusEndangeredFin or Finback whale Balaeneptera physalus EndangeredBaleen Whales Humpback whale Megaptera novaeangliue Protected under Endangered(Mysticetes n=6) Sei whale Balaenoptera borealis the MMPAEndangeredMinke whaleBalaenoptera acutorostrataNorth Atlantic right whale Eubalaena glacialis EndangeredSperm whalePhyseter macrocephalusEndangeredLong-finned Pilot whale Globicephala melaenaAtlantic White-Sided Dolphin Lagenorhynchus acutusWhite-Beaked Dolphin Lagenorhynchus albirostrisHarbor PorpoisePhocoena sp.Toothed WhalesProtected underBottlenose DolphinTursiops truncatus(Odontocetes n=11)the MMPACommon DolphinDelphinus delphisStriped DolphinStenella coeruleoalbaGrampus (Risso’s) Dolphin Grampus griseusKiller whale or OrcaOrcinus orcaBelugaDelphinus leucasHarbor SealPhoca vitulinaGray SealHalichoerus grypesSealsProtected underHarp SealPagophilus groenlandica(Pinnipeds n=5)the MMPAHooded SealCystophora cristataRinged SealPusa hispidaThe Balaenidae includes the North Atlantic right whale,characterized by its robust body with no dorsal fin, no ventralpleats and very long, narrow baleen. The right whales are“skimmers,” grazing through patches of zoolplankton withtheir mouths open and continuously filtering prey as theyswim. This skimming can be done at the sea surface, alongthe density gradient of mid-depth thermoclines or over theseafloor.Besides the unique filtering system for feeding, most baleenwhales share a number of broad characteristics in common.Most have wide geographic ranges and extensive migrations.They lack any known capability for sonar or echolocation.They often have a mating system in which both males andfemales are promiscuous. Often, they exhibit a relativelyshort period (less than one year) of maternal care with nostrong kinship bonds aside from a mother and her new calf.They have large bodies requiring massive quantities of smallprey. Despite these commonalties, the baleen whales of thesanctuary exhibit many differences. For more information,see species descriptions in Appendix L.Toothed WhalesToothed whales observed in the sanctuary are representedby four families: Delphinidae (dolphins), Phocoenidae(porpoises), the Physeteridae (sperm whales) and Monodontidae(beluga whale). Of the eleven odontocete species thathave been sighted in the sanctuary, common visitors includethe white-sided dolphin, long-finned pilot whale and harborporpoise (Table 8). From giants like the sperm whale to thediminutive harbor porpoise, sightings of odontocete speciesvary from year to year and may demonstrate cyclical orextralimital occurrences in the vicinity of the sanctuary.As a rule, the odontocete diet consists of larger prey than thattaken by the baleen whales. Unlike baleen whales, whichoften engulf large prey patches and ingest thousands or evenmillions of organisms at once, toothed whales usually feedby taking one item (such as a single fish) at a time. Theyoften swallow their prey whole, and their teeth function togrip rather than to chew.Unlike the baleen whales, the odontocetes usually do notmake long annual migrations. Their seasonal responsestend to be onshore-offshore movements. Toothed whalesare highly social animals, moving around in groups calledpods. Different species and different populations within aspecies may vary in how these pods are organized. Somepods may be stable relationships between individuals overlong periods of time; other pods may represent seasonalassociations surrounding feeding or reproduction. For moreinformation, see species descriptions in Appendix L.PinnipedsTrue seals, or phocids, comprise one of three major familiesof pinnipeds (i.e., seals, sea lions and walrus). The term“pinniped” means “wing- or fin-footed” and refers to thefamily’s modified front and hind appendages, which havea fin-like appearance. Members of the family Phocidae,called true or earless seals because they lack external earIV. Resource States 93
flaps, are represented by five species in the sanctuary (Table8). Of the five seal species found with any frequency in the<strong>Stellwagen</strong> <strong>Bank</strong> sanctuary, two (harp, hooded) are foundonly sporadically. The ringed seal is rare while gray andharbor seals can be found year-round, albeit generally insingle sightings. Each species uses the sanctuary and nearbycoast in different ways, but they do share many characteristics.Like toothed whales, pinnipeds have a broad dietincluding a wide variety of fishes, squid and other prey. Formore information, see species descriptions in Appendix L.Ce tac e a n Ha b i tatThe southern GoM, particularly the area of the Great SouthChannel, <strong>Stellwagen</strong> <strong>Bank</strong> and Jeffreys Ledge, supports thehighest densities of baleen whales on the northeast U.S.continental shelf (Kenny and Winn, 1986). Additionally,critical habitat designation was established for the NorthAtlantic right whale in 1994 inclusive of the southwesternportion of the <strong>Stellwagen</strong> <strong>Bank</strong> sanctuary and Cape CodBay. The GoM (which includes sanctuary waters) is recognizedas one of five geographically distinct feeding groundsfor aggregations of endangered humpback whales in thewestern North Atlantic (Katona and Beard, 1990).Cetaceans are capable of traveling large distances relativelyrapidly, but also show distinctive site fidelity to specificfeeding grounds and calving areas. Humpback, fin and rightwhales exhibit strong maternal fidelity to specific feedinggrounds in the southern GoM (Clapham and Seipt, 1991).Weinrich found that individual humpback whales whichvisit <strong>Stellwagen</strong> <strong>Bank</strong> and Jeffreys Ledge as calves are morelikely to return in subsequent years (Weinrich, 1998).Hotspot for Prey AbundanceSand lance are common in the GoM and prefer shallowareas of sandy bottom or fine gravel (such as <strong>Stellwagen</strong><strong>Bank</strong>) for burrowing and spawning (Robards et al., 1999).Herring use the seafloor for spawning (Stevenson and Scott,2005). Sand lance and herring represent a vital link in thearea’s ecology, serving as a major food source for a varietyof piscivorous species including invertebrates, many otherfishes, numerous seabirds and a dozen species of marinemammals (Robards et al., 1999; Stevenson and Scott, 2005).Within the <strong>Stellwagen</strong> <strong>Bank</strong> sanctuary, sand lance is a notedfood source for humpback whales (Hain et al., 1995; Overholtzand Nicolas, 1979; Baraff et al 1991; Weinrich et al.,1997; Weinrich et al., 2000).Sand lance occur within the <strong>Stellwagen</strong> <strong>Bank</strong> sanctuary athigher levels of abundance than in any other area of thesouthern GoM (Figure 46). The figure also depicts the higherherring abundance that occurs in waters from just north ofCape Ann south to Cape Cod Bay, including the sanctuary,relative to other parts of the southern GoM. Sand lancedistribution shows close association with sand and gravellysand habitats, while herring distribution does not (Figure46).The distribution and abundance of North Atlantic rightwhales are closely linked to the life history and spatialdistribution of its main prey, the calanoid copepod Calanusfinmarchiscus. Calanus early life stages coincide with thespring phytoplankton blooms on which they feed, particularlyin Massachusetts and Cape Cod Bays, in waters overlappingor adjacent to the <strong>Stellwagen</strong> <strong>Bank</strong> sanctuary. Thisspecies of copepod also is prey for the sand lance, which inturn is important as prey for piscivorous baleen whales, asnoted above.Comparison of the spatial patterns of North Atlantic rightwhale abundance and Calanus abundance (all life stagescombined) for both the spring and summer season showsa clear geographic shift in whale abundance that broadlytracks Calanus abundance hotspots (Figure 47). In spring(lower panel), these hotspots were located along the northernslope of Georges <strong>Bank</strong>, the Great South Channel, CapeCod Bay and the western portion of the <strong>Stellwagen</strong> <strong>Bank</strong>sanctuary. In summer (upper panel), Calanus hotspots shiftedoffshore towards the central, southern GoM.The margins of <strong>Stellwagen</strong> <strong>Bank</strong> are sites of high horizontaland vertical movement of both water and plankton duelargely to the bank’s exposure to GoM water circulation(Flagg, 1987). The interaction between physical oceanographyand bathymetry creates environmental conditionsthat result in the aggregations of large numbers of planktivorousfishes, such as sand lance and Atlantic herring,which are key prey for humpback, fin and minke whales,as well as dolphins and porpoises. These same environmentalconditions support an abundance of Calanus whichare the primary prey of right whales. These environmentalvariables interact to establish the sanctuary as a hotspot forprey abundance.Predictors of Cetacean Relative AbundancePredictive modeling to explain patterns of cetacean relativeabundance, based on sightings-per-unit-effort (SPUE) andon environmental data including bathymetry, substratumtype, potential prey and oceanography, was used to explainspatial patterns of cetacean densities in the southern GoMfor the period 1997–2005 (Pittman et al., 2006). Analysisof the SPUE data was based on 34,589 cetacean observations.Model results were reported for spring and summer,which were least variable because the modeling techniquesperformed best for seasons with the highest cetacean abundance.Prey availability or habitat indicators of prey availabilitywere important predictors of distribution and density forimportant cetacean species which frequent the sanctuary.Sand lance abundance was a contributing factor in everycase. Significant predictors of abundance for humpback, finand minke whales in all cases included proximity to the100 m isobath, sand and gravely sand, and mean (average)sand lance abundance. The 100 m isobath is the generallower depth limit of sand lance distribution and sand andgravely sand is preferred habitat for sand lance (Meyer et al.,1979). Zooplankton abundance (all species combined) andabundance of the calanoid copepod Calanus finmarchiscus,were among the most significant predictors for the North94<strong>Stellwagen</strong> <strong>Bank</strong> <strong>National</strong> <strong>Marine</strong> <strong>Sanctuary</strong> Draft Management Plan/Environmental Assessment
Fi g u r e 46. Spat i a l distribution a n d d e n s i t y o f k e y p r e ys p e c i e s f o r p i s c i v o r o u s c e ta c e a n s in t h e St e l lwa g e nBa n k s a n c t u a r y a n d t h e s o u t h e r n GoM.Sand lance abundance is indicated in the top panel; herringabundance is indicated in the bottom panel. The spatialextent of sand and gravelly sand habitats is denoted in bothpanels. Data are from the NMFS Northeast Fisheries ScienceCenter research trawl surveys for the period 1975-2000. Figureexcerpted from Pittman et al., 2006.Fi g u r e 47. Ov e r l ay o f s pat i a l distribution o f No r t hAt l a n t i c r i g h t w h a l e r e l at i v e a b u n d a n c e (s i g h t i n g s-p e r-u n i t effort: SPUE) o n s pat i a l distribution o f Ca l a n u sc o p e p o d s f o r t h e St e l lwa g e n Ba n k s a n c t u a r y a n d t h es o u t h e r n GoM.Circles represent right whale SPUE; color shading representsdensity of copepods. Lower panel indicates spring seasonconditions; upper panel indicates summer season conditions.North Atlantic right whale SPUE data are for 1978-2005; copepoddata are for 1977-1988. Figure excerpted from Pittman etal., 2006.IV. Resource States 95
Atlantic right whale abundance. Other significant predictorsof right whale abundance included sand and gravelysand, and mean sand lance abundance. The combinedabundance of sand lance, hake, mackerel and herring wereamong the significant predictors for Atlantic white-sideddolphin abundance.Results of the predictive modeling also found that the 100m isobath was a hotspot for herring, suggesting that humpbackand fin whales may switch prey depending on localavailability. Prey switching by these species has been notedbetween seasons (Macleod et al., 2004) and inter-annually(Payne et al., 1986; Weinrich et al., 1997). In winter, therewas a shift in the SPUE for humpback and fin whales from<strong>Stellwagen</strong> <strong>Bank</strong> to deeper waters over Tillies Basin andJeffreys Ledge, both areas in or overlapping with the sanctuaryand associated with abundant herring (Pittman et al.,2006). This winter shift may result from decreased availabilityof sand lance prior to their spawning and decreasedaccessibility because sand lance spend more time buried inthe sand during winter. A geographically similar but longerterm shift from <strong>Stellwagen</strong> <strong>Bank</strong> to Jeffreys Ledge, and switchfrom sand lance to herring prey, was reported for humpbackwhales between 1988 and 1994 (Weinrich et al., 1997).Ce tac e a n Oc c u r r e n c eSouthern Gulf of MaineUsing the SPUE database for 1997-2005, Pittman et al.(2006) calculated the occurrence and relative abundance ofcetaceans within the southern GoM. Among baleen whales,the <strong>Stellwagen</strong> <strong>Bank</strong> sanctuary was used most heavily byhumpback and fin whales and to a lesser degree by minkewhales, all of which are piscivorous and feed on sand lanceand herring in the sanctuary (Figure 48a). North Atlanticright whales and sei whales, both of which feed primarilyon plankton, also used the sanctuary although occurrencewas higher for right whales (Figure 48b). The occurrence oftoothed whales in the sanctuary was highest among Atlanticwhite-sided dolphins, but included pilot whales as well(Figure 48b).A comparison of the spatial distribution patterns for all baleenwhales and all dolphins and porpoises in the southern GoMshowed that both groups have very similar spatial patternsof high- and low-use areas (Figures 49 and 50). The baleenwhales, whether piscivorous or planktivorous, were moreconcentrated than the dolphins and porpoise. They utilizeda corridor that extended broadly along the steeply slopingedges in the southern GoM, indicated broadly by the 100 misobath. The <strong>Stellwagen</strong> <strong>Bank</strong> sanctuary supported a highabundance of cetaceans throughout the year. The waters onand around the sanctuary also support high cetacean richness(number of species) (Pittman et al., 2006).<strong>Stellwagen</strong> <strong>Bank</strong> <strong>Sanctuary</strong>Direct knowledge of the relative occurrence and spatial/temporal distribution of cetaceans in the <strong>Stellwagen</strong> <strong>Bank</strong>sanctuary was derived from two sources: non-standardizeddata collected aboard whale watching vessels and standardizedsurveys conducted by the sanctuary. Whale watchsightings data were provided by the Provincetown Centerfor Coastal Studies and the Whale Center of New England.Whale watching trips targeted high use areas where companiesexpected to see the largest number of whales, particularlyhumpbacks. The database is robust in that it consistsof multiple daily trips occurring from April through October,has been continuous over 25 years (1979–2004), andconsists of over 255,000 sightings of animals. However,effort is not equally distributed throughout the sanctuary.Standardized surveys of the entire sanctuary for a 12-monthperiod were conducted from July 2001–June 2002 (Wiley etal., 2003). This survey provided equal effort in all parts ofthe sanctuary, but was of a limited time span (one year) andsample size (528 sightings of 2,124 animals). Use of bothdatabases provides a richer understanding of the relativeoccurrence and spatial/temporal distribution of cetaceansin the sanctuary. Relative use of the sanctuary by speciesand seasonal trends were based only on the 12-month standardizedsurvey data.Among baleen whales, the <strong>Stellwagen</strong> <strong>Bank</strong> sanctuarywas used most heavily by humpback whales, followed byminke, fin and right whales (Figure 51). Among humpbackwhales, Robbins (2007) determined that the sanctuary ispreferentially used by juveniles (nursing) and reproductivelymature/active (pregnant and lactating) females. The occurrenceof toothed whales in the sanctuary was highest forwhite-sided dolphins, followed by harbor porpoise and pilotwhales (Figure 52). In general, the sanctuary was dominatedby baleen whales during the summer period and toothedwhales during the winter (Figure 53).A comparison of both databases revealed similar patterns ofspatial distribution and density (Figure 54). Baleen whales inparticular tended to cluster on the northwest and southwestportions of <strong>Stellwagen</strong> <strong>Bank</strong> with a secondary cluster on thesoutheast section of the <strong>Bank</strong>. A three-dimensional visualizationof the spatial distribution of these whales over 25years further illustrates this finding (Figure 55). A commonfeature of each of these areas of high use is a substratedominated by sand and gravelly sand, seafloor habitat typeswhich support concentrations of sand lance. Standardizedsurvey data revealed an additional high use area on thesouthern portion of Jeffreys Ledge (Figure 54).Hu m p b a c k Wh a l e Fo r ag i n g Be h av i o rThe <strong>Stellwagen</strong> <strong>Bank</strong> sanctuary is leading a multi-institutionaltagging project investigating the underwater foragingbehavior of humpback whales to understand how they usehabitat and interact with fishing gear and shipping. Taggedwhales carry a computerized package developed at theWoods Hole Oceanographic Institution (WHOI) that continuouslyrecords pitch, role, heading and depth (Johnson andTyack, 2003). Tag-derived data are mapped in four dimensionsusing GeoZui4D software, allowing scientists to createvirtual whales that move like the tagged animals. GeoZui4Dis a software application developed at the University of NewHampshire (UNH) for interacting with time-varying geospa-96<strong>Stellwagen</strong> <strong>Bank</strong> <strong>National</strong> <strong>Marine</strong> <strong>Sanctuary</strong> Draft Management Plan/Environmental Assessment
Fi g u r e 48a. Spat i a l distribution a n d r e l at i v e a b u n d a n c e o f k e y c e ta c e a n s p e c i e s in t h e St e l lwa g e n Ba n k s a n c t u a r y a n dt h e s o u t h e r n GoM b a s e d o n i n t e r p o l at i o n o f SPUE f o r t h e p e r i o d 1970–2005.Data are aggregated for all seasons. Species depicted include the humpback whale, fin whale, minke whale, North Atlantic rightwhale, sei whale, Atlantic white-sided dolphin and pilot whale. Figure adapted from Pittman et al., 2006.IV. Resource States 97
Fi g u r e 48b. Spat i a l distribution a n d r e l at i v e a b u n d a n c e o f k e y c e ta c e a n s p e c i e s in t h e St e l lwa g e n Ba n k s a n c t u a r y a n dt h e s o u t h e r n GoM b a s e d o n i n t e r p o l at i o n o f SPUE f o r t h e p e r i o d 1970–2005.Data are aggregated for all seasons. Species depicted include the humpback whale, fin whale, minke whale, North Atlantic rightwhale, sei whale, Atlantic white-sided dolphin and pilot whale. Figure adapted from Pittman et al., 2006.98<strong>Stellwagen</strong> <strong>Bank</strong> <strong>National</strong> <strong>Marine</strong> <strong>Sanctuary</strong> Draft Management Plan/Environmental Assessment
Fi g u r e 49. Se a s o n a l pat t e r n s o f i n t e r p o l at e d SPUE d at a f o r a l l b a l e e n w h a l e s p e c i e s in s p r i n g, s u m m e r , fa l l a n dw i n t e r a n d a l l seasons c o m b i n e d f o r t h e St e l lwa g e n Ba n k s a n c t u a r y a n d t h e s o u t h e r n GoM (1970–2005).Figure excerpted from Pittman et al., 2006.IV. Resource States 99
Fi g u r e 50. Se a s o n a l pat t e r n s o f i n t e r p o l at e d SPUE d at a f o r a l l d o l p h i n s a n d p o r p o i s e s in s p r i n g, s u m m e r , fa l l,w i n t e r a n d a l l seasons c o m b i n e d f o r t h e St e l lwa g e n Ba n k s a n c t u a r y a n d t h e s o u t h e r n GoM (1970–2005).Figure excerpted from Pittman et al., 2006.100<strong>Stellwagen</strong> <strong>Bank</strong> <strong>National</strong> <strong>Marine</strong> <strong>Sanctuary</strong> Draft Management Plan/Environmental Assessment
Fi g u r e 51. Re l at i v e o c c u r r e n c e o f fin, h u m p b a c k , m i n k ea n d r i g h t w h a l e s in t h e St e l lwa g e n Ba n k s a n c t u a r y.Data are based on standardized surveys from July 2001–June2002 (303 sightings of 361 animals). Adapted from Wiley etal., (2003).Fi g u r e 52. Re l at i v e o c c u r r e n c e o f h a r b o r p o r p o i s e ,w h i t e -s i d e d d o l p h i n s a n d p i l o t w h a l e s in t h e St e l lwa g e nBa n k s a n c t u a r y.Data are based on standardized surveys from July 2001–June2002 (162 sightings of 1,708 animals). Adapted from Wiley etal., (2003).Fi g u r e 53. Fr e q u e n c y o f Ce ta c e a n Si g h t i n g s within St e l lwa g e n Ba n k s a n c t u a r y b y m o n t h . Dat a a r e f r o m s ta n d a r d i z e ds u rv e y s f r o m Ju ly 2001–Ju n e 2002.Adapted from Wiley et al., (2003).IV. Resource States 101
Fi g u r e 54. Co m p a r i s o n o f t h e s pat i a l distribution o f b a l e e n w h a l e s within t h e St e l lwa g e n Ba n k s a n c t u a r y f r o mw h a l e w a t c h a n d s ta n d a r d i z e d s u r v e y d at a.Whale watch data (a.) are non-standardized observations made during April through October from 1979-2004 (n = ~255,000).Survey data (b.) are based on standardized surveys from July 2001–June 2002 and include animals not identified to species (352sightings of 413 animals). Survey data are adapted from Wiley et al., 2003. Whale watch data were collected by the ProvincetownCenter for Coastal Studies and the Whale Center of New England. The two illustrations are Kriged density plots of information fromboth data sets using a 5,000 m search radius analyzed by ESRI ARCGIS.tial data (Ware et al., 2006), such as that provided by thewhale tags. Tag data were also viewed in TrackPlot (Ware etal., 2006; Wiley et al., 2005) to provide a static 3-D representationof spatial patterns in whale movement.Figure 56 illustrates behavior that is typical of the high interrelateduse of both seafloor and water column habitats byhumpback whales feeding in the sanctuary based on thetagging results of 15 individuals in July of 2006. Sand lanceprey fields were simultaneously mapped acoustically inareas adjacent and parallel to the whale tracks, confirmingtheir presence in large numbers (Figure 57). Acoustics offera minimally invasive technique for collecting continuousalong-track data on biomass at fine horizontal and verticalspatial scales throughout the water column (Simmonds andMacLennan, 2005). The whale tracks were mapped over thesanctuary’s seafloor multi-beam sonar image, which indicatedthat the whales were feeding over sand and sandy gravelwhich is sand lance habitat. More extensive treatment ofthis research is provided in Friedlaender et al. and Hazen etal. (both in review).The depth versus time series recorded for the subject whaleshows how and when it uses the water column, demonstratingpronounced shifts in lengthy bouts of repeateddives (Figure 56). During hours of daylight, dusk and earlyevening (1400 hr to 2100 hr) the whale spent its time inan alternating series of frequent short duration dives tothe seafloor followed by extensive time spent in the upperwater column and at the surface. During the ensuing hoursof darkness and pre-dawn (2120 hr to 0440 hr) the whalespent its time in long duration dives to the seafloor. Bouts ofpredominantly near-surface activity resumed with the returnof daylight. These findings of diurnal foraging patterns aregenerally supportive of those of Goodyear (1989), who alsoconducted tagging studies of feeding humpback whaleson <strong>Stellwagen</strong> <strong>Bank</strong> during times of high sand lance abundance.Sand lance make daytime migrations into the watercolumn where they form schools and feed, returning to theseafloor at night (Casey and Myers, 1998), a behavior thatcorresponds to the whale’s diel (24-hr period) use of thesehabitats.Two types of foraging behavior were characteristic of howthe whales differentially used water column and seafloorhabitats. During the “daylight” sequence, whales engagedin repeated bubble-net feeding in which individual or102<strong>Stellwagen</strong> <strong>Bank</strong> <strong>National</strong> <strong>Marine</strong> <strong>Sanctuary</strong> Draft Management Plan/Environmental Assessment
Fi g u r e 55. A t h r e e-d i m e n s i o n a l visualization o f t h e s pat i a l distribution o f b a l e e n w h a l e s within t h e St e l lwa g e nBa n k s a n c t u a r y (1979–2004).Data are non-standardized observations from whale watching vessels operating from April through October (n = ~255,000) andcollected by the Provincetown Center for Coastal Studies and the Whale Center of New England.multiple animals exhale, encircle and corral sand lance inthe water column. By diving below the level of schoolingsand lance, the whales presumably can better detect theirprey contrasted and profiled against the sky. During the“darkness” sequence, whales engaged in repeated bouts ofbottom feeding where they turn on their side to scour thesandy bottom while feeding on sand lance burrowed in theseafloor. Each of these characteristic behaviors is illustratedin Figure 56.Results from Friedlaender et al. (in review) suggest thatsurface feeding activities in humpback whales are basedprimarily on visual prey detection and secondarily on thepresence of prey over a certain threshold level in the watercolumn. Hazen et al. (in review), in fact, show that humpbackwhales on <strong>Stellwagen</strong> <strong>Bank</strong> maximize their foragingefficiency when surface feeding by preferentially targetingdense, vertically oriented patches of sand lance. Hazen etal. found that whale surface feeding was significantly affectedby prey school shape. Surface feeding occurred moreoften around prey schools with a large area, taller height,and shorter length. Longer schools were often associatedwith a thin layer (less than 2.5m tall) in the water column,potentially more difficult or less cost-effective to consume.Sand lance schools reached up to 4km in length and verticalthickness up to 30m. Examples of such schools are shownmapped in Figure 57. This visualization of actual datadepicts the linear transect through a series of prey patchesin the sanctuary and provides a 2-dimensional portrayal of3-dimensional prey aggregations (i.e. length, width, verticalthickness). Because the spatial characteristics of prey fieldsis an important determinant of the optimality of humpbackwhale foraging, maintenance of prey patch integrity needsto be considered in sanctuary management.Co n s e r vat i o n Stat u sAll marine mammal species are protected under the MMPA;five baleen whale species frequenting the <strong>Stellwagen</strong> <strong>Bank</strong>sanctuary are listed as endangered under the ESA (i.e., blue,fin, humpback, sei and North Atlantic right whale) (Table8). The North Atlantic right whale population continues tobe depleted (<strong>NOAA</strong>, 2006); the best estimate of the size ofthe population is 300 to 350 animals. Earlier models indicatedthat this population was likely declining rather thanremaining static or increasing (Caswell et al., 1999). Morerecent models that estimate survival rate from re-sightingsdata collected during 1980-2004 indicate that the medianpopulation growth rate is about 1% (Pace et al., 2007).However, the models also revealed that this population hasalmost no capacity to absorb additional mortality. Becausethe primary causes of premature mortality among rightwhales are anthropogenic, mainly ship strikes and fishinggear entanglements, recovery of the right whale populationis contingent upon reducing the effects of these activities onthe species (Pace et al., 2007).IV. Resource States 103
Fi g u r e 56. A t i m e /d e p t h p l o t o f t h e diving b e h av i o r o f a t a g g e d h u m p b a c k w h a l e in t h e St e l lwa g e n Ba n k s a n c t u a r yo v e r a 15-h o u r p e r i o d in Ju ly o f 2006.The animal used complex spiral bubble maneuvers in the water column to corral fish (presumed sand lance) during daylight andexhibited bottom side-roll behavior at night. Ribbon tracks used to visualize behavior were created using TrackPlot (Ware et al.,2006). Data are from Wiley et al. (unpublished).Pr e s s u r e sHabitat loss, habitat degradation and competition for preyare recognized as key threats to cetaceans worldwide(Reeves et al., 2003). Known or potential threats to thesurvival of marine mammals are due to the increasing pressuresof human activity in and around the sanctuary and themarine mammals’ dependence on <strong>resource</strong>s that are alsoused intensively by humans. <strong>Marine</strong> mammals are vulnerableto disturbances caused by ship noise, industrial activityand other acoustic inputs to the marine environment,collisions with powered vessels and entanglements withfishing gear. Other types of human activities (e.g., waterpollution) occur that may influence living <strong>resource</strong> quality(e.g., reduced availability of prey). High levels of chemicalcontaminants in the tissues of cetaceans may be affectingthe animals’ immune and reproductive systems (Reeves,2003).There are undoubtedly more threats than are presentlyrecognized, and even the most basic information on cetaceanmortality caused by human activity is limited due tofunding restraints, under-reporting and the lack of directedscientific effort. Moreover, the total impact of the variousthreats cannot be predicted by simply summing theireffects as though they were independent. For example, theimmunosuppressive effects of environmental contaminants(Lahvis et al., 1995) with range shifts of pathogens causedby global warming and ship ballast transport (Harvell etal., 1999) could increase the susceptibility of cetaceans toemergent diseases. While research is underway to betteridentify emerging threats, cautionary measures should betaken to moderate or eliminate the relevant and acknowledgedanthropogenic input factors (Reeves, 2003).Be h av i o r a l Di s t u r b a n c eThere are numerous ways in which marine mammals aredisturbed or potentially disturbed by human activitieswithin or around the <strong>Stellwagen</strong> <strong>Bank</strong> sanctuary. Theseinclude activities associated with vessels, aircraft flying overthe sanctuary, fishing activities and underwater noise fromthe high number of vessels passing through and nearby thesanctuary.104<strong>Stellwagen</strong> <strong>Bank</strong> <strong>National</strong> <strong>Marine</strong> <strong>Sanctuary</strong> Draft Management Plan/Environmental Assessment
Fi g u r e 57. Visualization s h o w i n g t h e <strong>NOAA</strong> Sh i p Na n c y Fo s t e r a c o u s t i c a l ly m a p p i n g s a n d l a n c e p r e y f i e l d s in t h eSt e l lwa g e n Ba n k s a n c t u a r y.The horizontal band is the zone of cavitation caused by the ship’s propellers and is an artifact. Prey fields are evident below thiszone: yellow = higher density; red = lower density. Visualization portrays actual data. Image: UNH/SBNMS.Whale WatchingTwelve commercial whale-watch companies operate regularlyscheduled trips on as many as 22 vessels that makemultiple trips daily to the sanctuary, from April throughOctober, out of six Massachusetts ports. A sampling of tracksfrom whale watch vessels representing all companies and allports were recorded in 2003 during whale watch trips to thesanctuary and adjoining areas (Figure 58). With the exceptionof vessels departing from Newburyport, the northernmostport depicted, virtually all whale watching trips weremade to the sanctuary and almost all of these were madeto northern and southern <strong>Stellwagen</strong> <strong>Bank</strong>, where whaleshistorically are most abundant (Figures 54 and 55). Morethan one million people visit the sanctuary yearly aboardthese platforms (Hoyt, 2001).There is growing awareness, however, that cetacean tourismcan have a downside (Corkeron, 2004). Intensive, persistentand unregulated vessel traffic that focuses on animalswhile they are resting, feeding nursing their young or socializingcan disrupt those activities, and possibly cause shortand long-term problems for targeted populations. Impactstudies worldwide have shown changes in ventilation rate(Baker, 1988), avoidance behavior (Donovan, 1986) andchanges in habitat use (Corkeron, 1995). The concerns arefurther compounded by the increase in popularity of whalewatching, not just on commercial vessels, but also privatelyownedrecreational vessels. In both cases, instances occurwhere numerous boats surround a single whale or group ofwhales, disturbing the animals and at the same time detractingfrom the quality of the tourist experience.Working with the whale watching industry and non-profitconservation organizations, <strong>NOAA</strong> established voluntarywhale watch guidelines in the Northeast region in 1999following a sharp increase in whale watch vessel speedsand collisions with three whales, at least one of which wasfatal (Weinrich, 2005). These guidelines (operational procedures)were first developed in 1984 by an ad hoc committeeof whale watch naturalists, captains and scientists (Beachand Weinrich, 1989). The intent of the guidelines is to avoidharassment and possible injury or death to large whales byboth commercial and recreational vessels. While the guidelinesare voluntary and difficult to enforce, <strong>NOAA</strong> Officeof Law Enforcement enforces the intent of the guidelinesthrough the take and harassment provisions of the ESA andMMPA.One important aspect of the whale watch guidelines isa series of recommended vessel speeds within variousdistances from the whales: less than or equal to 13 knots ata 1–2 nm distance to whales (zone 3); less than or equal to10 knots at a 1–0.5 nm distance to whales (zone 2); and lessthan or equal to 7 knots within 0.5 nm distance to whales(zone 1). Details of the approach guidelines can be foundat the following web address: http://www.nero.noaa.gov/shipstrike/info/guidetxt.htm or Appendix M). The industryconsiders these guidelines to be more stringent thanapproach guidelines/regulations in other regions, whereIV. Resource States 105
Fi g u r e 58. GPS t r a c k s o f 36 c o m m e r c i a l w h a l ew a t c h i n g t r i p s f r o m six m a j o r w h a l e w a t c h i n g p o r t sin Massachusetts t h a t w e r e m o n i t o r e d b y o n b o a r do b s e r v e r s d u r i n g t h e s u m m e r a n d fa l l o f 2003.Vessels were from the 12 major companies that operate regularschedules and each company was monitored approximatelythree times.high degree of non-compliance and the magnitude by whichthe recommended speeds in each zone were exceeded indicatethat the guidelines cannot be relied upon as a voluntarymeasure to reduce the risk of behavioral disturbance orvessel strike to whales in the sanctuary and that regulationshould be considered. Such regulation would be alignedwith <strong>NOAA</strong>’s Ship Strike Reduction Program. The MMBDAP proposes several strategies that address this issue (AP:MMBD 1.1).Ocean NoiseThere is growing evidence that noise in the ocean hasincreased dramatically over the past 50 years (Andrew et al.,2002; MacDonald et al., 2006). As the primary source oflow frequency ocean noise is commercial shipping (Wenz,1962), noise is expected to increase most dramatically inareas experiencing increased commercial shipping suchas access-ways for growing ports. Although pre-industrialambient noise estimates are not available for the <strong>Stellwagen</strong><strong>Bank</strong> sanctuary, growth in the Port of Boston continues tobe accompanied by increases in large vessel traffic transitingthe sanctuary.Increasing ocean noise is of concern given growing evidencethat some underwater sound sources can negatively impactsensitive marine species (NRC, 2003). For example, somemarine mammal populations have been documented torespond to sources by altering their breathing rates, spendingmore time underwater before coming up for air, changingthe depths or speeds of their dives, shielding their young,changing their song note durations and/or swimming awayfrom the affected area (Richardson et al., 1995; NRC, 2005).In addition, high intensity underwater sounds can causetemporary or permanent hearing loss in marine mammals,which in a few cases has been associated with animalsdistance restrictions exist but no speed restrictions havebeen established. The industry has used these guidelinesto argue against the need for additional restrictions such asspeed regulations in the sanctuary. A recent study conductedin the sanctuary indicates that compliance with the speedportion of the guidelines by the commercial whale watchfleet was extremely low and that speed exceedances wereexcessively high (Wiley et al., in press).Observations in this study were made on 46 commercialwhale watching trips in 2003 and 2004 that occurred in andaround the sanctuary; all of the principal whale watchingcompanies were represented. Results indicate that whalewatching vessels often ignored speed zone guidelines andthe degree of non-compliance increased as distance fromthe whale(s) increased (Table 9). The overall level of noncompliancebased on distance traveled by the whale watchvessels (data from all speed zones combined) was 78%.The maximum vessel speed recorded in zone 1 (where thelevel of non-compliance was lowest and boats were closestto whales) differed little from the maximum vessel speedrecorded for the entire whale watch trip (Figure 55). TheTa b l e 9. Th e l e v e l o f n o n -c o m p l i a n c e w i t h t h e s p e e dp o r t i o n o f t h e <strong>NOAA</strong> w h a l e w a t c h i n g g u i d e l i n e s b a s e do n t h e m o n i t o r i n g o f 46 c o m m e r c i a l w h a l e w a t c h i n gt r i p s o p e r at i n g in a n d a r o u n d t h e St e l lwa g e n Ba n ks a n c t u a r y d u r i n g 2003–2004.GPS receivers onboard each vessel provided information onthe vessel’s track and speed. Non-compliance was registeredwhen a vessel’s speed exceeded that specified by the guidelines.For each speed zone, a vessel’s non-compliant level wascalculated by comparing the distance the vessel traveled outof compliance to the total distance traveled in that zone. Theindustry’s non-compliant level was calculated by summing thetotal non-compliant distances for all vessels traveling in a zoneand comparing that to the total distance traveled by all vesselsin that zone.ZoneNumberSuggestedSpeed(Knots)IndustryNon-compliantLevel (%)Non-CompliantRange for AllTrips (%)1 ≤ 7 62 33–842 ≤ 10 93 67–1003 ≤ 13 92 61–100Overall 78 33–100(≤) less than or equal to106<strong>Stellwagen</strong> <strong>Bank</strong> <strong>National</strong> <strong>Marine</strong> <strong>Sanctuary</strong> Draft Management Plan/Environmental Assessment
Fi g u r e 59. Co m p a r i s o n o f a v e s s e l’s m a x i m u m r e c o r d e d t r i p s p e e d a n d i t s m a x i m u m r e c o r d e d z o n e 1 s p e e d f o r 46c o m m e r c i a l w h a l e w a t c h i n g t r i p s r e p r e s e n t i n g 12 c o m p a n i e s o p e r at i n g in a n d a r o u n d t h e St e l lwa g e n Sa n c t u a r y in2003 a n d 2004.In general, all vessels attained speeds well above the 7 knots (horizontal black line in figure) specified by the guidelines for zone1 and reached near maximum trip speeds in zone 1. This indicates that operators were not following speed guidelines meantto safeguard whales. Speed data were derived from GPS devices and collected by unannounced and inconspicuous observers.Speed zones around whales were identified by those observers using military grade binoculars with a digital compass and laserrangefinder to position whales. ESRI ARCGIS was used to create speed zones around the whales for purposes of calculation.becoming disoriented and stranding (NRC, 2005). Finally,but perhaps most importantly for the sanctuary, increasingocean noise may “mask” signals produced by acousticallyactivemarine animals to communicate with conspecifics(NRC, 2003). Such masking would decrease the distanceover which signals could be received by conspecifics, thuslimiting their utility as reproductive, feeding and/or navigationbehaviors. Although there has been much less researchon the impacts of noise on non-mammalian marine animals,many fish and marine invertebrates also utilize sound tocommunicate.Given the importance of sanctuary waters to several vocally-activeand endangered marine mammals (e.g., humpback,fin, sei and North Atlantic right whales), conductingresearch and developing a policy framework to minimizehuman-induced underwater noise is a cautionary guidingprinciple in the DMP (AP: MMBD.2))Tuna FishingTuna fishing consists of a variety of gear types and methodsincluding harpoon, hook and line (trolling or anchoredchumming) and purse seine. The target species is principallybluefin tuna, which is often attracted to the sameforage base (sand lance and Atlantic herring) as piscivorousmarine mammals such as endangered humpback and finwhales, minke whales and dolphins and porpoise. To helpfind tuna, fishermen often search directly for the prey andsometimes use surface feeding whales and birds as indicatorsof tuna availability and location. Indirectly, commercialwhale watch boats are used as proxies in the search forfeeding whales. As a result, there is a high co-occurrenceof baleen whales where tuna fishing occurs in the sanctuary(Figure 60), and the potential for interaction and disturbanceis correspondingly high (Figure 61). The frequency ofhooked whales trailing tuna fishing tackle in 2007 promptedcalls from so many whale watch patrons, that it clogged thewhale disentanglement hotline jeopardizing its effectiveness(S. Landry, PCCS, pers. comm., 2007).Other ActivitiesAdditional activities that impact whale behaviors includewatercraft approaching whales too closely, vessels disruptingcritical feeding behaviors (such as transiting throughbubble clouds or bubble nets) and potential disturbanceby aircraft, specifically fixed-wing aircraft, helicopters andairships. (APs: MMBD 1.2, 1.3 and MMBD.3)Vessel St r i k e sResearch indicates that approximately 10% of the vessel/whale collisions recorded world-wide were reported fromthe <strong>Stellwagen</strong> <strong>Bank</strong> sanctuary area (including Cape CodBay and Boston Harbor) and that the sanctuary area is a“hot spot” for vessel strikes along the eastern U.S. seaboard(calculated from Jenson and Silber, 2003) (Figure 62). Dataindicate that about 39% of the reported strikes result inIV. Resource States 107
Fi g u r e 60. Co-o c c u r r e n c e o f b a l e e n w h a l e s a n d t u n afishing in t h e St e l lwa g e n Ba n k s a n c t u a r y d u r i n g Ju ly2001–Ju n e 2002.Whale distribution is represented as a Kriged density plot ofsightings data from the standardized survey using a 5,000 msearch radius and analyzed by ESRI ARCGIS. Dots indicatelocations where bluefin tuna were caught based on FishingVessel Trips Reports (VTR) for the same period. Source:<strong>NOAA</strong> Fisheries Service VTR data selected for the sanctuaryarea. The VTR database is discussed in the Human Usessection under Commercial Fishing – data types and sources.Fi g u r e 61. Ph o t o g r a p h o f a h o o k e d h u m p b a c k w h a l ein t h e St e l lwa g e n Ba n k s a n c t u a r y trailing t u n afishing t a c k l e.Credit: Provincetown Center for Coastal Studies.Fi g u r e 62. Ap p r o x i m at e l o c a t i o n o f s h i p s t r i k e s t ob a l e e n w h a l e s a l o n g t h e e a s t e r n s e a b o a r d o f t h eU.S. i n c l u d i n g t h e St e l lwa g e n Ba n k s a n c t u a r y f r o m1979–2002.Note high occurrence in and around the sanctuary whereindicated by arrow. Positions inferred from Jensen and Silber(2003).mortality or serious injury (Anon, 2004). Species struckinclude four endangered species (humpback, fin, sei andNorth Atlantic right) and one protected species (minke).Vessel types involved in the strikes of these whales includelarge commercial ships, commercial whale watch vesselsand private recreational-type boats. Historical recordsdemonstrate that the most numerous, per capita, oceangoingstrikes recorded among large-whale species accrueto the North Atlantic right whale (Vanderlaan and Taggart,2006).Vessel SpeedJenson and Silber (2003) documented 27 reported vessel/whale collisions that occurred in the greater <strong>Stellwagen</strong><strong>Bank</strong> area over a 22-year period (1980-2002) with a generalincrease in strikes occurring between 1984 and 2001.The annual mean cruising speed of commercial whalewatch vessels in the <strong>Stellwagen</strong> <strong>Bank</strong> sanctuary over therelated 25-year period (1980-2004) increased from 11 kts108<strong>Stellwagen</strong> <strong>Bank</strong> <strong>National</strong> <strong>Marine</strong> <strong>Sanctuary</strong> Draft Management Plan/Environmental Assessment
Fi g u r e 63. Hi s t o r i c a l t r e n d s (1980–2004) in t h e c r u i s i n g s p e e d (a n n u a lm i n i m u m , m a x i m u m a n d m e a n ) o f c o m m e r c i a l w h a l e w a t c h v e s s e l s o p e r at i n gwithin a n d a r o u n d t h e St e l lwa g e n Ba n k s a n c t u a r y.Reported strikes of whales due to collision with the whale watch boats are also indicatedin the year that they occurred. Data for 1980-2002 were gathered by naturalists on whalewatch cruises and provided by the Whale Center of New England; data for 2003-2004were gathered by data loggers integrated with GPS receivers during the sanctuary studyof industry compliance with <strong>NOAA</strong> whale watch guidelines (Wiley et al., in press).Fi g u r e 64. Ma x i m u m a n d av e r a g e s p e e d in k n o t s f o r a l l (156) t r a c k e dc o m m e r c i a l v e s s e l s t r a n s i t i n g t h e St e l lwa g e n Ba n k s a n c t u a r y d u r i n g t h em o n t h s o f Ap r i l a n d May 2006 u s i n g t h e USCG’s AIS.The number of vessels of each type tracked within this time frame is indicated along thebottom axis.to 28 kts, with maximum speedsdoubling from 20 kts to 40 kts; thehigher speeds began in 1998 (Figure63). The annual rate of strikes bythese whale watch vessels during1998-2004 (5/7 = 0.714) was 3.2times greater than during 1980-1997(4/18 = 0.222). [Note: There wereno reported strikes in 2005 or2006, which lowers the rate during1998-2006 (5/9 = 0.556). However,that rate is still 2.5 times greaterthan during 1980-1997 when vesselspeeds were lower.]Vanderlaan and Taggart (2007)calculate that the greatest rate ofchange in the probability of a lethalinjury to a large whale (any species)due to vessel strike occurs betweenvessel speeds of 8.6 kts and 15 kts;the probability drops below 50%at 11.8 kts and approaches 100%above 15 kts. The increased vesselspeed by commercial whale watchvessels operating in the sanctuaryplaces whales at greater risk ofbeing struck and raises the probabilityof lethal injury. Increase in sizeand speed of vessels generally hasresulted in a corresponding increasein the number of vessel strikes(e.g., Laist et al., 2001; Taggart andVanderlaan, 2003; Pace and Silber,2005).To further characterize speed ofcommercial vessels transiting thesanctuary, records from the USCGAutomatic Identification System(AIS) were analyzed for the monthsof April and May 2006. The AIS datawere collected as part of a collaborativeeffort between the <strong>Stellwagen</strong><strong>Bank</strong> sanctuary and the USCG (seebelow). One hundred and fifty-sixAIS-tracked vessels transited thesanctuary during these two months.Tug and tows, cargo ships and tankersmade up 86% of the total trafficvolume (Figure 64). Cargo shipswere recorded to be transportinga wide variety of container types,while the majority of tanker trafficspecialized in mineral <strong>resource</strong>and chemical transport. The highestaverage speeds recorded (all greaterthan 15 kts) were reported for asingle large passenger ferry, motorizedpleasure craft and law enforce-IV. Resource States 109
ment vessels; these and cruise ships, cargo andLNG carriers all showed maximum speeds greaterthan 20 kts.Vessel TrafficCollisions with large commercial ships constitutethe majority of human-caused North Atlantic rightwhale mortalities (see Sidebar). <strong>NOAA</strong> FisheriesService and the USCG established the MandatoryShip Reporting System (MSRS) in July 1999 toreduce this threat (Figure 65). Under this system,all commercial ships, 300 gross tons or greater, arerequired to report to a shore-based station whenentering into critical habitat areas (i.e., GreatSouth Channel). Analysis of relative ship trafficdensity (kilometers of ship track per square kilometer)representing MSRS data from the first threeyears (1999-2002) of the northeast Mandatory ShipReporting System indicates that five major highusecorridors of vessel traffic pass directly throughthe sanctuary (Ward-Geiger et al., 2005).The <strong>Stellwagen</strong> <strong>Bank</strong> sanctuary is working in partnershipwith the USCG to adapt the AIS, originallydeveloped for tracking vessels in real time to reducethe risk of vessel collisions, as a means to analyzevessel traffic patterns across the sanctuary. The AISis a national shipboard broadcast system operatingin the VHF maritime band. Compliance is mandatoryfor all vessels 300 gross tons or more, vesselscarrying 150 or more passengers, and some othertypes of commercial shipping such as tug and tow(http://www.navcen.uscg.gov/enav/ais/default.htm). Together with the USCG, the sanctuary hasestablished a network of receivers on Cape Ann,Scituate and Cape Cod that provides completecoverage of the sanctuary and adjoining area.The AIS data portrayed in Figure 66 indicate thatthe sanctuary, because of its proximity to the Portof Boston, receives more commercial shippingtraffic than any other location within U.S. jurisdictionin the GoM. These data are for the monthsof April and May 2006. While the overall trafficpattern displayed is similar to that indicated bythe MSRS data, the AIS data have the advantage ofbeing automatic and thus free of voluntary reportingbias, of representing all vessel tracks and notjust one-way traffic upon entering critical habitatareas, and of documenting the entire vessel pathactually traveled, not just the straight line distanceinferred from initial point of reporting and arrivalat destination. Vessel reports include informationabout vessel type and behavior, such as speed andcourse, and cargo carried.The main Boston shipping channel transects historicwhale high-use areas across southern <strong>Stellwagen</strong><strong>Bank</strong>. All cetacean species that frequent thesanctuary and surrounding waters exhibit space-ON THE BRINK OF EXTINCTION—the NorthAtlantic Right WhaleThe North Atlantic Ocean has been home to the NorthAtlantic right whale (Eubalena glacialis) for eons. The Basquesbegan hunting North Atlantic right whales in Europe in1150, taxed by royal decree, and continued for nearly 600years. By the 1500s, the Basques had exterminated the rightwhale population on the eastern side of the North AtlanticOcean. In the latter part of the 16th century, Basque whalersexpanded their hunting grounds westward to North America,particularly to the waters off southern Labrador.Eventually, New England shore-based whalers dominatedthe local industry, seeking oil and baleen for energy andcommercial products. Their catches of right whales peaked inthe early 1700s, but Yankee whalers continued to pursue thisspecies whenever opportunity afforded. The last animals tobe taken intentionally were a mother and calf off Madiera in1967, although the species had been afforded protection fromhunting since an international agreement signed in 1935.This species had been the “right” whale to take because of itsproximity to coasts and its high oil content making the whalepositively buoyant so that it floated when killed.Despite seven decades of protection from whaling, the NorthAtlantic right whale population has not rebounded. Todayonly a remnant of the population survives, no more than 350whales clustered in calving and feeding grounds along theeastern seaboard of North America. Only occasional rightwhale sightings in the Gulf of St. Lawrence or in the watersbetween Iceland, Greenland and Norway give echoes of theironce substantially greater range.A critical factor in the right whale’s population decline ishuman-induced mortality. Right whales are frequently struckand killed by ships or become fatally entangled in fishing gear,because their migratory routes overlap with major fishingareas and heavily trafficked shipping lanes along the eastcoasts of the United States and Canada. They are also morefrequently killed and entangled because they spend mostof their time at the surface, feed at the surface and travelslowly compared to other whales. In addition, the whalesare not reproducing consistently or fast enough to increasetheir numbers—perhaps because of disease, pollutants, poorfood supplies or genetic insufficiencies. Right whales reachreproductive maturity at a late age relative to other whales (>9yrs), produce one calf every 3-6 yrs (a lower frequency thanother whales) and only 50% of the calves survive the first year.An area consisting of Cape Cod Bay and the southernmostportion of the sanctuary was designated a right whale criticalhabitat in 1994 because of its significance as a feeding areafor right whales, which are resident primarily from Januarythrough early May. More than half the total population hasbeen sighted in the area since studies began of right whalesin the 1980s. Results of ongoing acoustic monitoring of the<strong>Stellwagen</strong> <strong>Bank</strong> sanctuary indicate that this species frequentsthe sanctuary to a greater extent than previously understood.110<strong>Stellwagen</strong> <strong>Bank</strong> <strong>National</strong> <strong>Marine</strong> <strong>Sanctuary</strong> Draft Management Plan/Environmental Assessment
Fi g u r e 65. Ma n d a t o r y s h i p r e p o rt i n g s y s t e m (MSRS)d at a f r o m 1999–2002 s h o w i n g t r a c k s o f l a r g ec o m m e r c i a l v e s s e l s t r av e r s i n g t h e St e l lwa g e n Ba n ks a n c t u a r y.Tracks depict only incoming traffic and represent only thestraight line projected path of ships as they enter the MSRSzone, hence the straight lines. Only half of the actual traffic isillustrated, because vessels leaving the port are not requiredto report upon their departure. Tracks going north-south areships or tugs in tow that are transiting through the Cape CodCanal. The Boston Transportation Separation Scheme (TSS)(outlined in purple) is a voluntary shipping lane establishedby the International Maritime Organization (IMO) (data courtesyof <strong>NOAA</strong> Fisheries Service).Fi g u r e 66. Sh i p t r a c k s in t h e St e l lwa g e n Ba n ks a n c t u a r y a n d w e s t e r n GoM f o r t h e m o n t h s o f Ap r i la n d May 2006 d e r i v e d f r o m t h e USCG AIS.The data consist of more than 36 million position recordsgenerated along vessel paths at several second intervals froma total of 916 ships. Yellow represents the April tracks overlainby the May tracks in red.The <strong>Stellwagen</strong> <strong>Bank</strong> sanctuary and adjoining area is a hotspot for fishing gear entanglements with whales and has thehighest number of reported incidents in the GoM (Figure67). The area in and around the sanctuary has the highestuse (combination of spatial extent and density) of fixed gearvessels (gillnet, lobster and other trap/pot fisheries) anywherealong the eastern seaboard of the United States (Figure 68).Relative to other areas, entanglement reports in the sanctuaryarea are more frequent, which could reflect an increasedrate of entanglement, increased observer effort, or both.use patterns with areas intensively utilized by boat traffic forfishing, commercial shipping, military shipping and recreationalactivity. The MMVS AP proposes several strategiesto address these issues including re-routing shipping lanes(AP: MMVS.1) and instituting voluntary speed restrictionsfor vessels other than large commercial ships to mitigatevessel strikes to marine mammals (AP: MMVS.2).En ta n g l e m e n tAnalysis of scars on humpbacks and right whales in the GoMregion indicate that between 50% and 70% of the animalshave been entangled at least once in their lives and between10% and 30% are entangled each year (Robbins and Mattila,2004). Chronically entangled whales lose blubber reservesmaking them more likely to sink when they die, thus it isbelieved that gear-induced mortality is underestimated morethan ship kills. A study of the morbidity and mortality ofchronically entangled North Atlantic right whales indicatesthat gear entanglement is a major animal welfare issue aswell as being an obvious conservation concern (Moore etal., 2000).Co-occurrence between various marine mammal speciesand types of fishing gears capable of entangling them areof priority concern in the sanctuary. Such co-occurrencevaries on a spatial and temporal basis and Wiley et al.(2003) calculated a Relative Interaction Potential (RIP) indexto identify hotspots of potential whale entanglement in thesanctuary (Figure 69). This risk analysis predicts that theIV. Resource States 111
highest possibility of entanglement within the sanctuaryshould occur around the southwest and northwest cornersof <strong>Stellwagen</strong> <strong>Bank</strong>.The risk of whale entanglement in the sanctuary increases inareas where whales and fixed fishing gear co-occur, as indicatedby the shading with the darkest area representing thetop quartile of risk (Figure 69). For the study period of July2001–June 2002, all three sightings (100%) of entangledwhales occurred within or in the immediate vicinity of topquartilecells. For the period 2000–2002, 85% (11 of 13)of entangled whales were found within or in the immediatevicinity of top-quartile cells. Although the locations whereentangled whales were sighted are not necessarily the sitesof entanglement, the high frequency of entanglements inareas of the sanctuary predicted to be high risk is a compellingcorrelation.Tagging data indicate that humpback whales can beextremely active at or within a few meters of the seafloor formany hours (Figure 70) and that bottom feeding is an importantstrategy (Wiley et al., 2005). Therefore, fishing gearanywhere in the water column presents an entanglementFi g u r e 67. Si g h t i n g l o c a t i o n s o f w h a l e s r e p o rt e de n t a n g l e d in fishing g e a r in t h e St e l lwa g e n Ba n ks a n c t u a r y a n d GoM b e t w e e n 1985 a n d 2006.Note: entangled whales can tow gear for long distances andthe location of reported sightings might or might not be theoriginal site of entanglement. Source: Provincetown Centerfor Coastal Studies.risk to the animals. In 95% of flat-bottomed dives in the fourhumpback whales tracked in this study, the animals exhibiteda characteristic “side-roll” behavior along the seafloor(Figure 70). Side rolls involved the animal rolling laterallymore than 40 degrees from dorsal and holding that positionfor a consistent duration, usually more than 10 secondsand less than a minute. The consistency of the behavior isevident from the bimodal distribution of body orientationmeasurements.Side-roll behavior is presumed mouth-open feeding duringwhich whales turn on their side to scour the sandy bottomand engulf sand lance burrowed in or located along theseafloor. This behavior indicates that the likelihood ofentanglement by open mouth and protruding appendages(flippers and tail) would be elevated during bottom feedingbouts in areas with co-occurrence of fixed fishing gear strungacross the ocean bottom. In a study of 30 cases of entangledhumpback whales (Johnson et al., 2005), the most commonFi g u r e 68. Distribution a n d d e n s i t y o f n u m b e r o fa c t i v e f i x e d g e a r fishing v e s s e l s (g i l l n e t, l o b s t e r,a n d o t h e r t r a p/p o t f i s h e r i e s) f r o m Virginia t o Ma i n ed u r i n g 2004.While not pictured here, few fixed gear fisheries occur inthe Virginia to Florida area. Graphic based on VTRs andfederal lobster permit data analyzed by 10 x 10 minute gridcell. Analysis does not include state-only permitted vessels.Source: Industrial Economics, Inc./<strong>NOAA</strong> Fisheries Service,NERO.112<strong>Stellwagen</strong> <strong>Bank</strong> <strong>National</strong> <strong>Marine</strong> <strong>Sanctuary</strong> Draft Management Plan/Environmental Assessment
Fi g u r e 69. Re l at i v e In t e r a c t i o n Po t e n t i a l (RIP)i n d e x s h o w i n g t h e p o t e n t i a l f o r i n t e r a c t i o n b e t w e e nb a l e e n w h a l e s a n d f i x e d fishing g e a r in t h e St e l lwa g e nBa n k s a n c t u a r y, b y 5-m i n u t e s q u a r e a r e a.The index was calculated by multiplying the total numberof fixed gear surface buoys within a 5-minute square by thetotal number of whales sighted in that square. Data werecollected from July 2001 through June 2002 for calculationof the index. Yellow symbols depict where entangled baleenwhales were sighted during 2000-2002. (Source: adaptedfrom Wiley et al., 2003)point of gear attachment was the tail (53%) and the mouth(43%) which seems to affirm this inference.The immediate effects of entanglement include mortalityby drowning as well as serious and minor injuries such aslacerations. Long-term effects can include deterioratinghealth and susceptibility to disease, crippling deformationand impaired body function, and decreased competitiveand reproductive ability. <strong>Marine</strong> mammal species reportedin the sanctuary that are most susceptible to entanglementinclude baleen whales, harbor porpoises, white-sideddolphins and harbor seals.Most cetacean bycatch in the sanctuary (and the GoM) isassociated with the sink gillnet fishery, although entanglementshave also been documented in lobster pots, purseseine and bottom trawl gear (Smith et al., 1993; Johnsonet al, 2005). Derelict fishing gear (i.e., “ghost nets”) is alsosuspected to cause entanglement. The incidental catch ofharbor porpoise and Atlantic white-sided dolphin has beendocumented for gillnet fisheries in the GoM (Gilbert andWynne, 1987; Waring et al., 1990; Smith et al., 1993).Reducing incidental mortality in fisheries through time/areaclosures, gear modification, and disentanglement rescueand release efforts are management solutions to addressentanglement problems.Re d u c e d Fo r a g e Ba s eAtlantic herring accounted for the greatest volume byspecies landed from the <strong>Stellwagen</strong> <strong>Bank</strong> sanctuary during1996–2005 (refer to subsection on commercial fishing inthe Status of Human Uses section of this document for datasource and details). Sand lance are not commercially fishedwithin the sanctuary (refer to subsection EA.3 Action Plansin this document for expanded discussion of sand lanceas prey). For the years 1996–2005, a total of 70.1 millionpounds (31,799 mt) or an average 7.0 million pounds(3,180 mt) of herring per year were removed from the sanctuaryby commercial fishing (Table 10). Herring removal inthis amount by fishing reduces the forage base available tomarine mammals, fish and seabirds in the sanctuary, couldcause local prey depletion, and thereby could be a factordetermining the local abundance of whales, dolphins andother wildlife in the sanctuary. What is meant by the term“local depletion” is explained in the accompanying Sidebar.The spatial distribution of commercial herring fishing in thesanctuary, based on pounds caught and landed by all geartypes during 1996–2005, is presented in Figure 71. Landingswere greatest from around Jeffreys Ledge and parts of<strong>Stellwagen</strong> <strong>Bank</strong>. A variety of gear types, consisting of midwaterpair trawl, mid-water otter trawl and purse seine, wasused in the early years (1996–2001), but thereafter commercialherring fishing in the sanctuary was dominated by pairtrawling(Figure 72).According to recent stock assessments, herring are currentlynot overfished and no overfishing is occurring (http://www.nefmc.org/herring/index.html). Fishery management plans(FMPs) require that annual harvest levels are specified consistentwith scientific advice. However, scientific models usedin these stock assessments have suggested that total herringbiomass may be overestimated and fishing mortality underestimated.In addition, abundance surveys in the inshoreGoM are indicating a declining trend, thereby adding tothe scientific uncertainty associated with these populationanalyses. The inclusion of biological interactions and theirimpacts in stock assessments and multispecies models is animportant step in predicting sustainable yields and developingrealistic estimates of biological reference points for keyprey species (ICES, 1989; Overholtz et al., 1991; Hollowedet al., 2000). This has not been done in the herring FMP.Lacking these considerations, an over-optimistic picture ofsustainable yield may result, and important trophic linksmay be severed if a prey <strong>resource</strong> is overfished (Overrholtzand Link, 2007).The fishery for herring harvests the same size groups thatpredators (whales, dolphins) consume and is in effect inIV. Resource States 113
Fi g u r e 70. Th r e e-d i m e n s i o n a l r i b b o n t r a c k o f a t a g g e d h u m p b a c k w h a l e s h o w i n g e x t e n s i v e i n t e r d e p e n d e n t u s e o fs e a f l o o r a n d w a t e r c o l u m n d u r i n g f o r a g i n g a l o n g t h e b o t t o m .Twists in the ribbon correspond to side rolls by the animal. Also shown is the bimodal distribution of body orientation (0,0:normal dorsal superior swimming position; 100,30: body rolled ~100° and pitched down ~30°) and a visualization of the body rolland pitch used during suspected bottom feeding. Ribbon tracks were developed by Colin Ware (University of New Hampshire).(Adapted from Wiley et al., 2005).competition with them (Overholtz et al., 2000); fishermenfishing for pelagic prey species (such as herring) adopt thesame foraging strategy as natural predators (Bertrand et al.,2007). Modeling simulation of the relationship betweenminke whale abundance and herring fisheries catch in theNorth Atlantic ecosystem shows interactions that are mainlylinear and inverse (Schweder et al., 2000). Of consequencein discussing the issue of fishery induced prey depletion,is the fact that baleen whales (humpback, fin and minke)require a minimum threshold level of prey density to successfullyforage (Piatt and Methven, 1992) and that humpbackwhales depend on the spatial characteristics and density ofthe prey school to maximize their feeding efficiency whensurface feeding (Friedlaender et al., in review).Prey patchiness tends to increase with mean prey density,so depletion of prey stocks by fishing may rapidly reducenumbers of suitable prey aggregations. <strong>Marine</strong> mammals aretypically aggregated prey patch foragers. Thus local changesin prey abundance may be more important than changesacross the entire stock range, i.e., GoM. Management toLOCAL DEPLETIONThe scientific meaning of the term “local depletion”derives from the fact that the assumption of unitstocks (regionally interbreeding populations thatare reproductively closed) is being rethought in thescientific literature based on new findings. In modernparlance, a stock is actually a “metapopulation”comprising local populations linked by larvaldispersal, rather than the older and often falseassumption of a larger, spatially discrete andreproductively isolated population. Recent geneticand otolith microchemical studies indicate thatmarine stocks have complex spatial structures atmuch smaller scales than previously assumed. Theimportant implication of these findings is that adecline in fish abundance in one area may not bereplenished quickly or inevitably from another area.This creates the possibility for localized overfishingand local depletion (Francis et al, 2007).114<strong>Stellwagen</strong> <strong>Bank</strong> <strong>National</strong> <strong>Marine</strong> <strong>Sanctuary</strong> Draft Management Plan/Environmental Assessment
Fi g u r e 71. Spat i a l distribution o f c o m m e r c i a lh e r r i n g fishing in t h e St e l lwa g e n Ba n k s a n c t u a r yd u r i n g 1996–2005.Area of circle is proportional to pounds of herring caught andlanded from that location. Source: <strong>NOAA</strong> Fisheries ServiceVTR data selected for the sanctuary area.avoid depletion of the prey fields composed of herring andsand lance by fisheries in local areas of critically importantforaging habitat for marine mammals, such as the sanctuary,may be needed. Also the sanctuary is a hotspot for preyabundance (see Figure 46 and associated text). An importantcharacteristic of pelagic forage fish hot spots is theirpersistence, allowing predators to predict their locationsand concentrate search efforts to enable optimal foraging(Gende and Sigler, 2006). Fishing down prey aggregationsin SBNMS diminishes the reliability and functional utility ofthis important attribute of the sanctuary.While reductions in prey abundance might not always besufficient to directly cause a predator species populationto decline per se, they can cause shifts in predator speciesdistribution which affects local predator abundance. Localchanges in humpback whale abundance and distribution inthe western North Atlantic have been correlated with variationin prey availability (Payne et al., 1986; Weinrich et al.,1997). A negative relationship was shown between therelative abundance of herring and sand lance in the GoMand humpback whale movement from the GoM to easternCanada when prey densities dropped (Stevick et al., 2006).This study also found that humpback whales exhibited highlevels of site fidelity to specific feeding grounds and that theduration of stay at, and tendency to return to, each feedingground was related to relative prey density. Since activitiesthat remove biomass (i.e. reduce prey density) simultaneouslydisrupt prey patch configuration, extraction can havea cumulative negative impact on predators. These impactswould be greatest during periods of natural prey decline,during which additional removal by fishing would hastenthe decrease of prey and cause whales and other predatorsto leave the sanctuary earlier than would have occurredunder conditions of non-extraction.The ease and impacts of such departures by endangeredwhales from the sanctuary to other parts of the GoM mightnot be trivial. Recent investigation (Robbins 2007) has determinedthat despite inter-annual variation, the sanctuary is asite of persistent humpback whale aggregation, thus animalsare reticent to leave the area even when faced with reducedprey. Robbins (2007) also determined that the sanctuary ispreferentially used by juveniles and reproductively mature/active females. These classes typically play important rolesin large mammal population dynamics because of theirsensitivity to environment and/or population density (juveniles)and importance to population growth (adult females).Thus, the preferential and persistent use of the sanctuaryby the most important segments of this endangered whalepopulation indicate that management actions specific to thesanctuary could benefit the population as a whole (Robbins2007). Assuring an adequate prey base is a key componentof such management, as the growth requirement of juvenilesand the increased nutritional cost of lactation wouldrequire high rates of prey consumption.While less data exist for other species, similar conditionsmight exist. For example, Agler et al. (1993) found that finTa b l e 10. He r r i n g l a n d i n g s (m i l l i o n s o f p o u n d s) f r o m t h e St e l lwa g e n Ba n k s a n c t u a r y b y g e a r t y p e (1996–2005).Gear Type 1996 1997 1998 1999 2000 2001 2002 2003 2004 2005 Total %TotalPair Trawl, 95 4,060 8,083 3,098 1,060 1,676 7,383 1,881 3,407 13,057 43,800 62.5MidwaterOtter Trawl, 2,627 2,761 4,162 2,064 0 1,406 430 0 0 3,971 17,421 24.9MidwaterPurse Seine 2,680 1,274 710 3,682 60 0 0 80 0 0 8,486 12.1Other * 358 3 4 8 0 0 0 2 4 0 378 0.5Total 5,760 8,098 12,958 8,852 1,120 3,082 7,813 1,963 3,411 17,028 70,085 100.0* Other includes: otter trawl, bottom, fish; gill net, sink; hand line/rod & reel; otter trawl, shrimp; and mixed gear.IV. Resource States 115
Fi g u r e 72. He r r i n g l a n d i n g s in p o u n d s b y fishing g e a r t y p e a n d y e a r f r o m t h e St e l lwa g e n Ba n k s a n c t u a r y d u r i n g1996–2005.Source: <strong>NOAA</strong> Fisheries Service VTR data selected for the sanctuary area.whales in the southern GoM had higher reproductive ratesthan those in the northern areas. These results are similarto those reported for humpbacks (Robbins 2007) and mightresult from a similar preference for adult females to use thesanctuary. Thus, increased prey availability at the scale ofthe sanctuary could have a population level impact on thatendangered species as well.It is unclear whether herring fishery management adequatelyaccounts for the energetic requirements of species that relyon herring such as large whales (i.e., humpback, fin, minke),pinnipeds, seabirds, and piscivorous fish (i.e., bluefin tuna,cod, bluefish, striped bass), but such knowledge is consequentialto ecosystem-based management of the sanctuary.One recent study suggests that stock assessment models forherring in the GoM seriously underestimate the amountof herring needed to sustain not only the fishery but alsothe biota that relies on healthy herring populations (Readand Brownstein, 2003). The following illustration impliesno defined need for whales and dolphins to remain withinthe sanctuary, nor is there any such expectation. However,there is the expectation that whales will be able to feedoptimally and realize net benefit without competition fromfishing while in the sanctuary.The herring landings from the sanctuary reported above canbe converted to an equivalent number of marine mammalsthat could be supported in the sanctuary, if the herring werenot extracted by fishing. This illustration uses a measureof consumption of herring by whale and dolphin speciesfor representative terms of residency in the GoM based onRead and Brownstein (2003). The average landings of 3,180mt of herring per year from the sanctuary are equivalent tothe annual forage required to support approximately: 219fin whales or 253 humpback whales or 499 minke whalesor 2,978 Atlantic white-sided dolphins, for example. Theresults derived from these calculations are exclusive to eachof the four species of marine mammals considered andonly allow general inference. In actuality, a mix of marinemammal species and multiple piscivorous sea birds andfishes would consume the herring if they were not caught(Overholtz and Link, 2006).Herring and sand lance are keystone prey species thatconstitute a major segment of the forage base of the sanctuary.The species affected by the removal of herring by fishinginclude those (e.g., whales, cod, blue fin tuna) centralto supporting tourism and recreation in the sanctuary,which are activities that generate direct sales far greater invalue than the ex-vessel landings of the herring per se. Forexample, annual direct sales value for commercial whalewatching in the sanctuary was approximately $24 million in2000 (Hoyt, 2001); ex-vessel value for herring landings fromthe sanctuary that year was $64 thousand (fishing VesselTrip Report [VTR] data, <strong>NOAA</strong> Fisheries Service); ex-vesselvalue for herring landings from the sanctuary for the decade(1996–2005) was $5.4 million (Table 15, Commercial Fishingsection of this document). The total volume of herringremoved annually by commercial fishing in the sanctuary(and accompanying disruption of prey fields) may besufficient to reduce the amount of prey available to attractand sustain a broad array of sanctuary fish and wildlife andto diminish the economic and social activities ultimatelydependent on them.Po l l u t i o n a n d Ch e m i c a l Co n ta m i n a n t sThe environment of the <strong>Stellwagen</strong> <strong>Bank</strong> sanctuary providesfeeding and nursery areas for humpback, fin, sei, minke andNorth Atlantic right whales, the latter being the most critically-endangeredof all large cetacean species. Cetaceansare key predators of small fish and zooplankton and theyexhibit low fecundity relative to many other marine animals.116<strong>Stellwagen</strong> <strong>Bank</strong> <strong>National</strong> <strong>Marine</strong> <strong>Sanctuary</strong> Draft Management Plan/Environmental Assessment
These biological characteristics, coupled with their sensitivedependence on specific prey types, mean that cetaceansalso function as important bioindicators of the health andproductivity of marine ecosystems (Reijnders et al., 1999;Greene et al., 2003).Pollution in the form of dredge spoils, ocean dumping anddisposal, and noise, as well as chemical contaminants mayaffect the health and survival of baleen whales (Perry etal., 1999; Reeves et al., 2000; Rolland et al., 2005). Sandlance is a key species within the sanctuary and serves asthe primary prey of humpback whales and other baleenwhales in the sanctuary. The populations of key species,such as sand lance, are highly variable, and fluctuate widelyfrom year to year, with concomitant effects on consumers,such as whales. Although contaminant concentrations havenot been determined for prey species (e.g., sand lance) todate, predator-prey relationships are important pathwaysto consider when evaluating possible adverse effects ofcontaminants on the health of marine mammals.In addition to point-source pollution that may affect foodwebs (e.g., chemicals from discharge sites and dumping),the atmospheric transport of contaminants represents aglobal danger (Reeves, 2003). Exceptionally high levels ofchemical contaminants in the tissues of cetaceans may beaffecting the animals’ immune and reproductive systems(Reeves, 2003). For example, Weisbrod et al., (2001) foundelevated levels of organochlorine in pilot whales and Atlanticwhite-sided dolphins from the southern GoM, with the laterconsidered to have bioaccumulated hazardous concentrationsof polycholorinated biphenals (PCBs) and chlorinatedpesticides. In addition, a wider range of PCBs and pesticideshave been detected in baleen whale species, including theendangered right whale, although concentrations were notconsidered hazardous (Weisbrod et al., 2000).Cetacean exposure to marine biotoxins associated withharmful algal blooms (HABs) has been documented in theGoM (Doucette et al., 2006). The dinoflagellate genusAlexandrium, which produces paralytic shellfish poisoning(PSP), blooms at the time of right whale abundance. Thetrophic transfer of marine toxins has been hypothesized tobe a contributing factor to the poor recovery of the NorthAtlantic right whale, although neither chronic nor sublethaleffects are known for cetaceans (Durbin et al., 2002). Similarlyin 1987, 14 humpback whales washed ashore dead anddecomposed along Cape Cod Bay and Nantucket Sound.The cause of this unprecedented stranding of large baleenwhales was attributed to a naturally occurring neurotoxincalled saxotoxin or STX (Geraci et al., 1989). Additionally,marine debris pollution (e.g., from ingestion of plastic bags)and its impact on marine animal populations is a globalproblem, which is extremely difficult to evaluate (Laist etal., 1999).Cu r r e n t Pr o t e c t i o nThe protection of marine mammals in the sanctuary isprovided through the following laws, regulations, andguidelines:• <strong>National</strong> <strong>Marine</strong> Sanctuaries Act (NMSA) of 1972 (16U.S.C. § 1432 et seq.)• SBNMS Regulations (15 CFR § Subpart N)• <strong>Marine</strong> Mammal Protection Act (MMPA) of 1972• Endangered Species Act (ESA) of 1973• <strong>NOAA</strong> Voluntary Whale Watch Guidelines<strong>Sanctuary</strong> regulations prohibit the taking or possessing(regardless of where taken, moved or removed from),except as necessary for valid law enforcement purposes, ofany marine reptile, marine mammal or seabird in or abovethe sanctuary, except as permitted by the <strong>Marine</strong> MammalProtection Act, as amended, (MMPA), 16 U.S.C. 1361 etseq., the Endangered Species Act, as amended, (ESA), 16U.S.C. 1531 et seq., and the Migratory Bird Treaty Act,as amended, (MBTA), 16 U.S.C. 703 et seq. All marinemammals while in or transiting the sanctuary are sanctuary<strong>resource</strong>s. Five species of baleen whales are endangered(Table 8).The MMPA and ESA prohibit the “taking” of a marinemammal (i.e., “harass, hunt, capture or kill”) without authorization.The relevant definition of the term “harassment”means any “negligent or intentional act which results inthe disturbing or molesting of marine mammals” causingby disruption of “behavioral patterns, including, but notlimited to migration, breathing, nursing, breeding, feeding,sheltering” {16 U.S.C. 1362(13)}. All marine mammals arefederally “protected” by the MMPA and most large whalesare further listed as “threatened or endangered” under theESA.Be h av i o r a l Di s t u r b a n c e<strong>NOAA</strong> regional whale watch guidelines are intended toprevent harassment and possible injury or death to largewhales by both commercial and recreational vessels(Appendix M). The North Atlantic right whale is protectedby separate State and Federal regulations that prohibitapproach within 500 yards (457 m) of this species (50 CRF222.32). Any vessel finding itself within the 500-yard bufferzone created by a surfacing right whale must depart immediatelyat a safe slow speed. The only vessels allowed toremain within 500 yards of a right whale are vessels withappropriate research permits, commercial fishing vessels inthe act of hauling back or towing gear, or any vessel givenprior approval by <strong>NOAA</strong> Fisheries Service to investigate apotential entanglement. Except for the North Atlantic rightwhale, no federal rule regulates how vessels behave aroundwhales in the northeast region.The <strong>Stellwagen</strong> <strong>Bank</strong> sanctuary has no overflight restrictionsgoverning airplane activity. To date, guidelines or legislationregarding sound (acoustic) energy and the need to manageit appropriately do not exist. <strong>NOAA</strong> Fisheries Servicepublished a notice of intent on 11 January, 2005, in theFederal Register (70 FR 1871) to prepare an EIS to analyzethe potential impacts of applying new criteria in guidelinesto determine what constitutes a “take” of a marine mammalunder the MMPA and ESA as a result of exposure to anthropogenicnoise in the marine environment.IV. Resource States 117
Vessel St r i k e<strong>NOAA</strong> issues ship speed advisoriesusing <strong>NOAA</strong>-based communicationsto help reduce ship strikes toNorth Atlantic right whales. The<strong>NOAA</strong> <strong>National</strong> Weather Serviceissues right whale advisories andspeed advisories on <strong>NOAA</strong> weatherradio when aggregations are sighted.Advisories are voluntary andapply to areas where right whalessightings have been confirmed; theyindicate that neither navigationalnor human safety is to be jeopardizedas a result of reduced speedsor other maneuvers to reduce therisk of striking a whale. Speed advisorieshave also been integratedinto many <strong>NOAA</strong> publications.Ships reporting into the MandatoryShip Reporting System receivean automated message indicatingprecautionary measures to be takento avoid hitting whales, includingspeed advisories (Ward-Geiger etal., 2005).Current efforts to reduce occurrenceof North Atlantic right whale deathsand serious injury from ship strikeshave not been sufficient to recoverthe species. <strong>NOAA</strong> is proposingregulatory measures, as part ofthe <strong>NOAA</strong> Ship Strike ReductionProgram, designed to significantlyreduce the likelihood and severityof collisions with right whales whilealso minimizing adverse impacts on ship operations. <strong>NOAA</strong>rulemaking proposed vessel speed restrictions of 10, 12 or14 knots or less in areas and during time periods whereright whales are predicted to be most prevalent; sightingsoutside these times and areas could also trigger managementactions under some alternatives (FR 7-26-06). Theseregulations, pursuant to rulemaking authority under MMPAsection 112(a) (16 U.S.C. 1382(a)) and ESA 11(f) (16 U.S.C.1540(f)), are also consistent with the purpose of the ESA “toprovide a program for the conservation of [...] endangeredspecies” and “the policy of Congress that all Federal departmentsand agencies shall seek to conserve endangeredspecies [...] and shall utilize their authorities in furtheranceof the purposes of [the ESA].”On December 12, 2006, the International Maritime Organizationapproved a proposal submitted by the USCG onbehalf of <strong>NOAA</strong> to narrow and move the Boston area TrafficSeparation System (TSS) (i.e., the shipping lanes that crossthe sanctuary to and from the Port of Boston) 12 degreesto the north (Figure 73). The proposal was developed bythe <strong>Stellwagen</strong> <strong>Bank</strong> sanctuary in collaboration with <strong>NOAA</strong>Fi g u r e 73. Re a l i g n m e n t o f t h e s h i p p i n g l a n e s (TSS) i n t o t h e Po r t o f Bo s t o nb y t h e In t e r n a t i o n a l Maritime Or g a n i z a t i o n t o r e d u c e t h e r i s k o f s h i p s t r i k e st o b a l e e n w h a l e s in t h e St e l lwa g e n Ba n k s a n c t u a r y.Analysis based on non-standard whale sightings (n=~255,000) from commercial whalewatching vessels from 1979-2004 overlain with right whales sightings (circles) fromthe Right Whale Consortium database (n=5,675). Kriged density plots of whale watchderived sightings were produced using a 5,000 m search radius analyzed using ESRIARCGIS; whale watch data were collected by the Provincetown Center for Coastal Studiesand the Whale Center of New England.Fisheries Service, <strong>NOAA</strong> General Counsel (International)and the USCG. The lane shift greatly reduces the risk ofvessels striking whales—by up to 81% for all whales (humpback,fin, minke, northern right) and by up to 58% for thecritically endangered right whale—while minimally impactingshipping interests. The conservation benefit is realizedby moving the TSS away from areas of historical high use bywhales over prime feeding habitat. This action is strategyAP:MMVS.1 recommended in this document.En ta n g l e m e n tBesides MMPA and ESA mandates, a number of existingregulations and plans designed to reduce the risk of marinemammal entanglement in the Northeast apply to, but are notspecific to, the sanctuary. Regulations that are most applicableto marine mammal entanglement within the sanctuaryare those pertaining to trap/pot fisheries and gillnet fisheries.Examples are:• Federal lobster trap limits• Lobster trap gear identification118<strong>Stellwagen</strong> <strong>Bank</strong> <strong>National</strong> <strong>Marine</strong> <strong>Sanctuary</strong> Draft Management Plan/Environmental Assessment
Fi g u r e 74. Lo c a t i o n o f t h e St e l lwa g e n Ba n ks a n c t u a r y r e l at i v e t o Ar e a 1A in t h e h e r r i n g f i s h e r ym a n a g e m e n t p l a n.• Lobster trap maximum size• Trap/pot gear restrictions• Lobster trap gear configuration• Special restrictions on critical habitat areas• Reconfiguration of anchored gillnet gear• Multispecies sink gillnet regulations (aimed at rebuildingoverfished groundfish stocks)• Seasonal and rolling closure areas• Gear stowage requirementsThe Atlantic Large Whale Take Reduction Plan (<strong>NOAA</strong>,2007) addresses broad-based gear modifications and specialmanagement areas to reduce serious injury and mortality ofright, humpback and minke whales due to incidental interactionswith commercial fisheries.Relative to the 2005/2006 total allowable catches (TACs) ofherring, the 2007 fishery specifications reduced the Area 1ATAC by 10,000 mt (17%), modified the seasonal split of theArea 1A TAC, and increased the Area 3 TAC by 5,000 mt.Domestic annual harvest for the fishery was set at 145,000mt, domestic annual processing was set at 141,000 mt, andthere was no specification for either total allowable level offoreign fishing or total joint venture processing. The 2007fishery specifications provided the opportunity for totalU.S. fishery landings to increase about 35% above recent(1995–2005) levels.However, when implementing multi-year specifications for2007–2009, <strong>NOAA</strong> Fisheries Service determined that the2008 and 2009 specifications should include an additionalreduction in the Area 1A TAC with a corresponding increasein the Area 3 TAC. As a result, the Area 1A TAC was reducedanother 5,000 mt to 45,000 mt, and the Area 3 TAC wasincreased another 5,000 mt to 60,000 mt. All other specificationsremain the same for 2008 and 2009. In addition,the research set-aside program became effective in 2008,and 3% of each management area TAC has been set-asideto support herring-related research. The information in thisand the previous paragraph is from the NEFMC “HerringFishery Specifications for the 2007–2009 Fishing Years.”From the perspective of the sanctuary, the key componentof the actions taken is the 10,000 mt (17%) reduction in2007 and additional 5,000 mt reduction specified for 2008and 2009 in Area 1A TAC. This reduction is three to fivetimes the total average annual landings (3,180 mt) of herringcaught in the sanctuary over 1996–2005 and is more thanthe highest single year landings in the sanctuary to date(7,726 mt) made in 2005.While the numeric level of reduction seems appropriatelyscaled to address the concern of diminished prey base inthe sanctuary, that concern would only be fully addressed ifthe TAC were harvested entirely outside of the sanctuary (forreasons explained in the previous subsection on ReducedForage Base and subsequently under Action Plan ObjectiveEA.3). Thresholds for prey density as well as the shape andspatial integrity of prey fields are determinants of the optimalityof humpback whale foraging in the sanctuary; bothof these conditions are degraded by herring fishing. Andthe calculations underlying the determination of the TAC donot include empirical estimates of herring consumption bywhales or other key predators in the sanctuary.Re d u c e d Fo r a g e Ba s eAmendment 1 to the Atlantic Herring Fishery ManagementPlan was developed by the NEFMC and submitted to <strong>NOAA</strong>Fisheries Service on May 3, 2006. Notice of the final ruleimplementing Amendment 1 was published on March 12,2007 (72 FR 11252). Of significance to the <strong>Stellwagen</strong> <strong>Bank</strong>sanctuary is how the commercial herring fishery impacts theforage base of the sanctuary, particularly in regard to Area1A which entirely overlaps the sanctuary (Figure 74).IV. Resource States 119
Maritime He r i t a g e Re s o u r c e s<strong>National</strong> <strong>Marine</strong> <strong>Sanctuary</strong> Program (NMSP) regulationsdefine “historical <strong>resource</strong>” as any <strong>resource</strong> possessinghistorical, cultural, archaeological, or paleontological significance,including sites, contextual information, structures,districts and objects significantly associated with or representativeof earlier people, culture, maritime heritage, andhuman activities and events. Historical <strong>resource</strong>s include“submerged cultural <strong>resource</strong>s” and also include “historicalproperties,” as defined in the <strong>National</strong> Historic PreservationAct.The term “historical <strong>resource</strong>” as used in the NMSP regulationsalso encompasses prehistoric archaeological sites;therefore, the NMSP’s Maritime Heritage Program prefersthe term “maritime heritage <strong>resource</strong>.” “Maritime heritage<strong>resource</strong>” is defined as any shipwreck or other site or objectthat is of archaeological, historical, or cultural significancefound in, on or under the submerged lands, including sunkenState craft.Maritime heritage <strong>resource</strong>s in the <strong>Stellwagen</strong> <strong>Bank</strong> sanctuaryrequire management as mandated by the NMSAand sanctuary regulations. In addition, there is a limitedrelationship of maritime heritage <strong>resource</strong>s to biodiversityconservation consisting of the role that shipwreck structuresserve as substrate for epibenthic organisms and shelter forfishes and invertebrates that warrants consideration.St a t u sUncounted prehistoric and historic archaeological sites liewithin the <strong>Stellwagen</strong> <strong>Bank</strong> sanctuary. The sanctuary’s positionat the mouth of Massachusetts Bay places it astride thehistoric shipping routes and fishing grounds for such historicports as Gloucester, Salem, Boston, Plymouth and Provincetown.These ports have been centers of maritime activity inNew England for nearly 400 years. As a result of man’s longassociation with the sea, the sanctuary contains a broadcross-section of this nation’s maritime heritage. The onlyarchaeological <strong>resource</strong>s identified to date in the sanctuaryare shipwrecksThe <strong>Stellwagen</strong> <strong>Bank</strong> sanctuary has been actively pursuingmaritime heritage research since 2000. The sanctuaryhas relied heavily on a partnership with <strong>NOAA</strong>’s UnderseaResearch Center—University of Connecticut (NURC-UConn) to access appropriate tools, including side scansonar, remotely operated vehicles (ROVs) and skilled pilots,to investigate maritime heritage <strong>resource</strong>s. The sanctuaryhas also benefited greatly from the generosity of independentresearchers, such as John Fish and Arnold Carr of theAmerican Underwater Search and Survey, who have providedlocations or information about sanctuary maritime heritage<strong>resource</strong>s.The sanctuary’s research has been focused along two paths:locating maritime heritage <strong>resource</strong>s and characterizingthose <strong>resource</strong>s. Prior to 2000, the sanctuary was unawareof the precise location of any such sites within its boundaries.Since 2000, the sanctuary has conducted nine researchcruises that utilized side scan sonar to survey the seafloorand identify potential maritime heritage <strong>resource</strong>s. Thesesurveys have mapped 85 square kilometers (32.8 squaremiles) of the sanctuary’s seafloor, or approximately fourpercent of the sanctuary’s total area.As potential maritime heritage <strong>resource</strong>s were located, thesanctuary began to characterize the <strong>resource</strong> utilizing theappropriate technology. Maritime heritage <strong>resource</strong>s shallowerthan 130 feet were investigated by researchers utilizingSCUBA (Self-Contained Underwater Breathing Apparatus).Divers recorded diagnostic features with still andvideo photography, measurements and scaled drawings.Sites monitored repeatedly were examined for changes ineach vessel’s structure and artifact assemblages. Maritimeheritage <strong>resource</strong>s beyond recreational diving limits wereinvestigated with an ROV carrying lights and digital still andvideo cameras. The ROV’s cameras recorded diagnosticfeatures, and its scaling lasers provided dimensions of thesefeatures. The large size of several of the sanctuary’s shipwrecks,notably the Portland and Frank A. Palmer/Louise B.Crary, and the time-consuming delays to avoid entanglingfishing gear on these sites, have caused site characterizationto be ongoing.Beginning in 2003, the sanctuary instituted a monitoringprogram for the steamship Portland and Frank A. Palmer/Louise B. Crary. Each year since, the sanctuary researchershave returned to the sites with an ROV to monitor artifactsand structures for change. At both shipwreck sites, researchershave noted changes to artifact assemblages and deteriorationof wooden structure. The sanctuary also periodicallyrevisits other maritime heritage <strong>resource</strong>s to document sitechanges. The <strong>Stellwagen</strong> <strong>Bank</strong> sanctuary has adopted a policyof in situ preservation as its preferred preservation methodfor maritime heritage <strong>resource</strong>s. This policy is recognizedby the international community through the United NationsEducation, Scientific, and Cultural Organization (UNESCO)Convention on the Protection of Underwater Cultural Heritage’sobjectives and general principles.Maritime heritage <strong>resource</strong>s begin to deteriorate shortlyafter submersion in a saltwater environment. The physical120<strong>Stellwagen</strong> <strong>Bank</strong> <strong>National</strong> <strong>Marine</strong> <strong>Sanctuary</strong> Draft Management Plan/Environmental Assessment
and chemical oceanographic aspects of the ocean, such aswaves, currents, salinity, and pH erode and corrode culturalmaterial, while biological and biochemical activities oforganisms, such as wood boring mollusks and bacteria,contribute to the natural deterioration of archaeologicalsites. The specific environment in which an archaeologicalsite is located greatly influences how rapidly the site willdeteriorate. The sanctuary’s low energy deep muddy basinspreserve an archaeological site much longer than the muchmore dynamic top of <strong>Stellwagen</strong> <strong>Bank</strong>. Additionally, thecomposition of submerged artifacts greatly affects how longthe item will remain in the archeological record. In general,organic material, such as wood and fabric, does not last aslong as iron, brass or ceramics.Archaeological sites reach equilibrium with the environmentafter a period of deterioration. Corrosion productsenclose ironwork, insulating it from rapid oxidation. Likewise,anoxic sediment covers hull remains greatly reducingbiological and biochemical consumption. Archaeologicalsites can last for thousands of years, as evidenced by classicalGreek shipwrecks found in the Mediterranean Sea. Eventhough these ancient shipwrecks have deteriorated significantlysince their deposition, the sites maintain archaeologicalintegrity and can be invaluable gateways to learn aboutpast human activities. Disturbance by human impact canupset this natural equilibrium and accelerate disintegration.Pr e h i s to r i c ResourcesAncient geologic and glacial processes once exposed thesanctuary’s seafloor to the sun, allowing it to support floraand fauna that may have been utilized by the Paleo-Indianpeoples (Barber, 1979). Around 12,000 years ago, groupsof migratory humans, known as Paleo-Indians, inhabitedsouthern New England. The retreat of the Laurentide icesheet 21,000 to 16,000 years ago allowed these peopleaccess to <strong>Stellwagen</strong> <strong>Bank</strong>, which rose above the surroundingocean as a result of lower sea levels and the reboundof the Earth’s crust after the retreat of the heavy ice sheets(Funk, 1978; Barber, 1979).Although no archaeological evidence of Paleo-Indian inhabitationhas been found on <strong>Stellwagen</strong> <strong>Bank</strong>, sea level modelssuggest that the bank remained accessible to the Paleo-Indiansfor approximately 1,000 years. During this time, peoplelikely utilized the bank to hunt for land mammals, as a basefor fishing and hunting marine mammals, and for gatheringshellfish and vegetation (Barber, 1979). The possibility offinding Paleo-Indian cultural remains on <strong>Stellwagen</strong> <strong>Bank</strong>is supported by the recovery of mastodon skeletal remainsby local fishermen (Carr, 1990). Further geologic study,site modeling, and sampling will be necessary to determinethe potential for locating prehistoric cultural remains in thesanctuary.Native Americans developed complex societies in NewEngland during the approximately 12,000 years of humanhabitation prior to the arrival of Europeans. At the time ofEuropean contact Penobscot, Abenaki, Pequot, Massachusett,Narragansett, Wampanoag and Confederated Rivertribes inhabited the region surrounding Massachusetts Bay.These coastal tribes utilized the marine environment as theirancestors had, but it is unlikely that they ventured into thesanctuary’s waters considering the wealth of <strong>resource</strong>s closeto shore.Rising sea levels covered the bank within several millenniaof its exposure, displacing any Native Americans livingwithin the area to the edges of Massachusetts Bay, but notdiminishing their usage of marine <strong>resource</strong>s. The arrivalof Europeans in the New World dramatically amplified thequantity of maritime traffic on Massachusetts Bay.Historic ResourcesAs a result of four centuries of historic vessel traffic throughthe sanctuary, several hundred historic vessel losses arerecorded in the sanctuary’s vicinity. Primary causes ofvessel loss (shipwrecks) in the sanctuary fall into four broadclasses: (1) acts of war—naval engagements, piracy, lawenforcement; (2) natural forces—storms (gales/hurricanes);(3) human error—seamanship, fire, collision; and (4) abandonment—forthe reasons stated above, plus vessel conditionand economic reasons (Fish, 1989). The sanctuary’sminimum depth of 20 m (65 ft.) means that no vessel waslost in the sanctuary as a result of grounding or stranding.Vessels reported lost to either of these two causes are notconsidered to lie within the sanctuary.The ambiguity of location given for most maritime disasters,and particularly for sanctuary shipwrecks, generallyprecludes establishing statements about impacts to specific<strong>resource</strong>s. Ambiguity exists over the reported locations ofshipwrecks, particularly the types of vessel losses at sea. Apresumed nearest landfall is assigned when the shipwreckdoes not occur at a recognized landmark, i.e., on shore, onrocks, near a buoy marker or lightship. References such asoff-Provincetown, off-Cape Ann, off-Massachusetts Coast,or off-New England, or “left port never to be heard of again,”are frequently the only description of shipwreck locationsthat may be in the sanctuary. Additionally, for most colonialwriters, places of loss were far less important to record thanthe persons and property that were lost.Government data collection has been primarily aimed atidentifying and locating man-made and natural objects thatare hazards to navigation. These locations within the sanctuaryare approximated and not verified, because they do notpose a hazard to navigation. Further, reliable location informationis often in private hands (sport divers, researchers,fishermen), for whom personal interests generally precludemaking the information public.Most available published sources of shipwreck informationconcentrate on “romance of the sea” and/or major calamitiesand disasters; their audience is typically popular andnot scholarly. Many of these works are laundry lists of shipwrecks,often published without sources. Further, manyworks reflect a certain selective presentation of facts, suchas including only larger vessels or those carrying “valuable”cargo. Thus, precise statements of historic vessel losses inthe sanctuary are not possible.IV. Resource States 121
Fi g u r e 75. Historic p h o t o g r a p h o f t h e steamshipPo r t l a n d f r o m 1891. Th e Po r t l a n d s a n k w i t h a l lh a n d s d u r i n g t h e Po r t l a n d Ga l e in No v e m b e r 1898.Courtesy: LARC.Fi g u r e 76. Th e steamship Po r t l a n d’s l o c a t i o n in t h es a n c t u a r y w a s c o n f i r m e d b y <strong>NOAA</strong> s c i e n t i s t s in 2002.Depicted here is a side scan sonar image of the Portlandshowing it sitting upright on its keel with boiler uptakes andwalking beam engine projecting above the main deck. Courtesy:Klein Sonar Associates, Inc.VesselsSince the sanctuary began investigating its maritime heritage<strong>resource</strong>s in 2000, archaeologists have located 18 historicshipwreck sites and identified four of these shipwrecks byname. Historical records indicate that several hundredmore vessels sank within the sanctuary or its vicinity. Pastresearch expeditions have used remote sensing technology,such as side scan sonar and ROVs, to locate and identifyshipwreck sites. Archaeologists have also used SCUBA toinvestigate shallower shipwreck sites, such as the 5-mastedcoal schooner Paul Palmer that caught fire and sank offProvincetown in 1913.In 2002, a team of <strong>NOAA</strong> scientists confirmed that a shipwreckin the sanctuary was the side paddle wheel steamshipPortland. The wooden hulled steamship, built in 1889 bythe New England Shipbuilding Company of Bath, Maine,for the Portland Steam Packet Company, ran between Portland,Maine, and Boston, Massachusetts, from 1890 to 1898(Figure 75). At 85.6 m (281 ft.) long, the steamship wasone of the largest and best-appointed vessels afloat in NewEngland during the 1890s. The steamship sank with allhands on November 27, 1898 during a fierce storm, thereafterknown as the “Portland Gale.” Historians believe thatnearly 200 people lost their lives.Remains of the Portland include its upright and intact woodenhull, which has survived from the main deck level downto the keel (Figure 76). Machinery assemblages such as theboilers, paddle flanges and shaft, steam engine, walkingbeam and wooden A-frame are articulated and in their originalpositions. Smaller cultural artifacts such as plates andcups lie scattered inside and outside the hull (Figure 77).The Portland’s hull is draped with fishing nets and providessubstrate for sponges and anemones. In 2005, the Portlandwas listed on the <strong>National</strong> Register of Historic Places.Another visually spectacular shipwreck site is the wrecksof the 83.5-m (274 ft.) long 4-masted schooner Frank A.Palmer (Figure 78) and 81.4-m (267 ft.) long 5-mastedschooner Louise B. Crary (Figure 79), which sit upright onthe seafloor connected at their bows after colliding (Figure80). Both vessels were built at the turn of the century inBath, Maine, for the coal trade between the Chesapeake Bayand New England. While enroute to Boston, Massachusetts,from Hampton Roads, Virginia, with coal cargos, the FrankA. Palmer and Louise B. Crary collided on December 17,1902. Eleven of the twenty-one sailors onboard the schoonersperished during the accident or while awaiting rescuein a lifeboat. Both schooners are intact from keel to maindeck and have portions of their masts still standing. Surveyshave encountered cultural artifacts within the remains ofthe Frank A. Palmer captain’s cabin (Figure 81). In 2006,the Frank A. Palmer and Louise B. Crary were listed on the<strong>National</strong> Register of Historic Places.In addition to the Frank A. Palmer and Louise B. Crary,archaeologists have located and investigated several othercollier sites with varying degrees of preservation. Similar insize to the Frank A. Palmer, the shipwreck of the 5-mastedschooner Paul Palmer exemplifies the differences in sitepreservation as a result of the wrecking event and the environmentin which the shipwreck lies (Figure 82). While122<strong>Stellwagen</strong> <strong>Bank</strong> <strong>National</strong> <strong>Marine</strong> <strong>Sanctuary</strong> Draft Management Plan/Environmental Assessment
Fi g u r e 77. Fr a g i l e t e a c u p s a n d d i s h wa r e in t h e g a l l e ys u r v i v e d t h e Po r t l a n d’s p l u m m e t t o s e a f l o o r in 1898.The shipwreck is listed on the <strong>National</strong> Register of HistoricalPlaces and is the best preserved of any New England “nightboat” found to date. Source: <strong>NOAA</strong>/SBNMS, NURC-UConn,and the Science Channel.<strong>Stellwagen</strong> <strong>Bank</strong> caused the schooner’s structure to degradefaster than the more static environment in which the FrankA. Palmer rests. The schooner’s degradation has also beenhastened by impacts from commercial fishing. Evidence ofthese impacts is graphically demonstrated by a trawl net thathas become wrapped around the shipwreck’s windlass. Thesanctuary has documented recent impacts in the form ofbroken timbers and displaced anchors.Other collier sites represent much smaller vessels more typicalof the sailing vessels that plied the East Coast during thenineteenth and early twentieth centuries. The archaeologicalpreservation of these smaller collier shipwrecks variesFi g u r e 79. Hi s t o r i c a l p h o t o g r a p h o f t h e 5-m a s t e dc o a l s c h o o n e r Lo u i s e B Cr a r y.In 1902, the Louise B. Crary’s mate miscalculated his tackcausing his vessel to strike the Frank A. Palmer’s bow. Courtesy:Maine Maritime Museum.Fi g u r e 78. Hi s t o r i c a l p h o t o g r a p h o f t h e 4-m a s t e dc o a l s c h o o n e r Fr a n k A Pa l m e r.The Maine built Frank A. Palmer was the longest 4-mastedschooner ever built. Courtesy: Maine Maritime Museum.Fi g u r e 80. In 2002, <strong>NOAA</strong> s c i e n t i s t s c o n f i r m e d t h el o c a t i o n o f t h e s c h o o n e r s Fr a n k A. Pa l m e r a n d Lo u i s eB. Cr a r y in t h e St e l lwa g e n Ba n k s a n c t u a r y.Depicted is a side-scan sonar image of the two intact vessels,connected at their bows, in the same orientation in whichthey sank. Source: <strong>NOAA</strong>/SBNMS and NURC-UConn.sailing south from Maine to the Chesapeake in ballast,the schooner’s forecastle caught fire off Highland Light in1913. Flames quickly engulfed the schooner, thwartingefforts to extinguish the flames with the schooner’s pumps.The vessel’s crew escaped the fire by boarding a tug thatapproached the schooner to help fight the blaze. Burned tothe waterline, the schooner sank on top of <strong>Stellwagen</strong> <strong>Bank</strong>.In 2007, the Paul Palmer was listed on the <strong>National</strong> Registerof Historic Places.Today, the Paul Palmer’s remains consist of its wooden hull,intact to the turn of the bilge, keelsons, a pile of anchorchain and the schooner’s windlass (Figure 83). Ship fittings,such as bitts, a davit, anchors and rigging components, liethroughout the site. While the fire likely destroyed muchof the vessel’s hull, the dynamic environment on top ofIV. Resource States 123
Fi g u r e 81. Th e Fr a n k A. Pa l m e r’s s t e r n c a b i n c o n t a i n st h e r e m a i n s o f t h e c a p ta i n’s s i n k a n d t o i l e t.The Frank A. Palmer and Louise B. Crary are listed on the<strong>National</strong> Register of Historic Places and are the best preservedexamples of New England coal schooners in the archaeologicalrecord located thus far. Source: <strong>NOAA</strong>/SBNMS andNURC-UConn.widely. One 32 m (100 ft.) long vessel is nearly intact upto its deck level. Features of the site include copper-alloysheathed hull planking, wooden hanging knees, and avariety of ship fittings and artifacts (Figure 84). In contrast,the hull remains of another collier are only represented byeroded frames protruding centimeters from a pile of coal35 m (114.8 ft.) long. Very few ship fittings and no smallerartifacts were found on this site (Figure 85). Both vesselswere likely two-masted schooners that carried a variety ofcargos, but happened to be loaded with coal when theysank. While both vessels lie in water of similar depth, themore intact vessel lies in an area that is less frequently fishedby bottom trawl gear.Fi g u r e 82. Hi s t o r i c a l p o s t c a r d o f t h e 5-m a s t e dc o a l s c h o o n e r Pa u l Pa l m e r o f f l o a d i n g c o a l in Ne wHa m p s h i r e .The Paul Palmer caught fire and sank off Cape Cod in 1913while en-route to Virginia. Courtesy: LARC.The granite industry is another coastal trade represented bya sanctuary shipwreck. In the remains of this sailing vessel,the cargo of granite slabs vary in size, ranging from blocksmeasuring 2 m long by .5 m wide, to others stretching over3 m long. Approximately 40 slabs were contained withinthe vessel’s hold (Figure 86). The most common slab shapemeasures 3 m long by 2 m wide with a manhole bored intoits center. Blocks of this variety were used to cover sewerbasins that captured the drainage from street gutters. Theuniform shape of the manholes suggests that they werebored using a large diameter drill, a technology first used inthe second half of the 19th century.After colliers, the second most common variety of shipwrecklocated thus far in the sanctuary is 20th century commercialfishing vessels. Of these, wooden-hulled eastern-rig draggersrepresent the majority. Constructed from the 1920sthrough the 1970s, these side trawlers exemplify the transitionfrom hook and line fishing to engine-powered trawling(Figure 87). Several of the eastern-rig dragger shipwrecks inthe sanctuary are remarkably intact, with extant pilot housesand masts. Others are much more fragmentary as a result ofdamage incurred from the impact of nets and trawl doors ofsuccessive generations of fishing vessels.Ai r c r a f tAt least one aircraft crash site is believed to be located withinthe sanctuary. Divers reported finding a P-38 Lightningon the western edge of <strong>Stellwagen</strong> <strong>Bank</strong>. Fishermen alsoreport recovering military aircraft parts from a site north of<strong>Stellwagen</strong> <strong>Bank</strong> (B. Lee, pers. comm., 2004).Pr e s s u r e s<strong>Sanctuary</strong> shipwreck sites below the zone of storm wavedisturbance (~85 m) generally reside in a depositional envi-Fi g u r e 83. Th e Pa u l Pa l m e r r e s t s o n t o p o fSt e l lwa g e n Ba n k w i t h i t s w o o d e n f r a m e s a n d h u l lp l a n k i n g p r o t r u d i n g u p f r o m t h e s a n d.Substantial information can be learned about the role coalschooners played in the growth of New England by examiningPaul Palmer’s archaeological remains. Source: <strong>NOAA</strong>/SBNMS.124<strong>Stellwagen</strong> <strong>Bank</strong> <strong>National</strong> <strong>Marine</strong> <strong>Sanctuary</strong> Draft Management Plan/Environmental Assessment
Fi g u r e 84. Ar t i fa c t s, s u c h a s t h e b r a s s h a n d b e l l a n dc e r a m i c d i s h e s s e e n h e r e, a r e w e l l p r e s e rv e d o n t h i sw o o d e n h u l l e d s h i p w r e c k w i t h a c o a l c a r g o.The sanctuary is studying this vessel to discover its identityand learn about life onboard a merchant sailing vessel in theNew England coasting trade. Source: <strong>NOAA</strong>/SBNMS andNURC-UConn.Fi g u r e 86. Th i s s h i p w r e c k’s g r a n i t e b l o c k c a r g o w a sd e s t i n e d f o r u s e in t h e c o n s t r u c t i o n o f s i d e wa l k s a n ds e w e r s y s t e m s.Granite transportation supported a large fleet of sailing vesselsduring the 19th and early 20th centuries. Source: <strong>NOAA</strong>/SBNMS and NURC-UConn.Fi g u r e 85. Th e c o a l c a r g o d e p i c t e d in t h i sp h o t o g r a p h c o v e r s t h e r e m a i n s o f a s h i p w r e c k.Bottom trawling has destroyed the vessel’s structure abovethe sediment and removed all the durable artifacts, such asanchors and iron fittings. Source: <strong>NOAA</strong>/SBNMS and NURC-UConn.ronment of little natural disturbance. Consequently, thechief impacts to archaeological sites in this realm resultfrom fishing activities. The sanctuary’s maritime heritage<strong>resource</strong>s have been adversely impacted by fishing activitiesand are highly susceptible to future damage due largely totwo factors: structural materials and fishing impacts. Everymaritime heritage <strong>resource</strong> located to date is a shipwreckwith a wooden hull, and much of the sanctuary’s seafloor isregularly accessed by a variety of fishing gears. While thesanctuary’s cold deep water helps preserve the shipwreck’sorganic structure, wooden hulls slowly degrade over timebecoming very fragile. The ongoing characterization of thesanctuary’s maritime heritage <strong>resource</strong>s continues to revealthe results of past damaging interactions between historicshipwrecks and fishing gear. Other potential anthropogenicpressures on maritime heritage <strong>resource</strong>s include SCUBAdiving and remote sensing.Fi s h i n gInteractions between fishing gear (mobile and fixed gear aswell as hook and line) and many of the sanctuary’s maritimeheritage <strong>resource</strong>s have resulted in the degradation ofthe shipwrecks’ archaeological integrity, reduction of theirhistorical/archaeological significance, and diminishment oftheir aesthetic qualities. Currently, reference material mainlyfocuses on the impacts of fishing on marine habitats andthe environment (Dorsey and Pederson, 1998; Smith et al.,2003; Tudela, 2004). <strong>Marine</strong> archaeological literature hasnot yet adequately addressed fishing impacts to maritimeheritage <strong>resource</strong>s.Many recreational and commercial fishermen intentionallytarget shipwrecks due to the higher density of fish typicallyfound around structures that rise above the surroundingseafloor. By targeting these non-renewable <strong>resource</strong>s, irreparabledamage is done. A single impact from fishing gearcan cause extensive damage, compromising the informationcontained within the archaeological site.While some fishing gear impacts a site momentarily andthen continues along without getting hung up, other gearmay become tangled on the shipwreck, and then ultimatelyabandoned. The lost gear provides direct evidence of theinteraction between fishing and maritime heritage <strong>resource</strong>s.Eleven of the eighteen archaeological sites located withinthe sanctuary exhibit entangled fishing gear. The discard-IV. Resource States 125
Fi g u r e 87. Ma n yEa s t e r n r i gd r a g g e r s similart o t h e o n ep i c t u r e d h e r es a n k within t h eSt e l lwa g e n Ba n ks a n c t u a r y a n d a r eb e i n g d o c u m e n t e db y s a n c t u a r ya r c h a e o l o g i s t s .This style of fishingtrawler, common tothe waters of MassachusettsBay in the20th Century, is a transitionaldesign bridgingthe gap betweenearlier wooden sailingschooners andmodern-day steeltrawlers. Source:<strong>NOAA</strong>/SBNMS.ed gear presents a serious safety and operations hazard toSCUBA divers and remote sensing equipment, such as sidescan sonars, ROVs and Autonomous Underwater Vehicles(AUVs). The nets, lines and cables from lost gear close offcompletely or limit the site’s accessibility to archaeologists,recreational SCUBA divers and the interested public.Discarded nets and line also present an entanglementhazard to marine life.Mobile Gear ImpactsMobile fishing gear (otter trawls, beam trawls, shellfishdredges) has had the greatest impact on maritime heritage<strong>resource</strong>s. Mobile fishing gear components have beenfound on eleven historic shipwrecks. These towed nets ordredges, often weighing hundreds of pounds, roll or aredragged across the seafloor. When the net encounters awooden shipwreck rising above the seafloor, it interacts withthe shipwreck in one of three ways:1) The gear breaks apart the shipwreck’s structure;2) The gear rolls over the shipwreck, damaging fragile structure;or3) The gear catches on the shipwreck, stopping the vessel.If the gear can be pulled free it usually results in partialdestruction of the shipwreck. Oftentimes, pieces of the netare left behind. Less frequently, the gear is so entangledwith the shipwreck’s structure that entire nets and even trawldoors are lost.Considerable damage to the shipwreck’s structure results inall three situations. In addition, trawl nets often remove artifactsfrom the site. Fishermen frequently snag and recoveranchors, windlasses, pumps and other assorted ship fittings.The removal of this material is particularly harmful to thesite’s archaeological integrity. In many cases, fishermenusing mobile gear seek to avoid shipwrecks; however, somefishermen choose to tow their nets as close as possible tothe shipwreck to catch fish inhabiting the shipwreck. Thisbehavior has the potential to damage or destroy artifactssurrounding the shipwreck, damage the shipwreck throughcontact with the trawl doors, and potentially damage orentangle the main shipwreck structure.Two examples of negative mobile fishing gear impacts arefound on the steamship Portland and the schooner PaulPalmer. The Portland has a complete otter trawl net, includingrollers and a trawl door, wrapped around its bow andstarboard side. The wire tow rope has cut deeply into thesteamship’s stempost, while one of the trawl doors lies onthe main deck (Figure 88). The net is tangled with andextends nearly the length of the starboard side forward ofthe boiler uptakes. More wire rope is draped across the topof the boiler uptakes. The trawl net has damaged portionsof the wreck and greatly hampers the sanctuary’s ability to126<strong>Stellwagen</strong> <strong>Bank</strong> <strong>National</strong> <strong>Marine</strong> <strong>Sanctuary</strong> Draft Management Plan/Environmental Assessment
archaeologically investigate the shipwreck. The net and itswire tow rope present a severe entanglement risk for theROV vehicle used to study the site.The schooner Paul Palmer also had a trawl net wrappedaround its bow. The net and rollers were entangled with thesite’s windlass and chain pile, and likely altered the orientationof the windlass when it was snagged (Figure 89). Thenet posed an entanglement hazard for SCUBA divers andmarine life. <strong>NOAA</strong> divers removed the net in September2006.Fixed Gear ImpactsFixed fishing gear (gillnets and lobstertrawls) has also negatively impactedsanctuary maritime heritage <strong>resource</strong>s.Fixed fishing gear components havebeen found on six historic shipwrecks.The initial placement of the gear maydamage a <strong>resource</strong> if the gillnet anchoror lobster pot falls directly on a maritimeheritage <strong>resource</strong> or its associatedartifacts; however, the greatest damageresults when fishermen attempt to recovertheir gear. If the gear has not alreadybecome entangled in the shipwreck’sstructure, pulling the gear to the surfacecan ensnare it. Once gear is firmly entangled,a fisherman will likely use the fullpower of his or her net or pot hauler andboat to free the gear. The high tensionexerted on the lines easily snaps fragilewooden structure.Entangled fixed gear continues to degradethe shipwreck by blocking access to the<strong>resource</strong>. SCUBA divers cannot safelyapproach the gillnet, for example, andresearchers are unable to document the<strong>resource</strong> and share the information withthe public. The Frank A. Palmer andLouise B. Crary have been negativelyimpacted by gillnets that are entangledon the shipwrecks. The Louise B. Crary’sbow is enshrouded with a gillnet thatcovers the forecastle and forward deckhouse (Figure 90). The net prevents thearchaeological examination of this area.A gill net also stretches between the twoschooners preventing the archaeologicalexamination of the collision point.Hook and Line ImpactsHook and line gear has been found onfour historic shipwrecks. Hook and linebottom fishermen often target wrecks tocatch the fish inhabiting the shipwrecks’structure. Boats often anchor to maintainposition, risking anchor damageto the shipwreck and any surroundingdebris fields. Heavy lead jigs, weighing up to two poundsare repeatedly raised and lowered to attract fish (Figure 91).When a jig comes into contact with a maritime heritage<strong>resource</strong>, it has the potential to break fragile artifacts madefrom glass or ceramics. Frequently, fishermen snag theirtackle on the shipwreck’s structure. Attempts to free the linemay damage the <strong>resource</strong>. If the jig is firmly stuck, the fishermanwill break or cut the line, which may then fall acrossthe shipwreck. Lost fishing line limits access to a shipwreckFi g u r e 88. Wi r e r o p e associated w i t h a t r aw l n e t c u t s i n t o t h e steamshipPo r t l a n d’s b o w .The negative impacts of commercial fishing activities are well documented on thewreck of the Portland. Source: <strong>NOAA</strong>/SBNMS and NURC-UConn.Fi g u r e 89. Th i s l a r g e t r aw l n e t w a s o n c e w r a p p e d a r o u n d t h e s c h o o n e rPa u l Pa l m e r’s w i n d l a s s , w h e r e it w a s a h a z a r d t o SCUBA d i v e r s a n d m a r i n el i f e.In 2006, <strong>NOAA</strong> divers removed the net to facilitate the documentation of the schooner’swindlass. Courtesy: Tane Casserley, <strong>NOAA</strong> Maritime Heritage Program.IV. Resource States 127
Fi g u r e 90. Gi l l n e t s c o v e r t h e s c h o o n e r Lo u i s e B. Cr a r y’s b o w .The fishing gear entangled in this shipwreck prevents archaeologists from documentingmost of the wreck’s bow area and main deck space. Source: <strong>NOAA</strong>/SBNMS, NURC-UConn and the Science Channel.area in 2005, researchers found severalfishing lines crossing the area (Figure 92).The lines prevented the researchers frommaneuvering their ROV into the area toinvestigate the artifacts contained withinthe cabin. Additionally, an unseen fishingline entangled and fouled a ROVthruster, preventing its operation andforcing termination of the dive.Fi g u r e 91. Ji g s a r e e v i d e n c e o f h o o k a n d l i n e fishing a c t i v i t y o n t h es c h o o n e r Pa u l Pa l m e r.Lost fishing gear poses a hazard to divers and degrades the archaeological integrityof the shipwreck. Source: <strong>NOAA</strong>/SBNMS.in much the same way a trawl net or a gillnet limits access toa shipwreck. Additionally, single strands of fishing line aredifficult to see underwater, making entanglement of an ROVor a SCUBA diver a possibility.An example of the impact of lost fishing line on a shipwreckis found on the Frank A. Palmer. A 2004 archaeologicalinvestigation of the site encountered no lost fishing linescrossing the aft deckhouse space. Returning to the sameDivingWhile SCUBA diving will not necessarilydamage a shipwreck, certain divingpractices and activities have the potentialto impact the sanctuary’s historicalintegrity (Edney, 2006). In comparisonto the rocky shorelines and near shorewaters of Massachusetts, the sanctuaryhas been visited by considerably fewerSCUBA divers. However, many divershave communicated their interest in visitingthe sanctuary’s shipwrecks. WhenSCUBA diving is conducted in the sanctuary,the dive location is usually near oron a maritime heritage <strong>resource</strong>.The techniques and practices, both aboveand underwater, associated with SCUBAdiving on a shipwreck may negativelyimpact the site and its historic <strong>resource</strong>sif not done with care and <strong>resource</strong> preservationin mind. To access sites, boatscarrying divers may drag their anchoracross the seafloor and through the debrisfield of the archaeological site. Theanchor may catch on the structure of themaritime heritage <strong>resource</strong>. Anchors ordown weights dropped from a boat canplummet directly onto a fragile woodenhull and/or the associated artifacts, causingdamage. Repetitive anchoring on,or securing a down line to, a maritimeheritage <strong>resource</strong> can increase its rate ofstructural deterioration and reduce thesite’s archeological and historical significance.Once underwater, divers’ actions canbe low-impact, such as observing theshipwrecks and their marine life orphotographing, videotaping the site. Buthigh-impact actions, such as souvenircollecting, remove artifacts and reduce the archaeologicalsignificance of the sites. Divers who remove tightly securedartifacts often damage or destroy larger areas of the sites.While prohibited by sanctuary regulations, artifact collectingstill occurs in <strong>National</strong> <strong>Marine</strong> Sanctuaries (Craft, Ferguson,Jernigan, King, Parrott, Stocks, and Wilson v. <strong>NOAA</strong>, 6O.R.W. 150 United States Department of Commerce, 1990;Craft, Ferguson, Jernigan, King, Parrott, Stocks, and Wilson128<strong>Stellwagen</strong> <strong>Bank</strong> <strong>National</strong> <strong>Marine</strong> <strong>Sanctuary</strong> Draft Management Plan/Environmental Assessment
v NPS, <strong>NOAA</strong>, and <strong>National</strong> <strong>Marine</strong> Fisheries, 34 F.d 918.United States Court of Appeals, 1994).Artifacts lose their provenance once removed from a siteand are no longer able to provide as much informationabout their history. Additionally, artifacts recovered from themarine environment deteriorate if not properly conservedand thus lose their ability to educate the general public.Artifact collecting also deprives future SCUBA divers of theexcitement of exploring an “untouched” shipwreck.Re m o t e Se n s i n gRemote sensing allows individuals to use technology toexplore the underwater environment without personallyentering the water. Technologies vary from side scan sonarto ROVs and AUVs. Most remote sensing technologies arenot designed to physically interact with maritime heritage<strong>resource</strong>s and can do damage if unintentional contact ismade.Towed sensors, such as side scan sonars, drop cameras andmagnetometers, can cause damage by striking or becomingentangled in a maritime heritage <strong>resource</strong>. Damage to the<strong>resource</strong> is then exacerbated when a remote sensing operatorattempts to free an entangled piece of expensive marinetechnology. Remotely operated vehicles are designed tooperate in proximity to maritime heritage <strong>resource</strong>s and arecapable of interacting with the <strong>resource</strong>s using manipulatorarms. Remotely operated vehicle operators can removeor disturb archaeological <strong>resource</strong>s in a manner similar todivers.Entanglement risks for ROVs are especially great in the<strong>Stellwagen</strong> <strong>Bank</strong> sanctuary due to derelict fishing gearthat entangles many of the shipwreck structures. Freeingan ensnared ROV will likely damage amaritime heritage <strong>resource</strong>. Submersibles,manned underwater vehicles, posethe same hazards to maritime heritage<strong>resource</strong>s as ROVs.Cu r r e n t Pr o t e c t i o nThe sanctuary’s mandate to protect andmanage maritime heritage <strong>resource</strong>sarises from various federal regulationsand laws. The sanctuary boundaryencompasses an 842-square mile area ofseafloor outside of the territorial sea ofMassachusetts Bay and does not overlapwith the jurisdiction of the Commonwealthof Massachusetts.The protection of maritime heritage<strong>resource</strong>s is provided through the followinglaws and regulations:• Antiquities Act of 1906• Historic Sites Act of 1935• Archaeological and Historic PreservationAct of 1960• <strong>National</strong> Historic Preservation Act (NHPA) of 1966 (16U.S.C. § 470 et seq.)• Department of Transportation Act of 1966 (section 4(f))• Presidential Order 11593 of 1971• <strong>National</strong> Environmental Policy Act (NEPA) (Section 101(b)(4))• <strong>National</strong> <strong>Marine</strong> Sanctuaries Act (NMSA) of 1972 (16U.S.C. § 1432 et seq.)• <strong>Stellwagen</strong> <strong>Bank</strong> <strong>National</strong> <strong>Marine</strong> <strong>Sanctuary</strong> Regulationsof 1992 (15 C.F.R § Subpart N)The NMSA mandates that the <strong>National</strong> <strong>Marine</strong> <strong>Sanctuary</strong>Program manage maritime heritage <strong>resource</strong>s in a fashionthat protects the <strong>resource</strong>s while facilitating compatiblepublic and private use of the <strong>resource</strong>s. <strong>National</strong> <strong>Marine</strong><strong>Sanctuary</strong> Program regulations incorporate all laws andregulations of the Federal Archaeology Program, such asthe <strong>National</strong> Historic Preservation Act. These regulationsrequire that a heritage <strong>resource</strong> inventory and managementprogram be developed for each site, that federal activitiesthat may affect historic and cultural <strong>resource</strong>s be undertakenin such a way as to prevent harm to historic <strong>resource</strong>s, andthat the <strong>Sanctuary</strong> Program nominate potentially eligiblesites to the <strong>National</strong> Register of Historic Places.The <strong>Sanctuary</strong> Program must also ensure mitigation of anyfederally-funded activity that might threaten historical andcultural <strong>resource</strong>s under its control to facilitate the protectionof these <strong>resource</strong>s. The <strong>Sanctuary</strong> Program is requiredby Section 106 of the <strong>National</strong> Historic Preservation Act of1966 to allow the Advisory Council on Historic Preservationan opportunity to comment on all sanctuary actions affectinghistoric <strong>resource</strong>s in the sanctuary.Fi g u r e 92. Br a i d e d a n d m o n o f i l a m e n t fishing l i n e is c a u g h t a r o u n d t h eFr a n k A. Pa l m e r’s s t e e r i n g w h e e l.Fishing line stretched across the schooner’s stern prevents the complete documentationof this area, which would provide important information about the vessel’screw. Source: <strong>NOAA</strong>/SBNMS and NURC-UConn.IV. Resource States 129
Current sanctuary regulations prohibit moving, removing orinjuring, or attempting to move, remove or injure a sanctuaryhistorical <strong>resource</strong> except as an incidental result of traditionalfishing operations. These regulations also prohibitdrilling into, dredging or otherwise altering the seabed ofthe sanctuary; or constructing, placing or abandoning anystructure, material or other matter on the seabed of the sanctuary,except as an incidental result of an anchoring vessel,traditional fishing operations; or the installation of navigationalaids. Lastly, sanctuary regulations prohibit possessingwithin the sanctuary (regardless of where taken, moved orremoved from), except as necessary for valid law enforcementpurposes, any historic <strong>resource</strong>.130<strong>Stellwagen</strong> <strong>Bank</strong> <strong>National</strong> <strong>Marine</strong> <strong>Sanctuary</strong> Draft Management Plan/Environmental Assessment