2012 Half Year Results Presentation - Antofagasta plc
2012 Half Year Results Presentation - Antofagasta plc
2012 Half Year Results Presentation - Antofagasta plc
- No tags were found...

Create successful ePaper yourself
Turn your PDF publications into a flip-book with our unique Google optimized e-Paper software.
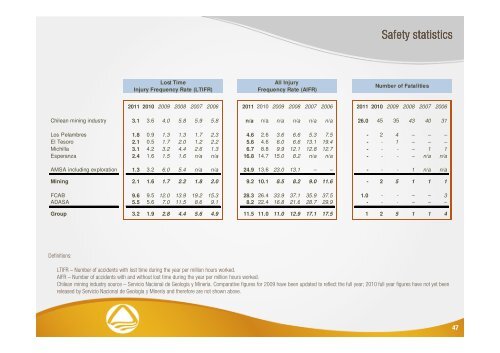
Safety statisticsLost TimeInjury Frequency Rate (LTIFR)All InjuryFrequency Rate (AIFR)Number of Fatalities2011 2010 2009 2008 2007 2006 2011 2010 2009 2008 2007 2006 2011 2010 2009 2008 2007 2006Chilean mining industry 3.1 3.6 4.0 5.8 5.9 5.8 n/a n/a n/a n/a n/a n/a 26.0 45 35 43 40 31Los Pelambres 1.8 0.9 1.3 1.3 1.7 2.3 4.6 2.6 3.6 6.6 5.3 7.5 - 2 4 – – –El Tesoro 2.1 0.5 1.7 2.0 1.2 2.2 5.6 4.6 6.0 6.6 13.1 19.4 - - 1 – – –Michilla 3.1 4.2 3.2 4.4 2.6 1.3 6.7 8.8 9.9 12.1 12.8 12.7 - - - – 1 1Esperanza 2.4 1.6 1.5 1.6 n/a n/a 16.8 14.7 15.0 8.2 n/a n/a - - - – n/a n/aAMSA including exploration 1.3 3.2 6.0 5.4 n/a n/a 24.9 13.6 23.0 13.1 – – - - - 1 n/a n/aMining 2.1 1.6 1.7 2.2 1.8 2.0 9.2 10.1 8.5 8.2 9.0 11.6 - 2 5 1 1 1FCAB 9.6 9.5 12.0 13.9 19.2 15.3 28.3 26.4 33.9 37.1 35.9 37.5 1.0 - - – – 3ADASA 5.5 5.6 7.0 11.5 8.6 9.1 8.2 22.4 16.8 21.6 28.7 29.9 - - - – – –Group 3.2 1.9 2.8 4.4 5.6 4.9 11.5 11.0 11.0 12.9 17.1 17.5 1 2 5 1 1 4Definitions:LTIFR – Number of accidents with lost time during the year per million hours worked.AIFR – Number of accidents with and without lost time during the year per million hours worked.Chilean mining industry source – Servicio Nacional de Geología y Minería. Comparative figures for 2009 have been updated to reflect the full year; 2010 full year figures have not yet beenreleased by Servicio Nacional de Geología y Minería and therefore are not shown above.47