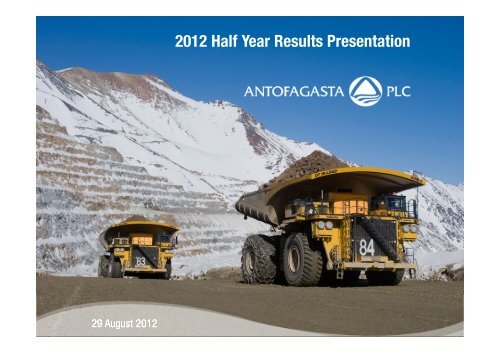
2012 Half Year Results Presentation - Antofagasta plc
2012 Half Year Results Presentation - Antofagasta plc
2012 Half Year Results Presentation - Antofagasta plc
- No tags were found...
You also want an ePaper? Increase the reach of your titles
YUMPU automatically turns print PDFs into web optimized ePapers that Google loves.
<strong>2012</strong> <strong>Half</strong> <strong>Year</strong> <strong>Results</strong> <strong>Presentation</strong>29 August <strong>2012</strong>
HighlightsH1 performance• Strong production growth versus H1 2011 to 336,000 tonnes coppero136,100 ounces gold, 6,500 tonnes molybdenum• Revenue increased by 3.5% to US$3.2 billionoIncreased production offsetting a decrease in average market copper prices• Interim dividend of 8.5 cents, representing a 6% increase on 2011• Continued progress in optimising the reliability and performance of Esperanza• Net cash costs down 6.3% to 98.9c/lboPre-credit costs relatively stable at 160.8 c/lb in H1 <strong>2012</strong> (2011 H1 - 157.8 c/lb)• <strong>2012</strong> FY forecast for copper production remains at approximately 700,000 tonnesProjects and Growth• Antucoya project development continuing, with first production expected in H2 2014• Feasibility and pre-feasibility studies in the key growth areas of the Centinela Mining District and LosPelambres respectively as well as at the Twin Metals pre-feasibility study continue to advance3
Operational <strong>Results</strong>
Copper production 2011 H1 – <strong>2012</strong> H1 (‘000 tonnes)Realising strongproduction growth16%3933682895(4)2011 H1 Los PelambresEl TesoroMichillaEsperanza<strong>2012</strong> H1(197)(53)(18)(68)Molybdenum (‘000 tonnes) Gold (‘000(ounces)35%92%4.86.5711362011 H1 <strong>2012</strong> H12011 H1 <strong>2012</strong> H15
Esperanza• H1 <strong>2012</strong> production of 68,200 tonnes of coppero more than doubled compared to 29,300 tonnes in H1 2011,reflecting increased throughput• During H1 <strong>2012</strong> Esperanza has continued to optimise thereliability and performance of the operation• Currently two areas of focus:144.927.1114.153.365.372.476.579.770.459.1 61.7 58.9o Tailings thickeners – two additional thickeners planned to beinstalled during 2013Q1 '11 Q2 '11 Q3 '11 Q4 '11 Q1 '12 Q2 '12o Capacity of the grinding line – engineering study in progress toestablish additional equipment required. Work expected to takeplace through 2013 and into 2014• <strong>2012</strong> forecasts:o Approximately 160,000 tonnes copper and 240,000 ounces goldo Net cash costs: 75 c/lbThroughput (‘000 tpd)Cash Cost (cents per pound)6
105.6Weighted average cash cost including by-productcredits 2011H1 – <strong>2012</strong>H1 (c/lblb)Competitive and stablecost position(4.8) (0.2)2.398.9(4.0)2011H1Los PelambresCommodity prices and cash costsEsperanzaEl TesoroMichilla<strong>2012</strong>H12011 copper cost curve (ranked(by C1)359373 373400327267 271300155 161129 1371201119932 8796 104 1022007 2008 2009 2010 2011 <strong>2012</strong> H1Realised copper price (c/lb) Pre-credit cash costs (c/lb) Cash Cost (including by product credits)20010000% 50%100%ESP MLP MET MIC <strong>Antofagasta</strong>-1007
Pricing environment and outlook500LME Copper Price2.000London Gold Price20Molybdenum Price4501.9001.80019184001.700171.600163501.500153001.4001.30014132501.200121.100112001.00010• Average LME copper price in H1 <strong>2012</strong> of 367 c/lb (H1 2011 – 426 c/lb; H2 2011 – 374 c/lb)• <strong>Antofagasta</strong>’s average realised copper price in <strong>2012</strong> H1 – 373 c/lb (H1 2011 – 423 c/lb)• Copper inventories remain at low levels and have fallen 20% during <strong>2012</strong> year to date• Analysts forecast a refined copper deficit of about 250,000 tonnes for <strong>2012</strong>• Market expectations are positive about the copper price with a potential for upside from current pricing levels• Long term fundamentals remain healthy and the general outlook for copper is solid although the financial problems in the Eurozone are expected to continue to impact the market in the short term8
Financial <strong>Results</strong>
Financial highlights<strong>2012</strong> H1 2011 H1 12H1 vs. 11H1Turnover (US$m) 3,161 3,054 3%EBITDA (US$m) 1,841 1,947 (5%)Profit before tax 1,563 1,692 (8%)Profit after tax 1,076 1,172 (8%)Earnings per share (cents) 65.5 70.6 (7%)Ordinary dividends per share (cents) 8.5 8.0 6%10
EBITDA reconciliationEBITDA <strong>2012</strong> H1 v/s 2011 H1 – Variance analysis (US$ million)1,947269 111226 4(114) (31) (2)(41) (13)1 1,841(318)Copper RevenuesBy Product RevenuesMining CostsOthersUS$ (48) mUS$ 142 mUS$ (145) mUS$ (55) m11
Net income reconciliationNet income <strong>2012</strong> H1 v/s 2011 H1 – Variance analysis (US$ million)696.246.4 646.2(105.3)3.3(25.7) (0.9)32.212
1,769Cash flow <strong>2012</strong> H1(US$ million)3,280(540) (24)(147) (2) (20)(355)(277) 53,353(338)Initial cash at 1stJanuary <strong>2012</strong>Cash flow fromoperations andassociatesTax outflow Net interest Net loans Acquisition ofavailable-for-saleinvestmentsAcquisition andcapitalcontribution toassociatesDividends to A<strong>plc</strong>shldrsDividends tominority shldrs ofsubsidiariesNet capex (fixedassets)ExchangeFinal cash at30th June <strong>2012</strong>Net cash position – Gross basis (US$ million)3,353Net cash position – Attributable basis (US$ million)3,015(2,008)1,345(1,371)1,644Cash balanceDebtNet cash positionCash balanceDebtNet cash position13
Consistently strong capitalreturnsDividends per share (cents) and payout ratio109%• Consistent record of significant capital returns toshareholders over several years• <strong>2012</strong> H1 interim dividend of 8.5 cents per share(2011 H1 – 8.0 cents)35% 35%100.035%• Appropriate level of final dividend to be determinedat the year end51.024.014.012.012.05.6 6.03.4 3.4 4.0 8.0 8.52008 2009 2010 2011 <strong>2012</strong> H1Interim dividends Final dividends Special dividends Payout ratioo Special dividends recommended at year-end whenappropriate taking into consideration profits levels,existing cash position and expected fundingcommitments14
Projects and Growth Opportunities
Growth opportunitiesGroup exploration andevaluation expenditure (US$ m)300.0Mineral Resources (includingore reserves)(billiontonnes)13.4 13.7215.4175.79.2132.499.054.967.160.032.535.883.0124.322.4 31.3 39.02008 2009 2010 2011 <strong>2012</strong>EH1H2Indicativeprojecttimeline3.24.46.42006 2007 2008 2009 2010 2011(The above mineral resources relates only to the Group’s Chilean subsidiaries anddo not include amounts relating to the Reko Diq joint venture or Twin Metals)16
Antucoya• Development of Antucoya project continued to progress during H1<strong>2012</strong>, with all EPC contracts now executed• Transaction with Marubeni Corporation, to become a 30% partnerclosed in July <strong>2012</strong>• SX-EW operation with an annual cathode production of approximately80,000 tonnes with cash costs expected to be 155c/lb on averageover the life of the operation• Total development cost expected to be $1.7 bn• Construction expected to be completed in H2 201417
Centinela Mining District(formerlySierra Gorda District)Esperanza Sur was formerly known as Telégrafo, Encuentro was formerly known as Caracoles andPenacho Blanco was formerly known as Centinela18
• Centinela Mining District feasibility study commenced at the end of 2011• Feasibility study now envisages a phasing of the development of the District• Initial focus on the Esperanza Sur sulphide and Encuentro oxide projectso Esperanza SurPotential production of ~140kt of copper and 160koz of gold over first 10 years of operationPotential capex of ~$3.5bno Encuentro oxides Potential production of ~50kt per year for 8 years utilising El Tesoro SX-EW plant from 2016Potential capex of ~$0.6bn• Study expected to continue through into 2013 with possible approval of the projects in 2014• To be followed by Encuentro sulphide projecto Potential production of 140-160kt of copper and 160 -180koz of gold possibly from 2021Centinela Mining District(formerlySierra Gorda District)• Continuing exploration and drilling programme across the rest of the highly prospective Distrito be followed by the Encuentrosulphide project.Esperanza SurEncuentroPenacho Blanco19
Los Pelambres• Total mineral resources of 6.0 billion tonnes @ 0.51%copper plus molybdenum and gold credits• Potential to more than double existing capacity with apossible phased project development process with firstincremental production coming through from 2019• Progress continues on the pre-feasibility study• Key challenges likely to include water supply, communityengagement and tailings disposalo Metallurgical testing is currently underway to determine ifuntreated sea water can be used or if desalination is required20
Potential developmentprospects outside ChileTwin Metals projectEarly stage earn-in agreementsReko Diq project• 40% interest in Twin Metalsproject in Minnesota• Incorporation of propertiesformerly held by FranconiaMinerals Corp• Pre-feasibility studycontinues with particularfocus on the mostappropriate metallurgicalprocess• Long-term optionality throughearn-in agreements withjunior mining companies• Earn-ins in place in theAmericas, Europe, Africa andAustralia• Joint venture with BarrickGold Corporation• Currently subject toarbitration proceedings withfederal and provincialgovernments of Pakistan21
Conclusion• Strong operational performance with increased production and lower net cash costs vs H1 2011• Continued progress in optimising the reliability and performance of Esperanza• Operational management teams strengthened• <strong>2012</strong> FY copper production and pre-credit cash cost forecasts remain at approximately 700,000 tonnes, and165c/ c/lb• Antucoya project development continuing with first production expected in 2014 H2• Phased approach to Centinela District, with initial focus on Esperanza Sur sulphide and Encuentro oxide projects22
<strong>2012</strong> <strong>Half</strong> <strong>Year</strong> <strong>Results</strong> <strong>Presentation</strong>29 August <strong>2012</strong>
Brief History1888<strong>Antofagasta</strong> RailwayCompany incorporated andlisted in London1979Luksic Group acquirescontrolling interest andbegins investing in mining,financial and industrialsectors in Chile1996Financial and industrialinterests exchanged for33.6% interest inQuiñenco1997Development of largescalemining projectscommences2000Start of low-cost copperproduction with LosPelambres2003Demerger of 33.6% interestin QuiñencoAcquisition of Aguas de<strong>Antofagasta</strong><strong>2012</strong>• Initiation ofAntucoyaconstruction• Closing of theagreement withMarubeni for its 30%interest in Antucoyaproject2011• Early stage earn-inagreements in Sweden,Turkey, Portugal, Namibiaand Canada• Incorporation ofFranconia assets in TwinMetals Minnesota• Approval of Antucoyaproject and inclusion ofMarubeni as a partner inthe project2010• Commissioning of LosPelambres expansion• Nokomis: agreement withDuluth Metals• Commissioning ofEsperanza• Early stage earn-inagreements in Alaska andAustralia2009• Esperanza Project FinanceUS$1.05bn• Los Pelambres expansionfinance US$750m• Early stage earn-inagreements in Europe,Africa and Latin America• Underground coalgasification prospect2008• Inclusion of Marubeni as apartner in Esperanza andEl Tesoro• Initiation of Esperanzaconstruction• Energía Andina S.A., jointventure with ENAP forgeothermal opportunities2006• Acquisition ofexploration interests inPakistan• Acquisition of EquatorialMining to consolidatecontrol of the SierraGorda district24
OverviewLUKSICGROUP65%LSE-FREEFLOAT35%• FTSE 100 since March 2004• Market cap (22 August <strong>2012</strong>): US$17.4bnTRANSPORTFCAB (Chile)FCA (Bolivia)Combined rail and roadtonnages of approx.8.3 million tons per yearMININGOperating assets (Chile)Los Pelambres – Esperanza – El Tesoro – Michilla• 700,000 tonnes of copper in concentrate and cathodes• 280,000 ounces of gold.• 11,000 tonnes of molybdenum in concentrateExploration and evaluation studies in Chile, the United States and Pakistan Earn-in agreements inEurope, Africa, the Americas and AustraliaWATERAguas de <strong>Antofagasta</strong>(Chile)Approx. 48 million m 3sold per year(Volumes represent <strong>2012</strong> forecasts)25
Our business and strategy3. Growth beyondthe Core Business2. Organic &sustainable growth ofthe Core Business1. Our existingCore Business• Focused copper producer with high quality low-cost asset base in Chile• Delivering on significant production growth• Additional low cost production offsetting industry cost pressures to keep costsstable123• Los Pelambres• Esperanza• El Tesoro• Michilla• Centinela district• Los Pelambres district• Antucoya• Twin Metals• Reko Diq• Early-stage exploration• Energy• Consistent record of capital returns to shareholders• Major growth projects in existing core districts in Chile• Extensive exploration programme for longer-term Chilean and internationalgrowth• Social and environmental strategy to support strategic plan long termobjectives26
ExplorationsOfficesStrategic AllianceJoint VentureEarn-inMoUGeographical locationsOperations and exploration567a7b85910111615121314201Chile, SantiagoSantiago Office24Chile: Operation andExploration projects3Peru, Lima3 4Anaconda Peru Office5Peru ExplorationUSA, Earn-in with Full MetalMinerals Ltd., Pyramid project21171819212524222367a7b89Canada, Strategic Alliance withRiverside ResourcesUSA, MinnesotaAquisition of Franconia projectUSA, MinnesotaJoint Venture with Duluth MetalsLtd.,Twin Metals projectCanada, TorontoToronto OfficeCanada, Gaspé Peninsula, Quebec,Strategic Alliance with LaurentianGoldfields Ltd.101112131415Ireland, MoU withRathdowney Resources Ltd.United KingdomLondon OfficeSweden, Strategic Alliance withEurasian Minerals Inc.Finland, MoU withMagnus Minerals Ltd.Turkey, Strategic Alliance withStratex International <strong>plc</strong>Spain, Earn-in with Ormonde MiningPlc, La Zarza project121617181920Portugal, Earn-in with AvrupaMinerals Ltd., Alvalde projectNamibia, Earn-in with ManicaMinerals Ltd., Kuiseb projectNamibia, Earn-in with EisebExploration and Mining Ltd.,Talisman projectZambia, Strategic Alliance withManica Minerals Ltd.Pakistan, Joint Venture withBarrick Gold , Reko Diq project2122232425Australia, Western Australia, StrategicAlliance with Sipa Resources Ltd.Australia, Queensland, MoU withChacolphile Resources Pty. Ltd.Australia, BrisbaneBrisbane Office (January 2013)Australia, South Australia, Earn-in withMonax Mining Ltd., Punt Hill projectAustralia, South Australia, StrategicAlliance with Monax Mining Ltd.27
Chile: OperationsGeographical locationsChile• Esperanza(160,000 tonnes copper and240,000 ounces gold)• El Tesoro(100,000 tonnes copper)Chile: Projects and ExplorationEnergía Andina S.A., joint venture withOrigin for geothermal opportunities• Michilla(40,000 tonnes copper)• Transport and Water divisionsMulpun project, underground coalgasification• Los Pelambres(390,000 tonnes copper,11,000 tonnes moly and40,000 ounces gold)AntucoyaExploration in CentinelaDistrictJoint venture with New Gold (RíoFigueroa)Joint venture with Codelco(Cumbres and Sierra Jardín)Hornitos thermoelectrical powerplantEl Arrayán wind farmMichillaDistrictLos PelambresDistrictCentinelaDistrictRío FigueroaProject28
Financial historyTurnover (US$mUS$m), EBITDA (US$m(US$m) ) and EBITDA margin (%)Capital expenditure (US$mUS$m)56% 57%61% 60% 58%6,0761,1901,3351,3824,5771,9003,3731,6812,9632,7723,6611,8413,1614667733282008 2009 2010 2011 <strong>2012</strong> H1EBITDA (US$m) Turnover (US$m) EBITDA/Turnover (%)Commodity prices and cash costs2007 2008 2009 2010 2011 <strong>2012</strong> H1Net cash position (US$ million)327359373 3732,919267 2711,947155 161129 1371201119996 104 10232 871,5961,3451,1401,3452007 2008 2009 2010 2011 <strong>2012</strong> H1Realised copper price (c/lb) Pre-credit cash costs (c/lb) Cash Cost (including by product credits)2007 2008 2009 2010 2011 <strong>2012</strong> H129
Debt analysis (US$mUS$m)2,36649296594(179)(40)(2)(137)2,008472564571,4271,24830-06-2011 EsperanzaEl TesoroOtherLos Pelambres 30-06-<strong>2012</strong>EsperanzaLos PelambresEl TesoroOther30
Effective tax rate30.7% 3.1%31.2%3.8%(1.3%)(1.3%)6.9%6.9%5.6%20.1%18.7%30-06-2011Corporate tax (deferredand current)RoyaltyWithholding tax30-06-<strong>2012</strong>Corporate tax (deferred and current)RoyaltyWithholding tax31
Production and realisedprices analysis – <strong>2012</strong> H1Copper, molybdenum and gold productionRealised copper (c/lb), molybdenum(US$/lb) & gold price (oz/lb)2010 2011 <strong>2012</strong> H1 <strong>2012</strong> E<strong>2012</strong> EInitialUpdatedCopper (‘000 tonnes)Los Pelambres 384.6 411.8 197.2 390 390 **Esperanza - 90.1 68.2 170 * 160 *El Tesoro 95.3 97.1 52.7 100 100 ***Michilla 41.2 41.6 18 40 40Group total 521.1 640.5 336 700 700Molybdenum (‘000 tonnes)Los Pelambres 8.8 9.9 6.5 11.0 11.0Gold (‘000 ounces)Los Pelambres 35.1 39.8 26.3 28 40Esperanza - 157.1 109.8 252 * 240 *Group total 35.1 196.8 136.1 280.0 280.0Copper 2010 2011 <strong>2012</strong> H1Los Pelambres 371.7 371.1 373.4Esperanza - 354.7 372.5El Tesoro 351.9 391.2 370.4Michilla 263.8 381.6 377.2LME price 342.0 399.7 367.3MolybdenumLos Pelambres 16.2 15.1 12.9Market price 15.7 15.5 14.0GoldLos Pelambres 1,236.5 1,610.6 1,638.8Esperanza - 1,643.4 1,653.2Market price 1,226.3 1,572.0 1,651.3* Current expectations are for <strong>2012</strong> FY copper and gold production to be approximately 160k tonnes and 240k ounces respectively.The initial <strong>2012</strong> FY forecasts had been for a range of between 160-175 k tonnes of copper and 240-260k ounces of gold.** Current expectations are for <strong>2012</strong> production to be in slightly in excess of 390,000 tonnes*** Current expectations are for <strong>2012</strong> production to be in slightly in excess of 100,000 tonnes32
Cash cost (c/lb)Cash cost analysis – <strong>2012</strong> H12010H12011H1<strong>2012</strong> H1<strong>2012</strong> E<strong>2012</strong> EInitialUpdatedLos Pelambres 68.1 75.2 77.3 90.0 90.0Esperanza - 121.9 60.1 60.0 75.0El Tesoro 146.6 183.0 156.9 160.0 160.0Michilla 180.4 192.5 313.9 285.0 310.0Group weighted average net of by-products91.5 105.6 98.9 105.0 110.0Group weighted average (beforededucting by products)126.5 157.8 160.8 165.0 165.0Los Pelambres cash cost (c/lb)2010H12011H1<strong>2012</strong> H1<strong>2012</strong> E<strong>2012</strong> EInitialUpdatedOn-site and shipping 98.4 112.0 121.1 123.0 123.0Tolling charges 17.4 18.8 16.1 17.0 17.0Before by-product credits 115.8 130.8 137.2 140.0 140.0By-product credits (47.6) (55.5) (59.9) (50.0) (50.0) *After by-product credits 68.1 75.2 77.3 90.0 90.0Esperanza cash cost (c/lb)2011 H1 <strong>2012</strong> H1<strong>2012</strong> E<strong>2012</strong>EInitialUpdatedOn-site and shipping 255.3 174.3 178.0 183.0Tolling charges 15.5 17.50 17.0 17.0Before by-product credits 270.8 191.8 195.0 200.0By-product credits (148.9) (131.7) (135.0) (125.0) *After by-product credits 121.9 60.1 60.0 75.0* By-product credit forecasts are based on an average gold price of $1,650 per ounce and a molybdenumprice of US$11 per lb in H2 <strong>2012</strong>33
Purchased ore2%Spare parts5%Sulphuric acid3%Explosives &reagents4%Labour12%Energy11%Fuel6%Group160.8 (c/lb)Steel millingballs4%Shipping &Tolling charges14%Services15%Maintenance11%Other13%Fuel9%Other8%Maintenance10%Fuel5%Steel millingballs5%Spare parts8%Explosives &reagents3%Shipping8%El Tesoro156.9 (c/lb)Energy10%Explosives &reagents5%Los Pelambres137.2 (c/lb)Other20%Labour14%Services21%Sulphuric acid15%Services16%Maintenance14%Energy16%Explosives &Shipping reagentsSteel milling 6% 6% Maintenance8%balls5%Tolling charges9%Labour15%Other20%Pre-creditredit cash costH1 <strong>2012</strong>Esperanza191.8 (c/lb)Spare parts13%Michilla313.9 (c/lb)Commercial2%Fuel11%Services11%Explosives &reagents3% Spare parts4%Energy7%Sulphuric acid11%Labour8%Energy9%Tolling charges12%Purchased ore19%Services17%Labour17%34
Cash cost analysis2011 H1 vs. <strong>2012</strong> H1Los Pelambrescents/lb2011 H1 Actual 75.2Weaker Chilean Peso exchange rate (1.1)Maintenance 2.1Machinery rental 2.1Other Consumables 0.6Labour 0.6Other costs 4.8Change in onsite and shipping costs 9.1Tolling Charges (2.7)By product credits (4.3)<strong>2012</strong> H1 Actual 77.3Esperanzacents/lb2011 H1 Actual 121.5Weaker Chilean Peso exchange rate (3.7)Energy (37.3)Labour (29.9)Maintenance (4.2)Fuel and Lubricants (7.1)Other costs 1.2Change in onsite and shipping costs (81.0)Tolling Charges 2.4By product credits 17.2<strong>2012</strong> H1 Actual 60.135
Cash cost analysis2011 H1 vs. <strong>2012</strong> H1El TesoroMichillacents/lb2011 H1 Actual 183.0Weaker Chilean Peso exchange rate (2.3)Sulphuric Acid (26.9)Energy (11.7)Labour 5.4Other ConsumablesServices5.13.0Other Costs 1.3<strong>2012</strong> H1 Actual 156.9cents/lb2011 H1 Actual 192.5Weaker Chilean Peso exchange rate (4.7)Purchased Mineral 33.9Labour 23.7Transport 15.9Sulphuric Acid 9.3Other Consumables 8.2Energy 2.0Other Costs 33.2<strong>2012</strong> H1 Actual 314.036
Market cost – recent trends400,00Exchange rate (CLP/USD)Inverted axis120WTI oil price (US$/barrelbarrel)420,00100440,00460,00480,00500,00520,00540,002010 Av: 5102011 Av: 483<strong>2012</strong> H1 Av: 493Source Central Bank of Chile560,002009-12 2010-06 2010-12 2011-06 2011-12 <strong>2012</strong>-062010 Av: 792011 Av: 95<strong>2012</strong> H1 Av: 9580604020Source: Bloomberg02009-12 2010-06 2010-12 2011-06 2011-12 <strong>2012</strong>-06160140120100Monthly prices of sulphuric acid(US$/tonnes– CIF Mejillones)<strong>2012</strong> H1 Av: 1322011 Av: 118300250200Chilean central and northern grid spot energyprices (US$/MWhMWh)Northern grids (NG)Central grids (CG)<strong>2012</strong> H1 CG Av: 210802010 Av: 761502010 CG Av: 1352011 CG Av: 18260401002010 NG Av: 1212011 NG Av: 95<strong>2012</strong> H1 NG Av: 982050Source: Chilean Custom – only importsSource: SIC & SING02009-12 2010-06 2010-12 2011-06 2011-12 <strong>2012</strong>-06 02009-12 2010-06 2010-12 2011-06 2011-12 <strong>2012</strong>-0637
Realised pricesand mark-toto-marketCopper price (US$ cents)399.7372.6 367.3 373.0359.3342.0315.3266.7 270.6234.2US cents/pound) 2008 2009 2010 2011 <strong>2012</strong> H1LME copper price 315.3 234.2 342.0 399.7 367.3Realised copper price 266.7 270.6 359.3 372.6 373.0Effects on results (US$ million) 2008 2009 2010 2011 <strong>2012</strong> H1Provisional pricing - Copper (1) (582.00) 423.20 303.50 (286.20) 43.40Provisional pricing - Moly (101.20) (1.40) 3.10 (26.00) (10.20)Realised hedging (gains/losses) - Copper (2) 30.00 (65.80) (81.40) (15.10) (3.30)Period end mark-to-market* (US$ million) 2008 2009 2010 2011 <strong>2012</strong> H1Provisional pricing - Copper (1) (258.20) 64.50 129.80 (14.10) (34.10)Provisional pricing - Moly (13.30) 0.30 (1.10) (0.10) (4.80)Hedge instruments - Copper (2) 51.70 (77.80) (78.30) 58.90 57.10* Pre-tax and minorities2008 2009 2010 2011 <strong>2012</strong> H1LME copper priceRealised copper price(1) Provisional pricing: both actual realisations and mark-to-market are reflected in the incomestatement.(2) Hedge instruments: only actual realisations and ineffective hedges are reflected through theincome statement. Unrealised mark-to-market for effective hedges are reflected through reserves.38
Sustainabilityty• Social and environmental strategy to support strategic plan long term objectives• High commitment to health and safetyo 2011 LTIFR of 3.2 for Group and 2.1 for Mining Division (3.1 for Chilean mining industry)• Solid labour relationso Labour agreements successfully reached at all four mines between 2010-2011• Focus on sustainable environmental practiceso For example use of sea-water at Michilla and Esperanza, also to be used at Antucoya• Development of long-term relationships with local communitieso For E.g. creation of the Los Pelambres Foundation in 2002 to support long-termdevelopment of the Choapa Valley beyond the life of mining operations• Leading role in the use and generation of renewable energy in Chileo Investment in a 115MW wind farm project near Los Pelambreso Installation of a thermal solar project for use in the electro-winning process at El Tesoro39
Operations and projectsLos Pelambres• Open pit operation located in Chile’s Coquimbo Region, producingcopper and molybdenum concentrates since 2000• <strong>2012</strong> HY production and costso Copper – 197,200 tonneso Molybdenum – 6,500 tonneso Net cash costs 77.3 c/lb – pre-credit costs 137.2 c/lb• <strong>2012</strong> FY forecast production and costso Copper – 390,000 tonneso Molybdenum – 11,000 tonneso Net cash costs 90.0 c/lb – pre-credit costs 140 c/lb• Significant resource base could further enhance mine plan in thefuture40
Operations and projectsEl Tesoro and MichillaSX-EW operations in Chile’s <strong>Antofagasta</strong> Region producing copper cathodes• El Tesoroo <strong>2012</strong>HY production of 46,800 tonnes, and cash costs of 15.9 c/lbo <strong>2012</strong> forecast production of 100,000 tonnes, and cash costs of 160 c/lbo Ore feed from Tesoro Central, Tesoro North-East and Run-of-Mine leachingo Mirador oxides being processed from H2 2011, resulting in production ofapproximately 100,000 tonnes per annum between <strong>2012</strong> and 2014, reducingcash costs and extending the life of El Tesoro’s operation to 2022• Michillao <strong>2012</strong>HY production of 18,000 tonnes, and cash costs of 313.9 c/lbo <strong>2012</strong> forecast production of 40,000 tonnes, and cash costs of 310 c/lbo Mine plan extended to 2015 during 2011 H1, with exploration plan to furtherextend mine life to 201841
Chile’s <strong>Antofagasta</strong> RegionTransport andWater businessesMejillones<strong>Antofagasta</strong>TocopillaChuquicamataMichillaInteracidTerminalAltoNorteAugustaVictoriaEl AbraSierraGordaLomas BayasConchiEl SalvadorCalamaEl TesoroEsperanzaZaldivarGabyEscondidaTransport• <strong>2012</strong> H1 total volumes - 3.8 million tons (railvolumes – 3.0 million tons;road volumes – 0.8 million tons)• <strong>2012</strong> H1 revenue - US$91 million• <strong>2012</strong> H1 EBITDA - US$36 millionWater• <strong>2012</strong> H1 water volumes – 25.7 million m 3Rail stationCity / portMineOwned MineRail Network• <strong>2012</strong> H1 revenue - US$65 million• <strong>2012</strong> H1 EBITDA - US$41 million42
Refined copper marketCopper price and exchange inventories• Ongoing worries due to the instability of the financial marketsand economic growth have led to a downward trend in pricesduring the year, averaging 364 c/lb, in the period Jan-Jul <strong>2012</strong>(-15% y/y). Although the macro-economic variables remain themain driver of the price, the strength of the fundamentals havepartially offset these financial issues.• On the consumption side, there have been mixed signals. InChina, net imports have increased strongly (+41% 1H <strong>2012</strong>),reflecting some restocking with increases at both exchangesand bonded warehouses. Although real demand growth hasslowed, the recent investment stimulus implemented by thegovernment should have a positive impact on underlyingdemand in the near future. On the other hand, Europeanconsumption has weakened while the US is relatively flat.• The supply side has failed to meet market expectations,resulting in a growth of approximately 3.2% in <strong>2012</strong>.• Market consensus is for a deficit of around 250,000 tonnes in<strong>2012</strong> and nearly a balanced market in 2013 with the pricerecovering from the current spot level.43
Copper concentrates market• The projected deficit in the concentrates market has beenexacerbated during the year, mainly supported by productionproblems and disruptions which continue to impact theavailability of concentrates. This deficit trend is expected toextend until 2015.Market balance and terms• In this environment the spot market has remained tight andfavourable to producers with TC & RCs in the range of 20-30US$/DMT and 2-3 US¢/lb for clean quality concentrates.• Market fundamentals are expected to remain strong, supportedby projected increases in smelting capacity in Asia that willabsorb next year’s growth in concentrates production.• Annual negotiations between smelters and miners were settledat different T/C & R/C’s depending on the contractualconditions, the geographic area and the quality of theconcentrates. Most of the agreements were between 57-60US$/DMT and 6/6.35 US¢/lb.• Mid-year negotiations are reported to be agreed at similarlevels to that of the annual contracts.44
Molybdenum marketMolybdenum price and market balance• Estimates are for a market surplus of 5 to 10 millionpounds in <strong>2012</strong>.o Demand growing only at 0.6% y/y worldwideaffected by the world economic slowdown.o Supply is performing well with increasedproduction from both by-product and primarymines.• Molybdenum price started strongly during the first twomonths of the year (around 14 US$/lb) and from thenuntil August there has been a steady decline to levelsbelow 12 US$/lb in line with demand construction in theEurozone and an overstock in China.• The price correction is putting pressure on small anduncompetitive mines in China and also on the highercost mines in the western world.• Market consensus is that price will remain trading in the9 – 13 US$/lb range for the balance of <strong>2012</strong>.45
Reserves and resources(at 31 December 2011)Tonnage Copper MolybdenumGold Attributable Tonnage(millions of tonnes) (%) (%) (g/tonne) (millions of tonnes)2011 2010 2011 2010 2011 2010 2011 2010 2011 2010Ore ReservesGroup subsidiariesLos Pelambres (see note (a)) 1,479 1,433 0.62 0.64 0.02 0.02 0.03 0.03 887 860Esperanza Sulphides (see note (b)) 600 587 0.54 0.55 0.01 0.01 0.22 0.22 420 411El Tesoro (see note (c)) 228 233 0.58 0.62 - - - - 160 163Open pit, Tesoro North-East and Mirador 121 130 0.80 0.83 - - - - 85 91El Tesoro ROM (Esperanza Oxides) 107 102 0.32 0.35 - - - - 75 72Antucoya (see note (d)) 642 - 0.35 - - - - - 642 -Michilla (see note (e)) 12 6 1.28 1.53 - - - - 9 4Group Total 2,961 2,259 0.55 0.62 2,118 1,438Mineral Resources (including ore reserves)Group subsidiariesLos Pelambres (see note (a)) 6,006 5,818 0.51 0.53 0.01 0.01 0.03 0.04 3,604 3,491Esperanza Sulphides (see note (b)) 2,019 1,923 0.36 0.39 0.01 0.01 0.12 0.11 1,413 1,346El Tesoro (see note (c)) 260 276 0.58 0.59 - - - - 182 193Open pit, Tesoro North-East and Mirador 153 155 0.77 0.80 - - - - 107 108El Tesoro ROM (Esperanza Oxides) 108 121 0.32 0.33 - - - - 75 85Michilla (see note (d)) 67 56 1.57 1.78 - - - - 50 42Antucoya (see note (e)) 1,106 1,509 0.31 0.27 - - - - 1,106 1,509Telégrafo (see note (f)) 2,965 2,728 0.34 0.35 - - - - 2,076 1,910Oxides 64 51 0.21 0.21 - - - - 45 36Sulphides 2,901 2,677 0.34 0.36 0.01 0.01 0.11 0.10 2,031 1,874Caracoles (see note (h)) 1,301 1,129 0.41 0.45 - - - - 1,301 1,129Oxides 212 132 0.40 0.50 - - - - 212 132Sulphides 1,089 996 0.41 0.45 0.01 0.02 0.15 0.18 1,089 996Group Subsidiaries total 13,725 13,439 0.43 0.44 9,732 9,619Group Joint VenturesReko Diq (see note (i)) 5,868 5,868 0.41 0.41 - - 0.22 0.22 2,200 2,200Total Group 19,593 19,307 0.43 0.43 - - - - 11,933 11,82046
Safety statisticsLost TimeInjury Frequency Rate (LTIFR)All InjuryFrequency Rate (AIFR)Number of Fatalities2011 2010 2009 2008 2007 2006 2011 2010 2009 2008 2007 2006 2011 2010 2009 2008 2007 2006Chilean mining industry 3.1 3.6 4.0 5.8 5.9 5.8 n/a n/a n/a n/a n/a n/a 26.0 45 35 43 40 31Los Pelambres 1.8 0.9 1.3 1.3 1.7 2.3 4.6 2.6 3.6 6.6 5.3 7.5 - 2 4 – – –El Tesoro 2.1 0.5 1.7 2.0 1.2 2.2 5.6 4.6 6.0 6.6 13.1 19.4 - - 1 – – –Michilla 3.1 4.2 3.2 4.4 2.6 1.3 6.7 8.8 9.9 12.1 12.8 12.7 - - - – 1 1Esperanza 2.4 1.6 1.5 1.6 n/a n/a 16.8 14.7 15.0 8.2 n/a n/a - - - – n/a n/aAMSA including exploration 1.3 3.2 6.0 5.4 n/a n/a 24.9 13.6 23.0 13.1 – – - - - 1 n/a n/aMining 2.1 1.6 1.7 2.2 1.8 2.0 9.2 10.1 8.5 8.2 9.0 11.6 - 2 5 1 1 1FCAB 9.6 9.5 12.0 13.9 19.2 15.3 28.3 26.4 33.9 37.1 35.9 37.5 1.0 - - – – 3ADASA 5.5 5.6 7.0 11.5 8.6 9.1 8.2 22.4 16.8 21.6 28.7 29.9 - - - – – –Group 3.2 1.9 2.8 4.4 5.6 4.9 11.5 11.0 11.0 12.9 17.1 17.5 1 2 5 1 1 4Definitions:LTIFR – Number of accidents with lost time during the year per million hours worked.AIFR – Number of accidents with and without lost time during the year per million hours worked.Chilean mining industry source – Servicio Nacional de Geología y Minería. Comparative figures for 2009 have been updated to reflect the full year; 2010 full year figures have not yet beenreleased by Servicio Nacional de Geología y Minería and therefore are not shown above.47
<strong>Antofagasta</strong> contactsLondon(<strong>Antofagasta</strong> <strong>plc</strong>)Santiago de Chile(<strong>Antofagasta</strong> Minerals S.A.)Hussein Barmahbarma@antofagasta.co.ukPhilip Holdenpholden@antofagasta.co.ukAlejandro Riveraarivera@aminerals.clHelen Karikarihkarikari@antofagasta.co.ukEduardo Tagleetagle@aminerals.clClare Woodcwood@antofagasta.co.ukCarlos Sepúlvedacsepulveda@aminerals.clTel: (+44-20) 7808-0988Tel: (+56-2) 798-714548
<strong>2012</strong> <strong>Half</strong> <strong>Year</strong> <strong>Results</strong> <strong>Presentation</strong>29 August <strong>2012</strong>


