MF291 Balance Sheet--A Financial Management Tool
MF291 Balance Sheet--A Financial Management Tool
MF291 Balance Sheet--A Financial Management Tool
Create successful ePaper yourself
Turn your PDF publications into a flip-book with our unique Google optimized e-Paper software.
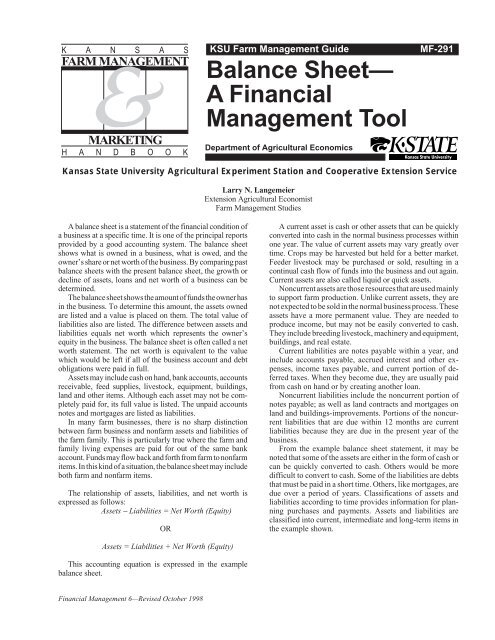
Uses of the <strong>Balance</strong> <strong>Sheet</strong>The balance sheet has many important uses. Lendingagencies use balance sheets to evaluate the financial positionof most loan applicants. The balance sheet statement alsocan be extremely useful to the owner of the business indicatingthe state of business net worth. Comparison of balancesheets over time will show how much the business net worthis growing or decreasing. A balance sheet can be used by theowner of a business to support a request for borrowed funds.The balance sheet gives information on how best to meetliabilities. If liabilities are due in a short time, cash will beneeded to pay them. If the sale of current assets will not raisesufficient funds and the loan cannot be renewed, then a longtermloan may need to be negotiated on the basis of longtermasset values.Comparison of total current assets to total noncurrentassets helps determine if too much or too little capital is tiedup in permanent investments. A farm business, consistingprimarily of noncurrent assets, has less flexibility than onewhich has sufficient current assets. Some flexibility in thebusiness should be maintained. A balance sheet provides theinformation for making these comparisons.Evaluating the <strong>Balance</strong> <strong>Sheet</strong>A balance sheet of a farm business can be evaluated by:• Comparison to balance sheets of the same business inprevious years.• Comparison to balance sheet data from other farms.• Use of ratios.• Use of “common-size” statement.Comparison to Previous YearsOne of the most effective methods of evaluating thebalance sheet is comparison of one year to previous years forthe same business. Comparison of balance sheets betweenyears directs attention to changes that have occurred in therelationship between assets and liabilities and the resultinggrowth or decline in net worth of the businessComparison to Other FarmsComparison of the balance sheet of a farm business tobalance sheet data from successful farms of a similar type maygive evidence of weak or strong points in the businessUse of RatiosRatios may be used in evaluating balance sheets. A ratio isa comparison of two numbers which are expressed as anumerical ratio of one number to the other or as a percentageof one to the other. Examples of balance sheet ratios are:Current Ratio =Debt/Asset Ratio =Equity/Asset Ratio =Debt/Equity Ratio =Total Current Farm AssetsTotal Current Farm LiabilitiesTotal Farm LiabilitiesTotal Farm AssetsTotal Farm EquityTotal Farm AssetsTotal Farm LiabilitiesTotal Farm EquityWorking Capital = (Total Current Farm Assets) –(Total Current Farm Liabilities)3In the example balance sheet, the Current Ratio of thefarm business is 1.53 ($309,440 to $201,710). The Debt/Asset Ratio is 0.48 or approximately 1 to 2.1 ($376,800 to$784,065). The Debt/Equity Ratio is 0.93 or approximately1 to 1.1 ($376,800 to $407,265). Expressed in another way,the example balance sheet shows $1.53 of current farmassets to each $1 of current farm loans; $0.48 of total farmliabilities to each $1 of total farm assets; and $0.93 of farmliabilities to each $1 of farm equity.Some ratios compare an item from the balance sheet to ameasure of net income:Net Farm Income to Equity =Net Farm Income to Total Assets =Net Farm IncomeTotal Farm EquityNet Farm IncomeTotal Farm AssetsFor further discussion of financial ratios used in farmfinancial management, see the KSU Farm <strong>Management</strong> GuideMF-270, <strong>Financial</strong> Ratios Used in <strong>Financial</strong><strong>Management</strong>.Common-Size StatementWhen different sized operations are compared, use ofpercentages rather than actual dollars has some advantages.This approach is called a common-size statement. Each farmis put on a “common-size” basis; that is, the various assets,liabilities, and equity are expressed as percentages within thebusiness.An example common-size statement is shown in column 2using the figures from the balance sheet example shown onpage 2. In the common-size statement approach, the individualassets are listed as a percentage of the total assets. Theindividual liabilities and equity also are listed as a percent ofthe total liabilities plus equity. For example, total farm assetsin the example balance sheet amount to $784,065. Each assetis then expressed as a percentage of this figure. Crops heldfor sale and feed in the example is $17,980. This is approximately2.29 percent of $784,065. Market livestock is valuedat $232,650 or approximately 29.67 percent of the total asthe other assets are similarly calculated as a total assets. Thefarm liabilities and equity also add up to $784,065 in theexample. Current notes due within one year amount to$118,975 or approximately 15.18 percent of $784,065. Eachof the other liabilities and equity also are calculated as apercent of the total liabilities plus equity.In evaluating the comparative strength of a business, thepercentage method shows some significant features. Thismethod indicates the distribution of items but does not giveevidence of growth or decline. It shows the proportion ofinvestments that is tied up in current and noncurrent assets. Itindicates the financial structure in terms of the proportion thatis furnished by the owner and by the short-term and long-termlenders. In the example, 39.42 percent of the farm investmentis made up of current assets and 60.58 percent of noncurrentassets. Current liabilities make up 25.73 percent and noncurrentliabilities make up 22.33 percent of the total farmliabilities and equity. Equity makes up 51.94 percent of thetotal farm liabilities and equity, thus the owner is furnishing51.94 percent of the total funds in the farm business comparedto 48.06 percent from outside sources.
Table 2. Example—Common-Size Statement ofa Farm BusinessJohn P. RecorderDecember 31, 1998Amount PercentASSETSCash on Hand .................................. 0 0.00Cash on Deposit in Bank ................. 31,140 3.97Marketable Securities ...................... 0 0.00Market Livestock ............................. 232,650 29.67Crops Held for Sale and Feed .......... 17,980 2.29Fertilizer and Supplies on Hand ....... 7,625 0.97Accounts Receivable ....................... 10,000 1.28Prepaid Expenses ............................. 0 0.00Cash Investment in Growing Crops . 9,000 1.15Other Current Assets (List) .............. 645 0.09TOTAL CURRENT ASSETS ......... $309,040 39.42Breeding Livestock (Market) ........... 25,500 3.25Auto-Trucks (Market)...................... 13,520 1.72Motorized Equipment (Market) ....... 70,700 9.01Machinery and Equipment (Market) 37,605 4.80Investments in Capital Leases .......... 0 0.00Investments in Other Entities ........... 6,000 0.76Investments in Cooperatives ............ 18,000 2.30Real Estate (Market) ........................ 198,750 25.35Buildings-Improvements (Market) ... 104,950 13.39Other Assets (list) ............................ 0 0.00TOTALNONCURRENT ASSETS ............ $475,025 60.58TOTAL ASSETS ............................ $784,065 100.00Amount PercentLIABILITIESAccounts Payable ............................ 0 0.00Notes Due Within One Year ............ 118,975 15.18Current Portion of Term DebtDue Within 12 Months .................. 11,125 1.42Accrued Interest .............................. 8,500 1.08Income Taxes Payable ..................... 3,200 0.41Current Portion-Deferred Taxes ....... 55,910 7.13Other Accrued Expenses .................. 4,000 0.51Other Current Liabilities (List)......... 0 0.0 0TOTAL CURRENT LIABILITIES ... $201,710 25.73Non-Current Portion— Notes Payable ........................... 20,790 2.65Non-Current Portion— Real Estate Debt ....................... 83,025 10.59Non-Current Portion— Deferred Taxes ......................... 71,275 9.09Other Non-Current Liabilities .......... 0 0.00TOTAL NONCURRENTLIABILITIES ............................... $175,090 22.33TOTAL LIABILITIES .................... $376,800 48.06Retained Capital .............................. 280,160 35.73Valuation Equity.............................. 127,105 16.21OWNER EQUITY .......................... $407,265 51.94TOTAL LIABILITIESAND OWNER EQUITY .............. $784,065 100.00For further information of farm financial managementinformation see the following KSU Farm <strong>Management</strong> Guides:MF-270, <strong>Financial</strong> Ratios Used in <strong>Financial</strong><strong>Management</strong>MF-275, Cash Flow Projection for Operating LoanDeterminationMF-288, How Much Debt Can A Farm CarryMF-294, Income Statement - A <strong>Financial</strong><strong>Management</strong> <strong>Tool</strong>Publications from Kansas State University are available on the World Wide Web at: http://www.oznet.ksu.eduContents of this publication may be freely reproduced for educational purposes. All other rights reserved. In each case, credit Larry N.Langemeier, <strong>Balance</strong> <strong>Sheet</strong>—A <strong>Financial</strong> <strong>Management</strong> <strong>Tool</strong>, Kansas State University, October 1998.Kansas State University Agricultural Experiment Station and Cooperative Extension Service, Manhattan, KansasMF-291 Revised October 1998It is the policy of Kansas State University Agricultural Experiment Station and Cooperative Extension Service that all persons shall have equal opportunity andaccess to its educational programs, services, activities, and materials without regard to race, color, religion, national origin, sex, age or disability. Kansas StateUniversity is an equal opportunity organization. Issued in furtherance of Cooperative Extension Work, Acts of May 8 and June 30, 1914, as amended. KansasState University, County Extension Councils, Extension Districts, and United States Department of Agriculture Cooperating, Marc A. Johnson, Director.File Code: Farm <strong>Management</strong> 6-34


