Award-winning children's policy - Talanx
Award-winning children's policy - Talanx
Award-winning children's policy - Talanx

Create successful ePaper yourself
Turn your PDF publications into a flip-book with our unique Google optimized e-Paper software.
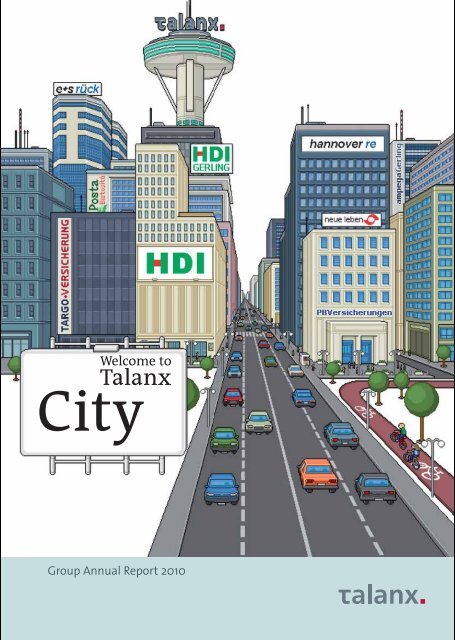
Group Annual Report 2010
Key fi gures of the Group segments<br />
Industrial Lines<br />
■ HDI-Gerling Industrie Versicherung and<br />
foreign companies focusing on industrial<br />
business make up the segment<br />
■ Gross written premium maintained on<br />
the level of the previous year despite<br />
sale of a portfolio in Spain<br />
■ Deterioration in underwriting result<br />
but investment income stable<br />
Gross written premium *<br />
in EUR billion<br />
3.1 3.1<br />
2009 2010<br />
Operating profit (EBIT) *<br />
in EUR million<br />
334<br />
185<br />
2009 2010<br />
Retail Germany<br />
■ Segment combines German retail business<br />
transacted by HDI-Gerling and all<br />
German bancassurance activities<br />
■ Premium growth in life insurance leads<br />
to increased volume overall despite<br />
modest decline in property/casualty<br />
insurance products<br />
■ Sharply higher investment income fails<br />
to offset underwriting deficit<br />
Gross written premium *<br />
in EUR billion<br />
6.6<br />
209<br />
2009<br />
6.8<br />
2009 2010<br />
Operating profit (EBIT) *<br />
in EUR million<br />
All figures as per IFRS<br />
* Due to the restructuring in primary insurance only the figures for 2009 and 2010 can be shown for these segments<br />
–44<br />
2010<br />
Retail International<br />
■ Segment encompasses the foreign activities<br />
of companies serving retail customers<br />
in property/casualty insurance,<br />
life insurance and bancassurance<br />
■ Key drivers of premium growth are<br />
Brazil and the Polish life company;<br />
exchange rate effects are also helpful<br />
■ EBIT influenced by various special<br />
effects, inter alia in Turkey and Mexico<br />
Gross written premium *<br />
in EUR billion<br />
1.8<br />
–42<br />
2009<br />
2.2<br />
2009 2010<br />
Operating profit (EBIT) *<br />
in EUR million<br />
26<br />
2010
Non-Life Reinsurance<br />
■ Natural disasters and other loss events<br />
produce heavy claims expenditure<br />
■ EBIT grows by 20% thanks to healthy<br />
investment income and special effect<br />
associated with court decision<br />
■ Very good results in Germany and North<br />
America as well as in specialty lines<br />
Gross written premium<br />
in EUR billion<br />
7.1<br />
2006 2007 2008 2009 2010<br />
Operating profit (EBIT)<br />
in EUR million<br />
813<br />
5.6<br />
902<br />
5.0<br />
122<br />
5.8<br />
760<br />
6.3<br />
909<br />
2006 2007 2008 2009 2010<br />
Life/Health Reinsurance<br />
■ Desired balance between conventional<br />
reinsurance and other pillars of the<br />
business is gradually being attained<br />
■ Position in key markets expanded on<br />
the back of premium growth of 12%<br />
■ EBIT satisfactory after a record result in<br />
the previous year that was shaped by<br />
special effects<br />
Gross written premium<br />
in EUR billion<br />
2.8<br />
3.1 3.1<br />
2006 2007 2008 2009 2010<br />
Operating profit (EBIT)<br />
in EUR million<br />
146<br />
231<br />
114<br />
4.5<br />
371<br />
5.1<br />
276<br />
2006 2007 2008 2009 2010<br />
Corporate Operations<br />
■ <strong>Talanx</strong> Service AG and <strong>Talanx</strong> Systeme AG<br />
new to the segment, the focus of which<br />
remains on asset management and investment<br />
activities<br />
■ Cash inflow in retail funds business well<br />
above the market average<br />
■ Segment EBIT influenced by deficit of<br />
<strong>Talanx</strong> AG due to income contributions<br />
and provisions constituted for other segments<br />
Assets under management<br />
in EUR billion<br />
63.2<br />
65.7<br />
67.8<br />
2006 2007 2008 2009 2010<br />
Operating profit (EBIT)<br />
in EUR million<br />
55 60<br />
74.1<br />
–16 –26<br />
2006 2007 2008 2009<br />
82.9<br />
–315<br />
2010
The <strong>Talanx</strong> Group is Germany’s third-largest insurance group. <strong>Talanx</strong> operates as a<br />
multi-brand provider in the primary insurance and reinsurance sectors. Its brands<br />
include HDI and HDI-Gerling, providing insurance solutions for retail and industrial<br />
customers, Hannover Re, one of the industry’s leading reinsurers, the bancassurance<br />
specialists Targo Versicherungen, PB Versicherungen and Neue Leben as well as the<br />
investment fund provider AmpegaGerling. The Group transacts business in the areas<br />
of property/casualty and life insurance as well as non-life and life/health reinsurance.<br />
Based in Hannover, Germany, the Group is active in 150 countries and enjoys excellent<br />
fi nancial strength.<br />
Group key figures 2010 2009 +/– %<br />
IFRS<br />
Gross written premium EUR m 22,869 20,923 +9.3<br />
Net premium earned EUR m 18,753 17,323 +8.3<br />
Underwriting result EUR m –2,036 –1,031 –97.5<br />
Combined ratio (property/casualty insurance<br />
and non-life reinsurance) 1) % 100.9 96.7 +4.2 points<br />
Net investment income EUR m 3,177 2,658 2) +19.5<br />
Operating profit (EBIT) EUR m 1,032 1,497 2) –31.1<br />
Net profit (after tax) EUR m 670 893 2) –25.0<br />
Group net income (after minorities) EUR m 220 485 2) –54.6<br />
Return on equity after tax 3) % 4.6 11.8 2) –7.2 points<br />
Policyholders’ surplus EUR m 10,782 9,156 2) +17.8<br />
Total shareholders’ equity EUR m 4,956 4,574 2) +8.4<br />
Minority interests EUR m 3,035 2,579 2) +17.7<br />
Hybrid capital EUR m 2,791 2,003 +39.3<br />
Investments under own management EUR m 72,461 67,036 2) +8.1<br />
Total investments EUR m 83,422 76,385 2) +9.2<br />
Return on investment 4) % 4.2 3.7 +0.5 points<br />
Total assets EUR m 111,368 101,565 +9.7<br />
Staff (full-time equivalents as at 31.12. of the financial year) 16,874 16,921 –0.3<br />
For mathematical reasons rounding diff erences of ± one unit may arise in the tables.<br />
1) Combined ratio adjusted for deposit interest received<br />
2) Adjusted on the basis of IAS 8<br />
3) Group net income for the period excluding minorities relative to average shareholders’ equity excluding minority interests<br />
4) Investment income excluding deposit interest received relative to average investments under own management<br />
Gross premium by Group segments Gross premium by regions<br />
Life/Health<br />
Reinsurance<br />
21%<br />
Non-Life<br />
Reinsurance<br />
26%<br />
Industrial Lines<br />
13%<br />
Retail<br />
Germany<br />
30%<br />
Retail<br />
International<br />
10%<br />
Other countries<br />
15%<br />
North America<br />
16%<br />
Rest of Europe<br />
30%<br />
Germany<br />
39%
The <strong>Talanx</strong> Group is a place where people come together<br />
on a daily basis. It is here that they work together for<br />
the company, delivering services for customers and creating<br />
value for investors. Yet the <strong>Talanx</strong> Group is also a<br />
place for living together, for co-existence, diversity and<br />
communication. Along with its basic function as a place<br />
of business, it is also at once a human habitat, social<br />
structure and cultural space – just like a city. Indeed,<br />
comparing <strong>Talanx</strong> with a city opens up some astonishing<br />
perspectives. Correlations within the Group suddenly<br />
appear in a fresh light and become clearer. The parallels<br />
with a city make it possible to capture in visual form just<br />
what <strong>Talanx</strong> is: we warmly invite you to join our city tour<br />
in this annual report!<br />
Key figures<br />
Segments and brands at a glance<br />
<strong>Talanx</strong> Group<br />
2 City Guide: our brands<br />
4 Letter from the Chairman<br />
6 Boards and Officers<br />
11 Report of the Supervisory Board<br />
14 <strong>Talanx</strong> City: our Group<br />
24 City News: the year 2010<br />
Group management report<br />
27 Detailed index<br />
Consolidated financial statements<br />
107 Detailed index<br />
115 Notes<br />
264 Independent auditor’s report<br />
265 Addresses<br />
269 Glossary<br />
274 Index of key terms<br />
Contacts<br />
<strong>Talanx</strong> worldwide
2<br />
<strong>Talanx</strong> Group Annual Report 2010<br />
City<br />
Guide<br />
The <strong>Talanx</strong> Group operates as a multi-brand<br />
provider in the insurance and fi nancial services<br />
industry. Our major brands in primary insurance<br />
and reinsurance as well as for fi nancial services<br />
are set out on the opposite page. As in the past, the<br />
<strong>Talanx</strong> brand stands for the company at the head<br />
of the Group – namely <strong>Talanx</strong> AG, which performs<br />
the functions of a management and fi nancial holding<br />
company within the Group but is not itself<br />
active in insurance business.<br />
A new feature, however, is that several other Group<br />
companies now also bear the <strong>Talanx</strong> name: they<br />
include the service companies <strong>Talanx</strong> Service AG<br />
and <strong>Talanx</strong> Systeme AG, the latter of which is still<br />
in the process of establishment. The divisional<br />
companies <strong>Talanx</strong> Deutschland AG and <strong>Talanx</strong><br />
International AG bring together the operational<br />
companies operating under various brands in Germany<br />
and abroad. Similarly, the asset management<br />
and real estate management companies will also<br />
trade under the <strong>Talanx</strong> name going forward. Not<br />
only that: the Group’s own professional reinsurance<br />
broker, handling the reinsurance business ceded by<br />
the <strong>Talanx</strong> Group, will in future operate under the<br />
<strong>Talanx</strong> brand: Protection Re is to become <strong>Talanx</strong><br />
Reinsurance Broker.
HDI-Gerling<br />
HDI-Gerling operates worldwide<br />
in retail insurance and<br />
industrial lines. The product<br />
range extends from property,<br />
casualty and accident covers<br />
to life insurance, occupational<br />
retirement provision<br />
and individual solutions for<br />
old-age provision.<br />
HDI<br />
HDI Direkt Versicherung AG<br />
operates under this brand in<br />
the Retail Germany division.<br />
Some companies outside<br />
Germany transacting retail<br />
business and industrial lines<br />
also trade under the HDI<br />
name.<br />
Hannover Re, E+S Rück<br />
The Hannover Re Group, one<br />
of the largest and most profitable<br />
reinsurers in the world,<br />
transacts all lines of non-life<br />
and life/health reinsurance<br />
and maintains business relations<br />
with more than 5,000<br />
insurance companies in<br />
around 150 countries. E+S<br />
Rück is a specialist reinsurer<br />
serving the German market.<br />
<strong>Talanx</strong> Group up<br />
City Guide de<br />
Letter from the Chairman an<br />
Boards and Committees es<br />
Report of the Supervisory Board rd<br />
<strong>Talanx</strong> City ty<br />
City News ws<br />
AmpegaGerling<br />
One of the largest independent<br />
asset managers in<br />
Germany, responsible for<br />
fi nancial services within<br />
the Group. From funds<br />
business to asset management<br />
activities for private<br />
and institutional investors,<br />
AmpegaGerling covers the<br />
complete value-added chain<br />
in asset management.<br />
Targo Versicherungen<br />
V i h PB Versicherungen Neue LLeben b<br />
Posta ta Biztosító<br />
In the bancassurance sales The PB insurers are active in The Neue Leben insurers are The high-growth bancassur-<br />
channel the Targo insurers the bancassurance sales chan- positioned in the bancassurance cooperation with the<br />
operate exclusively for their nel exclusively for their partance sales channel as provi- Hungarian postal service. The<br />
partner TARGOBANK and ner Postbank: embedded into sion specialists for Sparkasse readily comprehensible and<br />
deliver a service for their cus- its market profi le and geared savings institutions. They transparent range of products<br />
tomers that is geared to the to the needs of its customers, off er their customers and off ering outstanding value<br />
easy and comfortable han- they off er attractive insurance sales partners innovative for money spans the life and<br />
dling of all banking, fi nancial products at reasonable prices. insurance products on property/casualty lines.<br />
and insurance transactions.<br />
attractive terms.<br />
3
4 <strong>Talanx</strong> Group Annual Report 2010<br />
Ladies and Gentlemen,<br />
When it comes to delivering a verdict on the <strong>Talanx</strong> Group’s<br />
2010 fi nancial year, it is important not to base it simply on<br />
fi rst appearances, but rather to look behind the façade: 2010<br />
was not a bad year for <strong>Talanx</strong>, even though at fi rst glance our<br />
result may suggest otherwise. Yet this appearance is deceiving<br />
– in operational and structural terms our Group took<br />
another major step forward!<br />
That this is not evident at fi rst glance can be attributed to two<br />
developments. In the fi rst place, our insurance business was<br />
overshadowed by a considerably higher burden of losses than<br />
in the previous year: 2010 saw an accumulation of natural<br />
catastrophes and man-made major claims. The <strong>Talanx</strong> Group,<br />
too, was impacted by these losses – and the fact that the<br />
eff ect on our combined ratio was not more pronounced was<br />
thanks purely to our very prudent reserving <strong>policy</strong> and the<br />
resulting run-off profi ts.<br />
What is more, in 2010 the Board of Management took<br />
extensive steps to establish risk provision for future years<br />
– which were adversely refl ected in the result in a number of<br />
non-recurring charges. The most appreciable eff ect derived<br />
from the merger of Aspecta Lebensversicherung AG into<br />
HDI-Gerling Lebensversicherung AG. In this connection we<br />
commuted reinsurance treaties early and calculated future<br />
income fl ows from the former Aspecta portfolio considerably<br />
more prudently than in the past. In foreign retail business<br />
the confi dence level of the loss reserves was adjusted at some<br />
companies in line with the reserving standard of the <strong>Talanx</strong><br />
Group and units that were unable to fulfi ll our performance<br />
expectations were wound up. These two measures also led<br />
to one-off expenditures. The fi nal item on this list is the<br />
expense associated with the restructuring of central functions<br />
and the accompanying IT costs. If these non-recurring<br />
charges – together with one-off tax income – are eliminated,<br />
the 2010 result posted by <strong>Talanx</strong> was on the level of the<br />
record fi gure generated in the previous year.
This second perspective reveals the economic reality of the<br />
Group: the true operational development of the <strong>Talanx</strong><br />
Group shows that the 2010 result was not the consequence<br />
of structural defi ciencies, but rather a refl ection of targeted<br />
measures designed to position <strong>Talanx</strong> even better for the<br />
future and to further improve its capital market fi tness.<br />
This is also evident from the premium income, investments<br />
and fi nancing costs: the pleasing increase in premium<br />
income stems from areas in which we are seeking to grow<br />
strategically – international retail business and life/health<br />
reinsurance. Investment income was also boosted appreciably<br />
thanks to both larger asset holdings and improved<br />
extraordinary income. We were able to reduce our fi nancing<br />
costs by buying back bonds that we had issued on<br />
favorable terms.<br />
<strong>Talanx</strong> continues to rank among the fi nancially strong insurers!<br />
The capital strength of the Group is demonstrated by<br />
the increase in Group shareholders’ equity – which rose<br />
12% to EUR 8 billion – and the further improvement in our<br />
solvency ratio, which was almost twice as high as the legally<br />
required level.<br />
In structural terms, the Group again boosted its effi ciency<br />
and performance capability in 2010. Aft er just one and a<br />
half years of preparation and implementation, the primary<br />
insurance sector has been operating with joint central functions<br />
since January 2011. Not only does this bring effi ciency<br />
enhancements, it also delivers appreciable cost savings.<br />
We are continuing to follow this path systematically and have<br />
now begun to reorganize the Retail Germany division. The<br />
bywords here are benefi ts to the customer, effi ciency and<br />
performance culture. In this division, too, our goal is to chart<br />
a course for long-term, profi table growth and to make the<br />
undertaking equally attractive to staff , customers and share-<br />
holders alike. With this in mind, we shall succeed in laying<br />
the foundation for successful development, since this division<br />
off ers considerable potential for the future.<br />
The fi rst fruits of the restructuring will be evident in 2011, but<br />
overall they will not yet make themselves felt in the result.<br />
Heavy major losses will again make their mark on our performance<br />
in 2011. This is especially true of the devastating<br />
earthquake and tsunami in Japan, the human consequences<br />
of which are almost impossible to grasp. It is for this reason<br />
that in 2011 we again do not expect to match up to the excellent<br />
result of 2009. Yet we are by no means dissatisfi ed with<br />
the outlook. There are signs that conditions for insurers are<br />
improving across a broad front; both on the reinsurance side<br />
and in the motor and industrial insurance lines the markets<br />
would appear to be picking up. Similarly, early successes of<br />
our structural measures – such as the gratifying increase in<br />
new life insurance business – encourage us to look to 2011<br />
with confi dence.<br />
I would like to take this opportunity to express my appreciation<br />
to all the members of staff who again worked with<br />
considerable dedication in the fi nancial year just-ended. Not<br />
only that, my thanks are also due to our customers and cooperation<br />
partners for the trust that they again placed in us in<br />
2010. Along with our commitment to continuing the successful<br />
development of <strong>Talanx</strong>, living up to this trust remains our<br />
paramount mission for 2011.<br />
Yours sincerely,<br />
Herbert K. Haas<br />
<strong>Talanx</strong> Group up 5<br />
City Guide<br />
Letter from the Chairman<br />
Boards and Committees<br />
Report of the Supervisory Board<br />
<strong>Talanx</strong> City<br />
City News
6 <strong>Talanx</strong> Group Annual Report 2010<br />
Herbert K. Haas<br />
Dr. Immo Querner<br />
Dr. Thomas Noth
Dr. Christian Hinsch<br />
Dr. Heinz-Peter Roß<br />
Torsten Leue<br />
Ulrich Wallin<br />
<strong>Talanx</strong> Group<br />
City Guide de<br />
Letter from the Chairman an<br />
Boards and Committees es<br />
Report of the Supervisory Board rd<br />
<strong>Talanx</strong> City ty<br />
City News ws<br />
7
8 <strong>Talanx</strong> Group Annual Report 2010<br />
Board of Management<br />
Herbert K. Haas<br />
Chairman<br />
Dr. Christian Hinsch<br />
Deputy Chairman<br />
Norbert Kox<br />
(until 31.05.2010)<br />
Torsten Leue<br />
(from 01.09.2010)<br />
Chairman of the Board of Management<br />
HDI Haft pfl icht verband der Deutschen Industrie V. a. G.,<br />
Hannover<br />
Deputy Chairman of the Board of Management<br />
HDI Haft pfl ichtverband der Deutschen Industrie V. a. G.,<br />
Chairman of the Management Board<br />
HDI-Gerling Industrie Versicherung AG, Hannover<br />
Chairman of the Management Board<br />
ProACTIV Holding AG, Hilden<br />
Chairman of the Management Board<br />
<strong>Talanx</strong> International AG, Hannover<br />
Dr. Thomas Noth Chairman of the Management Board<br />
<strong>Talanx</strong> Systeme AG, Hannover<br />
Dr. Immo Querner Member of the Board of Management<br />
HDI Haft pfl ichtverband der Deutschen Industrie V. a. G.,<br />
Hannover<br />
Dr. Heinz-Peter Roß Chairman of the Management Board<br />
<strong>Talanx</strong> Deutschland AG, Hannover<br />
Ulrich Wallin Chairman of the Executive Board<br />
Hannover Rückversicherung AG, Hannover<br />
Responsible on the <strong>Talanx</strong><br />
Board of Management for<br />
Corporate Development<br />
Investor Relations<br />
Public Relations<br />
Legal Aff airs<br />
Internal Auditing<br />
Executive Staff Functions/Compliance<br />
Division: Industrial Lines<br />
Facility Management<br />
Human Resources<br />
Procurement<br />
Reinsurance Purchasing<br />
Former Domestic and Foreign<br />
Bancassurance Division<br />
Division: Retail International<br />
Information Services<br />
Finance/Participating Interests/<br />
Real Estate<br />
Investments<br />
Controlling<br />
Collections<br />
Risk Management<br />
Accounting/Taxes<br />
Division: Retail Germany<br />
Business Organization<br />
Division: Reinsurance
Supervisory Board<br />
Wolf-Dieter Baumgartl<br />
Chairman<br />
Former Chairman of the Board of<br />
Management of <strong>Talanx</strong> AG,<br />
Berg<br />
Ralf Rieger<br />
Deputy Chairman<br />
Employee,<br />
HDI-Gerling Vertrieb Firmen<br />
und Privat AG,<br />
Raesfeld<br />
Prof. Dr. Eckhard Rohkamm<br />
Deputy Chairman<br />
Former Chairman of the Board of<br />
Management of ThyssenKrupp<br />
Technologies AG,<br />
Hamburg<br />
Karsten Faber<br />
Managing Director,<br />
Hannover Rückversicherung AG,<br />
E+S Rückversicherung AG,<br />
Hannover<br />
Jutta Hammer<br />
(from 01.02.2011)<br />
Employee, HDI-Gerling<br />
Leben Betriebsservice GmbH,<br />
Bergisch Gladbach<br />
Hans-Ulrich Hanke<br />
(until 31.01.2011)<br />
Employee, HDI-Gerling<br />
Leben Betriebsservice GmbH,<br />
Brühl<br />
Gerald Herrmann<br />
Trade union secretary,<br />
Norderstedt<br />
Dr. Thomas Lindner<br />
Chairman of the Board of<br />
Management of Groz-Beckert KG,<br />
Albstadt<br />
Jutta Mück<br />
Employee, HDI-Gerling<br />
Industrie Versicherung AG,<br />
Oberhausen<br />
Otto Müller<br />
Employee,<br />
Hannover Rückversicherung AG,<br />
Hannover<br />
Dr. Hans-Dieter Petram<br />
Former Member of the Board of<br />
Management of Deutsche Post AG,<br />
Inning<br />
Dr. Michael Rogowski<br />
Chairman of the Foundation Council<br />
of Hanns-Voith-Stift ung,<br />
Heidenheim<br />
Katja Sachtleben-Reimann<br />
Employee, <strong>Talanx</strong> Service AG,<br />
Hannover<br />
Dr. Erhard Schipporeit<br />
Former Member of the Board of<br />
Management of E.ON AG,<br />
Hannover<br />
Bodo Uebber<br />
Member of the Board of<br />
Management of Daimler AG,<br />
Stuttgart<br />
<strong>Talanx</strong> Group<br />
City Guide<br />
Letter from the Chairman<br />
Boards and Committees<br />
Report of the Supervisory Board<br />
<strong>Talanx</strong> City<br />
City News<br />
Prof. Dr. Ulrike Wendeling-Schröder<br />
Professor at Leibniz University,<br />
Hannover<br />
Werner Wenning<br />
Former Chairman of the Board of<br />
Management of Bayer AG,<br />
Leverkusen<br />
9
10 <strong>Talanx</strong> Group Annual Report 2010<br />
Supervisory Board Committees<br />
Composition as at 31.12.2010<br />
Finance and Audit<br />
Committee<br />
Wolf-Dieter Baumgartl<br />
Chairman<br />
Dr. Thomas Lindner<br />
Ralf Rieger<br />
Prof. Dr. Eckhard Rohkamm<br />
Dr. Erhard Schipporeit<br />
Tasks of the committees<br />
Finance and Audit<br />
Committee<br />
Preparation of fi nancial<br />
decisions for the full<br />
Supervisory Board<br />
Decisions in lieu of the full<br />
Supervisory Board on certain<br />
fi nancial matters, including<br />
the establishment<br />
of companies, acquisition<br />
of participations and capital<br />
increases at subsidiaries<br />
within defi ned value limits<br />
Personnel Committee<br />
Wolf-Dieter Baumgartl<br />
Chairman<br />
Prof. Dr. Eckhard Rohkamm<br />
Dr. Michael Rogowski<br />
Prof. Dr. Ulrike Wendeling-<br />
Schröder<br />
Personnel Committee<br />
Preparation of personnel<br />
matters for the full<br />
Supervisory Board<br />
Decisions in lieu of the full<br />
Supervisory Board on certain<br />
personnel matters for<br />
which the full Supervisory<br />
Board is not required to<br />
assume responsibility<br />
Mediation Committee<br />
Wolf-Dieter Baumgartl<br />
Chairman<br />
Ralf Rieger<br />
Prof. Dr. Eckhard Rohkamm<br />
Katja Sachtleben-Reimann<br />
Mediation Committee<br />
Proposal for the appointment<br />
of a Board member<br />
if the necessary two-thirds<br />
majority is not achieved in<br />
the fi rst ballot (§ 31 Para. 3<br />
Co-Determination Act)<br />
Nomination Committee<br />
Wolf-Dieter Baumgartl<br />
Chairman<br />
Dr. Thomas Lindner<br />
Dr. Michael Rogowski<br />
The Supervisory Board has formed four committees from among its ranks. They support the full Supervisory Board in the<br />
performance of its tasks.<br />
Nomination Committee<br />
Proposal of suitable candidates<br />
for the Supervisory<br />
Board’s nominations to the<br />
General Meeting
Report of the<br />
Supervisory Board<br />
In the 2010 fi nancial year the Supervisory Board performed<br />
its functions and duties at all times in accordance with statutory<br />
requirements, the Articles of Association and the Rules<br />
of Procedure. We considered at length the economic situation,<br />
risk position and strategic development of <strong>Talanx</strong> AG<br />
and its major subsidiaries. We advised the Board of Management<br />
on the direction of the company, monitored the management<br />
of business and were directly involved in decisions<br />
of fundamental importance.<br />
In the year under review we came together for four ordinary<br />
meetings of the Supervisory Board, which were held on<br />
26 March, 28 May, 31 August and 13 November 2010. As in the<br />
previous year, the Federal Financial Supervisory Authority<br />
(BaFin) exercised its legal powers and sent two representatives<br />
to attend one of these meetings. The Finance and Audit<br />
Committee of the Supervisory Board met four times and the<br />
Personnel Committee met on three occasions. The Mediation<br />
Committee formed in accordance with the requirements of<br />
the Co-Determination Act again had no reason to meet in<br />
2010. The full Supervisory Board was briefed on the work of<br />
the various committees. In addition, we received quarterly<br />
written reports from the Board of Management on the course<br />
of business and the position of the company and the Group.<br />
At no point in the year under review did we consider it necessary<br />
to conduct audit measures pursuant to § 111 Para. 2<br />
Sentence 1 German Stock Corporation Act (AktG). Insofar as<br />
transactions requiring approval arose between meetings,<br />
the Board of Management submitted these to us for a written<br />
resolution. The Chairman of the Supervisory Board also<br />
remained in constant contact with the Chairman of the Board<br />
of Management and was regularly advised of all important<br />
business transactions within the company and the <strong>Talanx</strong><br />
Group. All in all, within the scope of our statutory responsibilities<br />
and those prescribed by the Articles of Association we<br />
assured ourselves of the lawfulness, expediency, regularity<br />
and effi ciency of the actions of the Board of Management.<br />
The Board of Management provided us with regular, timely<br />
and comprehensive information about the business and<br />
fi nancial situation – including the risk situation and risk<br />
management –, about major capital expenditure projects<br />
and fundamental issues of corporate <strong>policy</strong> as well as about<br />
transactions that – while not subject to the approval of the<br />
Supervisory Board – nevertheless need to be reported in<br />
accordance with the requirements of the Rules of Procedure.<br />
At our meetings we considered at length the reports provided<br />
by the Board of Management and put forward suggestions<br />
and proposed improvements.<br />
Key areas of discussion for the full<br />
Supervisory Board<br />
<strong>Talanx</strong> Group<br />
City Guide<br />
Letter from the Chairman<br />
Boards and Committees<br />
Report of the Supervisory Board<br />
<strong>Talanx</strong> City<br />
City News<br />
The business development of the company and the individual<br />
Group segments, the reorientation of the Group and optimization<br />
of its structures as well as the planning for 2011 formed<br />
the primary focus of the reporting and were discussed in detail<br />
at our meetings. The reasons for divergences between the<br />
business experience and the relevant plans and targets in the<br />
fi nancial year just-ended were explained to us, and we were<br />
able to satisfy ourselves accordingly with the explanations<br />
provided.<br />
At the end of 2009, as part of the Group’s reorientation and<br />
the optimization of its structures, we approved a modifi ed<br />
allocation of responsibilities for the Board of Management<br />
– which came into eff ect progressively in the course of 2010 –<br />
and adopted the necessary resolutions for implementation of<br />
the target structure.<br />
A further focus of our deliberations was risk management<br />
within the Group. The risk reporting by the Board of Management<br />
was a matter for discussion at each meeting of the<br />
Supervisory Board. In addition, we considered a number of<br />
acquisition, disposal and cooperation projects, which the<br />
Board of Management presented to us for discussion and<br />
adoption of a resolution. Specifi cally, reference may be made<br />
here to the sale of the US-based Clarendon National Insurance<br />
Company and its subsidiaries, the establishment of a<br />
cooperation arrangement with Meiji Yasuda Life Insurance<br />
Company, the purchase of an insurance company in the<br />
Netherlands and the acquisition of a minority stake in an<br />
Austrian investment company. Not only that, the strategic<br />
orientation of the new division of Retail Germany as well as<br />
the globalization strategy pursued in Industrial Lines were<br />
considered by the Supervisory Board. In this connection various<br />
acquisition projects were explored in 2010, inter alia in<br />
Vietnam, Canada and Argentina; we were kept informed of<br />
the status of these deliberations and discussions.<br />
With an eye to § 87 Para. 1 Stock Corporation Act (AktG) as<br />
amended by the Act on the Adequacy of Management Board<br />
Remuneration (VorstAG), the full Supervisory Board consid-<br />
11 1
12 <strong>Talanx</strong> Group Annual Report 2010<br />
ered the specifi cation of the bonuses for the members of the<br />
Board of Management and reviewed the fi xed remuneration<br />
of individual members of the Board of Management; in this<br />
context it drew inter alia on horizontal and vertical remuneration<br />
aspects and concepts as a means of comparison and<br />
orientation. Considerable attention was also devoted to the<br />
reorganization of the system of remuneration for the Board<br />
of Management and the adjustment of the contracts of service<br />
with the members of the Board of Management. These<br />
revisions were approved at the meeting of the Supervisory<br />
Board held on 13 November 2010. In addition, at this meeting<br />
the Supervisory Board was informed about the structure of<br />
the remuneration systems within the Group as required by<br />
§ 3 Para. 5 of the Regulation on the Supervisory Law Requirements<br />
for Remuneration Schemes in the Insurance Sector<br />
(Versicherungs-Vergütungsverordnung).<br />
The transactions and measures subject to approval in accordance<br />
with legal requirements, the company’s Articles of<br />
Association and its Rules of Procedure were agreed with the<br />
Board of Management following examination and discussion.<br />
The Supervisory Board gave the necessary consent to<br />
the control and profi t transfer agreement of <strong>Talanx</strong> AG with<br />
HDI-Gerling Gesellschaft für IT-Dienstleistungen mbH – now<br />
<strong>Talanx</strong> Systeme AG – on the basis of the written and verbal<br />
explanations provided by the Board of Management.<br />
Work of the Committees<br />
Along with preparations for discussion and adoption of resolutions<br />
in the full Supervisory Board, the Finance and Audit<br />
Committee of the Supervisory Board considered at length<br />
the company’s quarterly fi nancial statements compiled on<br />
a voluntary basis. Furthermore, the Finance and Audit Committee<br />
discussed the fi ndings of an actuarial audit of the net<br />
loss reserves for non-life insurance business within the <strong>Talanx</strong><br />
Group as well as the profi tability trend at the individual Group<br />
companies as at 31 December 2009 and considered the internal<br />
control system, the risk reports, the work of the internal<br />
auditing department and the annual report submitted by the<br />
Chief Compliance Offi cer.<br />
The Personnel Committee, together with external advisers,<br />
prepared the review of the remuneration system for the Board<br />
of Management – including the major contractual elements –<br />
at a number of meetings. It presented to the full Supervisory<br />
Board a proposal for the reorganization of the remuneration<br />
system with a view to satisfying, in the fi rst place, the supervisory<br />
standards and, subsequently, in the course of 2010 – following<br />
the entry into force of the legal bases and specifi cations<br />
handed down by lawmakers – the new legal requirements<br />
as well. In a written procedure the Committee – following<br />
approval of the new remuneration system by the full Supervisory<br />
Board – defi ned the targets for the individual members<br />
of the Board of Management in the 2011 fi nancial year. Furthermore,<br />
recommendations were made to the full Supervisory<br />
Board with respect to upcoming reappointments and in the<br />
context of the setting of bonuses and the review of the fi xed<br />
remuneration for members of the Board of Management.<br />
Corporate Governance<br />
The Supervisory Board again devoted special attention to the<br />
issue of Corporate Governance. In accordance with the provisions<br />
of the German Corporate Governance Code, the existing<br />
Supervisory Board remuneration consisting exclusively of<br />
fi xed components was extended to include a variable component<br />
and the amount of remuneration was reviewed with an<br />
eye to its appropriateness and brought more closely into line<br />
with the level of relevant competitors.<br />
The deductibles in the D&O cover were revised and adjusted<br />
in line with the changed legal environment.<br />
Audit of the annual and consolidated<br />
fi nancial statements<br />
The annual fi nancial statements of <strong>Talanx</strong> AG submitted by<br />
the Board of Management, the fi nancial statements of the<br />
<strong>Talanx</strong> Group – drawn up in accordance with International<br />
Financial Reporting Standards (IFRS) – as well as the corresponding<br />
management reports and the bookkeeping system<br />
were audited by KPMG AG, Wirtschaft sprüfungsgesellschaft ,<br />
Hannover. The General Meeting appointed the auditors; the<br />
Finance and Audit Committee awarded the concrete audit<br />
mandate. In addition to the usual audit tasks, the Committee<br />
placed special emphasis on the implementation of the Act on<br />
the Modernization of Accounting Law (BilMoG) as well as – in<br />
the case of the consolidated fi nancial statements – on the
measurement of the deferred acquisition costs, the determination<br />
of the fair values of investments with a special eye to<br />
the fair value hierarchy and on taxes. The audit concentrations<br />
of the Financial Reporting Enforcement Panel (FREP)<br />
were also the subject of the audit procedures carried out by<br />
the auditors.<br />
The audits conducted by the auditors gave no grounds for<br />
objection. The unqualifi ed audit certifi cates that were issued<br />
state that the accounting, annual fi nancial statements and<br />
consolidated fi nancial statements give a true and fair view<br />
of the net assets, fi nancial position and results and that the<br />
management reports suitably refl ect the annual and consolidated<br />
fi nancial statements.<br />
The fi nancial statements and the audit reports of KPMG were<br />
distributed to all the members of the Supervisory Board in<br />
due time. They were examined in detail at a meeting of the<br />
Finance and Audit Committee on 16 May 2011 and at a meeting<br />
of the Supervisory Board on 17 May 2011. The auditor took<br />
part in the deliberations of the Finance and Audit Committee<br />
and of the full Supervisory Board regarding the annual and<br />
consolidated fi nancial statements, reported on the conduct of<br />
the audits and was available to provide the Supervisory Board<br />
with additional information. In accordance with the fi nal<br />
outcome of our own examination of the annual fi nancial<br />
statements, the consolidated fi nancial statements, the corresponding<br />
management reports and the audit reports, we<br />
concurred with the opinion of the auditors and approved the<br />
annual and consolidated fi nancial statements drawn up by<br />
the Board of Management.<br />
The annual fi nancial statements are thus adopted. We approve<br />
of the statements made in the management reports<br />
regarding the further development of the company. Aft er<br />
examination of all relevant considerations we agree with the<br />
Board of Management’s proposal for the appropriation of the<br />
disposable profi t.<br />
The report on the company’s relations with affi liated companies<br />
drawn up by the Board of Management in accordance<br />
with § 312 German Stock Corporation Act (AktG) has likewise<br />
been examined by KPMG Aktiengesellschaft , Wirtschaft sprüfungsgesellschaft<br />
, Hannover, and given the following unqualifi<br />
ed audit certifi cate:<br />
“Having audited the report in accordance with our professional<br />
duties, we confi rm that<br />
1. its factual details are correct,<br />
2. in the case of the transactions detailed in the report, the<br />
expenditure of the company was not unreasonably high.”<br />
We have examined the report on relations with affi liated<br />
companies; we reached the same conclusion as the auditors<br />
and have no objections to the statement reproduced in this<br />
report.<br />
Changes on the Board of Management<br />
and Supervisory Board<br />
With eff ect from 1 September 2010 Mr. Torsten Leue was<br />
appointed as a new member of the company’s Board of Management;<br />
from this date onwards he assumed responsibility<br />
for the newly formed Retail International division. In addition,<br />
the Supervisory Board decided to renew the Board mandates<br />
of Dr. Hinsch, Dr. Querner and Dr. Noth – which were<br />
due to expire in 2011 – as well as to renew the mandate of<br />
Mr. Haas, which was set to expire at the beginning of 2012.<br />
With eff ect from the end of 31 January 2011 Mr. Hans-Ulrich<br />
Hanke stepped down from the company’s Supervisory Board<br />
as a representative of the employees. The Supervisory Board<br />
expressed its appreciation and recognition of his constructive<br />
and dedicated contribution. With eff ect from 1 February 2011<br />
Ms. Jutta Hammer succeeded him as a member of the Supervisory<br />
Board for the remainder of the current term of offi ce.<br />
Word of thanks to the Board of<br />
Management and staff<br />
The Board of Management and staff worked and acted with<br />
dedication and prudence in an environment that continued<br />
to be challenging. The Supervisory Board would like to<br />
express its special appreciation of their eff orts.<br />
Hannover, 17 May 2011<br />
For the Supervisory Board<br />
Wolf-Dieter Baumgartl<br />
(Chairman)<br />
<strong>Talanx</strong> Group up 13 1<br />
City Guide<br />
Letter from the Chairman<br />
Boards and Committees<br />
Report of the Supervisory Board<br />
<strong>Talanx</strong> City<br />
City News
14 <strong>Talanx</strong> Group Annual Report 2010<br />
Urban planning needs a strategy<br />
Urban planning and urban development are time-tested<br />
me-tested<br />
cultural techniques. Long before our calendar began geographers,<br />
architects, engineers, landscape and area reaplanners have dedicated themselves to the art of how ow a place<br />
of co existence should look and what role it should uld play in<br />
a larger geographical space. They have drawn up p plans as means means managing the entire development of the city city, ii. ee. also<br />
to how the place should be designed and how it must be with an eye to social, economic, cultural and ecological con-<br />
further developed in order to off er a secure and pleasant siderations. City planners work on an interdisciplinary and<br />
quality of life while at the same time serving as a center of integrated basis with a forward-looking gaze. This also applies<br />
attraction for people.<br />
to the Group strategy, which shows the way forward for the<br />
entire Group and defi nes clear goals. Building upon this foun-<br />
<strong>Talanx</strong> stands on a solid fi nancial foundation, exerts considdation, each division – each district – has a development plan<br />
erable appeal and has excellent fi nancial strength! With a tailored exactly to its needs – one which enhances the par-<br />
view to making sure that this remains the case, plans for the ticular locality and helps the city as a whole to perform more<br />
future of <strong>Talanx</strong> City are already in place. Urban development successfully in the competitive environment.
This planning is intended to ensure that <strong>Talanx</strong> City preserves<br />
its appeal and continues to handle its tasks effi ciently<br />
and successfully. This is precisely what constitutes the backdrop<br />
for our latest urban planning activities. Following the<br />
rapid and successful incorporation of the Gerling companies,<br />
the most pressing task facing the city fathers was to optimize<br />
the structure of the <strong>Talanx</strong> Group. At the core of this planning<br />
is a reconfi guration of the city’s districts, the various<br />
parts that make up its primary insurance business. They<br />
<strong>Talanx</strong> City<br />
City Guide<br />
Letter from the Chairman<br />
Boards and Committees<br />
Report of the Supervisory Board<br />
Urban Development<br />
City News<br />
are to be geared to our customer segments: specifi cally, to<br />
industrial lines worldwide and to German and international<br />
retail business, in the latter cases spanning the various lines<br />
of insurance. The city fathers have identifi ed here a great<br />
opportunity to strengthen the characteristic features of each<br />
new district as well as the unchanged district of reinsurance<br />
and to further enhance their appeal to visitors and residents<br />
alike – i. e. to customers, investors and employees. For the city<br />
as a whole, this means that its power of attraction will continue<br />
to grow and it will climb higher in the rankings relative<br />
to its rivals.<br />
15 1
Hot<br />
spot
The city as a tourist attraction<br />
What gives a city its power to draw people? Its name must<br />
fi ll us with longing, since it is not for nothing that the mere<br />
mention of Vienna, Paris and Rome conjures up certain connotations<br />
in our minds. It must represent a culture. Every<br />
district must have its own sights, and it must know how to<br />
profi le them correctly to specifi c target groups. What the<br />
zoo means to children, the opera means to lovers of classical<br />
music.<br />
<strong>Talanx</strong> City has tailored its urban development to precisely fi t<br />
its target groups, investors and defi ned customer segments:<br />
The Reinsurance district is home to some 2,100 people. It<br />
is planned that Hannover Re will continue to expand the<br />
attractions that investors and clients so value: it will strive<br />
to remain not only one of the most eff ective and largest<br />
non-life reinsurers in the world, but also one of the most<br />
profi table. In life and health reinsurance it plans to become<br />
one of the three major, globally operating players of aboveaverage<br />
profi tability within the next fi ve years.<br />
In the Industrial Lines district, roughly 2,000 employees<br />
in 29 markets all around the globe are already working to<br />
keep their customers satisfi ed – something which they do<br />
Diversity promotes<br />
attraction<br />
<strong>Talanx</strong> City<br />
City Guide<br />
Letter from the Chairman<br />
Boards and Committees<br />
Report of the Supervisory Board<br />
Hot Spot<br />
City News<br />
in more than 130 countries. The plan for further enhancing<br />
the appeal of this district envisages the creation of a global<br />
player present and able to act throughout the world on the<br />
basis of its own resources.<br />
Some 6,600 people live in the Retail Germany district. This<br />
part of town is facing quite an upheaval: the market share<br />
is to be profi tably enlarged, the expense ratio made more<br />
competitive and the value to the customer optimized. This is<br />
to be accomplished by rebuilding structures to suit today’s<br />
requirements. Only in this way can appropriate solutions<br />
geared to specifi c target groups be developed in this district<br />
– solutions that will make it a real crowd puller.<br />
The Retail International district also has an ambitious urban<br />
plan: home to some 5,200 residents, this area is expected to<br />
grow in the strategic target markets of Central and Eastern<br />
Europe as well as Latin America, to optimize its activities in<br />
existing markets and to tap into new markets. In this part of<br />
town, despite all the diff erences between the target markets,<br />
it is possible to transfer experiences, approaches and products<br />
to other markets. Through its familiarity with a broad<br />
range of international retail markets, this district will evolve<br />
into a know-how carrier and hence fi nd it easier to expand its<br />
business or enter lucrative new markets.<br />
17 1
18 <strong>Talanx</strong> Group Annual Report 2010<br />
Integrated infrastructure<br />
At best, a city without functioning infrastructure quickly<br />
loses its appeal. At worst, it collapses. An inadequate infrastructure<br />
obstructs the city’s growth and smooth co-existence.<br />
A poorly developed health system with no effi cient<br />
hospitals or lack of specialist physicians, traffi c jams, a public<br />
transport system that fails to work, inadequate supply and<br />
disposal networks for water, sewage, electricity, gas, telecommunications<br />
and garbage not only have a diminishing eff ect<br />
on the quality of life. In the long run, such symptoms cause<br />
stress and illness. What is more, they have a detrimental<br />
impact on business.<br />
This is why it is vital for an urban center such as <strong>Talanx</strong> City<br />
to ensure through effi cient central functions that its infrastructure<br />
is state-of-the-art or – even better – a little ahead of<br />
its time. <strong>Talanx</strong> is therefore overhauling the infrastructure<br />
for its central functions: when it comes to the Group’s most<br />
valuable internal commodity, namely information, the transportation<br />
system – the information technology – simply has<br />
to work. That is the job of the IT departments, which are to<br />
be concentrated in the course of the year at <strong>Talanx</strong> Systeme<br />
AG. Working in cooperation with the various districts, it will<br />
be ensured through development and space utilization plans<br />
network<br />
Urban<br />
that the districts are able to fulfi ll their tasks and objectives<br />
and boost their performance capability.<br />
Equally indispensable for the proper functioning of the city<br />
are effi cient processes in other key infrastructure tasks – a<br />
role covered by <strong>Talanx</strong> Service AG. As the central pivot point<br />
in primary insurance business, it will enhance the effi ciency<br />
of the original functions in the districts, harmonize, render<br />
transparent and standardize services for users and provide<br />
the districts with consistent fi nancial data. The districts will,<br />
however, retain certain service functions that are particularly<br />
closely related to their operational business. For it remains<br />
the case going forward, as in the past, that full profi t and cost<br />
responsibility rests with the districts.<br />
<strong>Talanx</strong> AG is extending its function from that of a pure<br />
fi nancial holding company to a fi nancial and management<br />
holding company. This means that the city will be directed<br />
more closely from <strong>Talanx</strong> AG. The latter will continue to<br />
exercise its previous strategic functions, but it will also<br />
exert a greater infl uence on the positioning and performance<br />
of the divisions in order to safeguard adherence to<br />
the overall strategy.
Goods and data must be<br />
moved around if the city is<br />
to function smoothly<br />
<strong>Talanx</strong> City<br />
City Guide<br />
Letter from the Chairman<br />
Boards and Committees<br />
Report of the Supervisory Board<br />
Urban Network<br />
City News<br />
19 1
20 <strong>Talanx</strong> Group Annual Report 2010<br />
The city as a human habitat<br />
A city and its inhabitants have a symbiotic relationship –<br />
the city shapes its residents, the residents shape their city<br />
and in this way enhance its appeal to people who would<br />
like to live there. And those who enjoy living in their city<br />
also take pride in it.<br />
With a population of 17,000, <strong>Talanx</strong> City ranks among<br />
Europe’s largest “insurance metropolises”. The inhabitants<br />
are a thoroughly international mix – people from 40 countries<br />
and fi ve continents live in <strong>Talanx</strong> City. For the German<br />
residents – and only for this part of the population detailed<br />
surveys are available – the proportion of female employees<br />
stood at 47%, the average age was 43.5. Both these fi gures<br />
are slightly above the average. The period of residence, i.e. the<br />
length of service with the company, is also above average at<br />
14.2 years and testifi es to just how much people enjoy living<br />
in <strong>Talanx</strong> City.<br />
Quality<br />
of life<br />
What must a city off er its residents? Pleasant living conditions,<br />
a healthy environment, good infrastructure, cultural<br />
life. To put it another way, good working conditions, appropriate<br />
remuneration, adequate opportunities for training<br />
and development, a healthy working atmosphere. Conditions<br />
such as these attract highly skilled, well educated,<br />
creative and motivated people.<br />
In the future, <strong>Talanx</strong> City wants to further boost its appeal<br />
as it competes with other “cities” for this clientele. The districts<br />
and head offi ce have therefore developed a series of<br />
measures designed to publicize largely undiscovered career<br />
openings and interesting entry opportunities and hence<br />
attract immigrants. In addition to enhancing its attraction<br />
for new settlers, the city is also working constantly<br />
on improvements for its current residents. Even now, a<br />
broad variety of part-time working models are intended to<br />
make work and family life more compatible – inter alia by<br />
increasingly ensuring that childcare facilities are available<br />
in the immediate vicinity of the workplace. Yet the city<br />
also supports its residents in their leisure time: <strong>Talanx</strong> City<br />
sponsors numerous team sports events by covering registration<br />
fees and supplying jerseys; the inhabitants of all<br />
parts of the city are only too happy to take up such off ers<br />
of assistance.
Life and work –<br />
not incompatible<br />
opposites tes<br />
<strong>Talanx</strong> City<br />
City Guide<br />
Letter from the Chairman<br />
Boards and Committees<br />
Report of the Supervisory Board<br />
Quality of Life<br />
City News<br />
21 2
22 <strong>Talanx</strong> Group Annual Report 2010<br />
Life in society<br />
The highly diverse cultural off erings of a large city can be<br />
crucial to a resident’s decision to live there rather than moving<br />
out into the countryside or a small town. The opportunities<br />
for education and training – from primary school to<br />
university level – can also be richer.<br />
In <strong>Talanx</strong> City training and personnel development activities<br />
are included among the measures designed to make urban<br />
life more promising. Members of staff receive targeted support<br />
for their demanding duties with the aim of consolidating<br />
and extending their above-average skills set. In this way,<br />
the idea is to optimally prepare the city for fresh competitive<br />
challenges. In addition to the fostering of specialist qualifi cations,<br />
wide-ranging training activities in methodological and<br />
social skills are regularly off ered right across all the districts.<br />
Urban<br />
culture<br />
On the Group level the most notable innovation is the<br />
establishment of the <strong>Talanx</strong> Corporate Academy. Working<br />
in cooperation with leading European business schools, this<br />
off ers a particularly high-caliber training program for senior<br />
managers at all Group companies worldwide. Supplementing<br />
the off erings of the divisions and national companies, the<br />
Corporate Academy serves in particular to convey the strategy<br />
and management methods of <strong>Talanx</strong>. Professors from<br />
highly reputed business schools and members of the <strong>Talanx</strong><br />
Board of Management complement one another as speakers<br />
and discussants.<br />
Considerable importance also attaches to initial training in<br />
<strong>Talanx</strong> City: for young people, solid training is essential for<br />
getting off to a successful start in working life. For the city,<br />
it means an enduring supply of skilled, qualifi ed and motivated<br />
residents.
Education and training is a matter of such fundamental<br />
importance to <strong>Talanx</strong> that it has placed it front and center of<br />
its responsibility to society. As a key element in its range of<br />
corporate social responsibility activities, the Group has set<br />
up the <strong>Talanx</strong> Foundation. This makes funds available for the<br />
awarding of scholarships to students. And so we already fi nd<br />
ourselves right in the midst of the diverse array of measures<br />
relating to corporate social responsibility, a concern that is<br />
perceived within the city in three ways: operating according<br />
to sustainable business practices, developing products that<br />
promote environmental protection, effi cient energy consumption<br />
or social responsibility, and observing such criteria<br />
in our own investments. Each of these considerations is<br />
refl ected in numerous examples – whether it be power-saving<br />
measures in our own buildings, solutions that respond to<br />
environmental concerns such as photovoltaic systems or fueleffi<br />
cient vehicles, or investment products that take account of<br />
sustainability or ecological aspects.<br />
Performing<br />
together<br />
<strong>Talanx</strong> City<br />
City Guide<br />
Letter from the Chairman<br />
Boards and Committees<br />
Report of the Supervisory Board<br />
Urban Culture<br />
City News<br />
23 2
24 <strong>Talanx</strong> Group Annual Report 2010<br />
Newspaper for the <strong>Talanx</strong> Group and its Subsidiaries<br />
PUBLISHED BY THE TALANX GROUP 1 € TAL WWW.TALANX.COM<br />
AmpegaGerling<br />
takes stake in asset<br />
manager C-QUADRAT<br />
Cologne, 13 October. Ampega-<br />
Gerling Asset Management<br />
GmbH is acquiring a stake in<br />
C-QUADRAT Investment AG.<br />
AmpegaGerling will hold an<br />
interest of 25.1% in C-QUADRAT<br />
on a long-term basis. An independent<br />
quantitative asset<br />
manager, C-QUADRAT is<br />
promisingly positioned and<br />
has won multiple awards for<br />
its outstanding management<br />
of investment funds.<br />
<strong>Talanx</strong><br />
Foundation<br />
awards<br />
scholarships<br />
Essen, 19 March. The <strong>Talanx</strong><br />
Foundation, which was established<br />
in 2009, has awarded<br />
its first ten scholarships. The<br />
recipients are top-flight students<br />
from various insurancerelated<br />
disciplines at selected<br />
universities. The scholarship<br />
funding lasts for 12 months<br />
and may be extended until<br />
the end of the regular period<br />
of study. In launching this<br />
program <strong>Talanx</strong> AG is actively<br />
taking responsibility for the<br />
emphasis that it has chosen<br />
to place on “Education and<br />
training”.<br />
City News<br />
Hiroakai Tonooka (Senior Managing Executive Officer Meiji Yasuda) and Herbert K. Haas (CEO <strong>Talanx</strong>)<br />
<strong>Talanx</strong>: strategic cooperation with<br />
Japanese life insurer<br />
Hannover/Tokyo, 4 November. The fourth-largest verts to common shares of <strong>Talanx</strong> if the company<br />
Japanese life insurer Meiji Yasuda and <strong>Talanx</strong> AG are goes public. Meiji Yasuda Life will then become a<br />
sealing a long-term strategic cooperation with the major shareholder of <strong>Talanx</strong> AG. The special feature<br />
goal of leveraging joint business opportunities in of the bond is its recognition as regulatory Tier 1<br />
foreign markets. Meiji Yasuda is entering into a cap- capital (equity substitute) under Solvency II. With<br />
ital participation of EUR 300 million in <strong>Talanx</strong> AG. this bond issue the <strong>Talanx</strong> Group has succeeded in<br />
To this end, it is buying a convertible bond that con- pulling off a true capital market innovation.<br />
Assekurata gives very good rating to<br />
Targo Lebensversicherung<br />
Hilden/Dusseldorf, 7 October. Assekurata has given<br />
Targo Lebensversicherung a rating of A+ for the<br />
seventh consecutive time. The company’s security<br />
was singled out for special praise. This is reflected in<br />
above-average own funds and unrestricted surplus<br />
funds, which at 21.99% are more than double the<br />
market figure of 8.89%. The company’s risk management<br />
is also assessed as excellent.
CITY NEWS 2010<br />
Hannover Re supports modeling<br />
of global earthquake risks<br />
Hannover/Pavia, 23 September. Hannover Re has<br />
entered into a partnership agreement with the<br />
“Global Earthquake Model” (GEM) Foundation. It<br />
will contribute EUR 1 million and technical expertise<br />
in support of the development of the first<br />
global earthquake risk model on an open-source<br />
basis. GEM, which was launched by the OECD in<br />
Cologne, 22 November. The highly reputed rating<br />
agency Standard & Poor’s has confirmed HDI-<br />
Gerling Lebensversicherung AG’s long-standing<br />
<strong>Award</strong>-<strong>winning</strong><br />
children’s <strong>policy</strong><br />
Cologne, 12 May. The children’s provision product<br />
KÄNGURU.invest offered by HDI-Gerling Lebensversicherung<br />
has been rated “very good” by the<br />
Institut für Vorsorge und Finanzplanung. The criteria<br />
considered were security, flexibility, return<br />
and transparency.<br />
Hannover, 7 September. Hannover Re is placing<br />
a subordinated bond of EUR 500 million on the<br />
European capital market. The hybrid bond carries<br />
a fixed coupon of 5.75% p.a. (return of 5.75%)<br />
in the first ten years, after which the interest<br />
basis changes to a floating rate of 4.235% above<br />
2009, is working on a global model that will provide<br />
a diverse user community with consistent<br />
information on seismic hazards, earthquake<br />
risks and the socioeconomic effects of earthquakes.<br />
Hannover Re can incorporate this data<br />
into its risk management and its assessment of<br />
earthquake risks.<br />
Standard & Poor’s confi rms very<br />
good rating for HDI-Gerling<br />
Hannover Re<br />
bond issue successful<br />
very good rating. With a grade of “A+” with “stable”<br />
outlook the company was able to reassert<br />
both its financial strength and credit status.<br />
CiV Versicherungen becomes<br />
Targo Versicherungen<br />
Hilden, 22 February. With immediate effect<br />
Citibank is to begin trading as TARGOBANK.<br />
As the exclusive insurance partners of<br />
TARGOBANK, the former CiV insurers have also<br />
taken on the bank’s new name. The Targo insurers<br />
will continue to offer their customary<br />
insurance protection products.<br />
3-month EURIBOR. Hannover Re is making the<br />
most of the favorable interest rate level to raise<br />
additional hybrid capital, further optimize its<br />
capital structure and back future growth with<br />
capital resources.<br />
Insurance. Finance.<br />
Topping-out ceremony<br />
at Hannover’s largest<br />
building site<br />
Hannover, 2 December. Almost exactly<br />
one year after the foundation<br />
stone was laid for the new building<br />
on Riethorst, HDI-Gerling is holding<br />
its topping-out ceremony. Jörg Bode,<br />
Minister for Economics of the state<br />
of Lower Saxony, expressed his satisfaction<br />
that Germany’s third-largest<br />
insurance group is headquartered<br />
in Hannover.<br />
The new head office will use renewable<br />
energy resources: by way of example,<br />
natural geothermic energy<br />
will cover basic energy needs for<br />
heating and cooling. In the fall of<br />
2011 some 1,900 staff will move into<br />
the new premises.<br />
HDI-Gerling<br />
receives fleet award<br />
from trade journal<br />
“Autoflotte”<br />
Hannover, 12 April. The insurer HDI-<br />
Gerling has been honored as the<br />
best motor fleet insurer in 2010.<br />
More than 6,000 readers of the<br />
trade journal “Autoflotte” voted on<br />
the best vehicles, products and service<br />
providers in the fleet industry<br />
and crowned HDI-Gerling as best<br />
fleet insurer.<br />
City News 25
26 <strong>Talanx</strong> Group Financial report 2010<br />
2010 was a year of light and shade for the <strong>Talanx</strong> Group. Gross premium<br />
income again showed vigorous growth, although the rate of increase<br />
varied widely across the diff erent divisions. Investment income was also<br />
sharply higher thanks to enlarged asset holdings and improved extraordinary<br />
income. The operating profi t (EBIT) failed to keep pace, however, and<br />
fell well short of the level of previous years. This was due in part to heavy<br />
loss expenditure from natural catastrophes and man-made major claims.<br />
In addition, extensive steps towards risk provision for future years also<br />
left their mark on the result.<br />
The restructuring of central functions similarly gave rise to one-off charges,<br />
among other things owing to IT costs. Over the mid- to long-term,<br />
though, this means good news: the new structure will boost the Group’s<br />
effi ciency and performance capability. This will bring appreciable cost<br />
savings going forward.<br />
Gross written premium<br />
in EUR billion<br />
19.4 19.1 19.0<br />
20.9<br />
22.9<br />
2006 2007 2008 2009 2010<br />
Operating profit (EBIT)<br />
in EUR million<br />
1,286<br />
1,462<br />
608<br />
1,497<br />
2006 1) 2007 1) 2008 1) 2009 1) 2010<br />
1) Adjusted on the basis of IAS 8<br />
1,032<br />
Investments<br />
(excluding funds held by<br />
ceding companies)<br />
in EUR billion<br />
57.8<br />
61.6<br />
62.2<br />
67.0<br />
2006 2007 2008 2009 1) 2010<br />
1) Adjusted on the basIS of IAS 8<br />
72.5
Management report. Contents<br />
28 The <strong>Talanx</strong> Group<br />
28 Business operations<br />
28 Group structure<br />
30 Strategy<br />
31 Strategic objectives of <strong>Talanx</strong><br />
32 Enterprise management<br />
32 Performance management<br />
34 Management indicators<br />
35 Research and development<br />
36 Markets, business climate and<br />
legal environment<br />
36 Overall economic development<br />
36 Capital markets<br />
38 International insurance markets<br />
39 German insurance industry<br />
40 Legal and regulatory environment<br />
41 Business development<br />
42 First steps in the restructuring completed<br />
42 Advances in international business<br />
42 Business experience of the Group<br />
43 Development of the Group segments<br />
43 Industrial Lines<br />
45 Retail Germany<br />
47 Retail International<br />
49 Non-Life Reinsurance<br />
51 Life/Health Reinsurance<br />
54 Corporate Operations<br />
56 Assets and shareholders’ equity<br />
56 Assets<br />
62 Financial position<br />
71 Rating of the Group and<br />
its major subsidiaries<br />
73 Overall assessment of the economic situation<br />
74 Non-fi nancial performance indicators<br />
74 Staff<br />
76 Sustainability<br />
77 Social responsibility<br />
77 Marketing and advertising, sales<br />
77 Corporate Governance<br />
77 Board of Management<br />
78 Supervisory Board<br />
78 General Meeting<br />
78 Compliance<br />
79 Risk monitoring and steering<br />
79 Remuneration report<br />
79 Remuneration of the Board of Management<br />
82 Remuneration of the Supervisory Board<br />
83 Remuneration received by managing directors and<br />
managers below the Group Board of Management<br />
83 Opportunity and risk report<br />
83 Risk report<br />
95 Opportunities<br />
Management report Detailed index<br />
97 Events of special signifi cance after the balance sheet date<br />
98 Forecast<br />
98 Economic environment<br />
98 Capital markets<br />
99 Future state of the industry<br />
102 Orientation of the Group over the next<br />
two fi nancial years<br />
103 Probable development of the Group<br />
27
28 <strong>Talanx</strong> Group Financial report 2010<br />
The <strong>Talanx</strong> Group<br />
Business operations<br />
The <strong>Talanx</strong> Group is the third-largest German insurance<br />
group measured by gross premium income and operates as<br />
a multi-brand provider in the insurance and fi nancial services<br />
sector. At the end of 2010 we employed around 18,000<br />
staff worldwide. The Group is headed by the Hannover-based<br />
fi nancial and management holding company <strong>Talanx</strong> AG, the<br />
sole owner of which is HDI V. a. G., a mutual insurance company<br />
that can look back on more than a hundred years of<br />
history.<br />
Group companies transact the insurance lines and classes<br />
specifi ed in the Ordinance Concerning the Reporting by<br />
Insurance Undertakings to the Federal Insurance Supervisory<br />
Offi ce (BerVersV), in some cases in direct written insurance<br />
business and in some cases in reinsurance business, with<br />
various areas of concentration: life insurance, accident insurance,<br />
liability insurance, motor insurance, aviation insurance<br />
(including space insurance), legal protection insurance, fi re<br />
insurance, burglary insurance, water damage insurance, plate<br />
glass insurance, windstorm insurance, comprehensive householders<br />
insurance, comprehensive homeowners insurance,<br />
hail insurance, livestock insurance, engineering insurance,<br />
omnium insurance, marine insurance, credit and surety business<br />
(reinsurance only), extended coverage for fi re and fi re<br />
loss of profi ts insurance, business interruption insurance,<br />
travel assistance insurance, aviation and space liability insurance,<br />
other property insurance, other indemnity insurance.<br />
<strong>Talanx</strong> is represented by its own companies or branches in<br />
40 countries worldwide. Including its cooperation arrangements,<br />
the Group is active in altogether 150 countries. In<br />
retail business Germany is one area of concentration, while<br />
internationally the principal focus markets are the growth<br />
regions of Central and Eastern Europe as well as Turkey and<br />
Latin America. Industrial lines and especially reinsurance are<br />
also transacted in a number of other markets, including for<br />
example North America, South Africa, Australia and some<br />
Asian countries.<br />
Group structure<br />
The confi guration of the segments changed substantially<br />
in the year under review in comparison with the previous<br />
year. The organization, which had become highly complex<br />
as a consequence of several intermediate holding companies<br />
and operating/sales companies, had to be put on a competitive<br />
footing for the future in order to ensure that growth<br />
and profi tability targets could be successfully accomplished.<br />
Functions which had previously been performed in multiple<br />
parts of the Group are now being concentrated with the clear<br />
goal of working more effi ciently.<br />
Primary insurance – previously split into the Property/Casualty<br />
Primary Insurance and Life Primary Insurance segments<br />
– was therefore split into three divisions oriented towards<br />
customer segments that span the various lines of business:<br />
Industrial Lines, Retail Germany and Retail International. One<br />
member of the <strong>Talanx</strong> Board of Management takes responsibility<br />
for each of these divisions.<br />
Industrial Lines will be the platform for a Global Player that<br />
is present and able to act worldwide on the basis of its own<br />
resources: as independent as possible from third parties and<br />
equipped with the capability to lead international consortia.<br />
Such a player must be in a position to leverage economies<br />
of scale in portfolios and it must have suffi cient fi nancial<br />
resources to make substantial insurance capacities available<br />
on a sustained basis.<br />
The German companies transacting business with private<br />
and commercial customers are interlinked in the Retail Germany<br />
segment. The traditional line-of-business distinctions<br />
between life insurance and property/casualty insurance are<br />
being eliminated in order to become even more attractive<br />
to <strong>policy</strong>holders through comprehensive customer management:<br />
processes will be optimized, and the brand and product<br />
strategy will be tailored more closely to customer needs.
HDI-Gerling<br />
Industrie<br />
Versicherung AG<br />
HDI-Gerling<br />
Australia Insurance<br />
Company Pty. Ltd.<br />
HDI<br />
Versicherung AG<br />
(Austria)<br />
HDI-Gerling<br />
Assurances<br />
(Belgium) S. A.<br />
HDI-Gerling<br />
de México<br />
Seguros S. A.<br />
HDI-Gerling<br />
Verzekeringen N.V.<br />
(Netherlands)<br />
HDI-Gerling<br />
Insurance of<br />
South Africa Ltd.<br />
HDI<br />
Seguros S. A.<br />
(Spain)<br />
HDI-Gerling<br />
America Insurance<br />
Company<br />
HDI-Gerling<br />
Lebens -<br />
ver sicherung AG<br />
HDI-Gerling<br />
Pensions kasse AG<br />
HDI-Gerling<br />
Pensions -<br />
management AG<br />
HDI-Gerling<br />
Firmen und Privat<br />
Versicherung AG<br />
HDI-Gerling<br />
Rechtsschutz<br />
Versicherung AG<br />
HDI Direkt<br />
Versicherung AG<br />
neue leben<br />
Lebensversicherung<br />
AG<br />
neue leben<br />
Unfallversicherung<br />
AG<br />
PB Lebensversicherung<br />
AG<br />
PBV Lebensversicherung<br />
AG<br />
PB<br />
Versicherung AG<br />
PB Pensions -<br />
fonds AG<br />
TARGO Lebens -<br />
versicherung AG<br />
TARGO<br />
Ver sicherung AG<br />
HDI<br />
Seguros S. A.<br />
(Brazil)<br />
HDI<br />
Zahstrahovane AD<br />
(Bulgaria)<br />
HDI Seguros S. A.<br />
(Chile)<br />
Magyar Posta<br />
Életbiztosító Zrt.<br />
(Hungary)<br />
Magyar Posta<br />
Biztosító Zrt.<br />
(Hungary)<br />
HDI<br />
Assicurazioni S. p. A.<br />
(Italy)<br />
HDI Seguros S. A.<br />
(Mexico)<br />
HDI-Gerling<br />
Zycie TU S. A.<br />
(Poland)<br />
HDI Asekuracja<br />
TU S. A.<br />
(Poland)<br />
OOO Strakhovaya<br />
Kompaniya “CiV Life”<br />
(Russia)<br />
HDI Strakhovaya<br />
(Russia)<br />
CiV Hayat<br />
Sigorta A. Ş.<br />
(Turkey)<br />
HDI Sigorta A. Ş.<br />
(Turkey)<br />
HDI<br />
STRAKHUVANNYA<br />
(Ukraine)<br />
<strong>Talanx</strong> AG<br />
Hannover<br />
Reinsurance<br />
Africa Limited<br />
Hannover Re<br />
(Bermuda) Ltd.<br />
Hannover<br />
Reinsurance<br />
(Ireland) Ltd.<br />
Hannover Re<br />
Takaful B. S. C. (c)<br />
(Bahrain)<br />
International<br />
Insurance Com pany<br />
of Hannover Ltd. (UK)<br />
Hannover Rückversicherung<br />
AG<br />
E+S Rückversicherung<br />
AG<br />
Hannover Life<br />
Reassurance<br />
Africa Limited<br />
Hannover Life<br />
Reassurance<br />
Company<br />
of America<br />
Hannover Life<br />
Reassurance<br />
Bermuda Ltd.<br />
Hannover<br />
Life Re of<br />
Australasia Ltd.<br />
Hannover Life<br />
Reassurance<br />
(Ireland) Ltd.<br />
Hannover Life<br />
Reassurance<br />
(UK) Ltd.<br />
Management report The <strong>Talanx</strong> Group<br />
Group segments<br />
Industrial Lines<br />
Retail Germany<br />
Retail International<br />
Non-Life Reinsurance<br />
Life/Health Reinsurance<br />
Corporate Operations<br />
Major participations only,<br />
simplified representation<br />
Valid: 01.03.2011<br />
AmpegaGerling<br />
Asset Management<br />
GmbH<br />
AmpegaGerling<br />
Investment GmbH<br />
AmpegaGerling<br />
Immobilien<br />
Management GmbH<br />
HDI Reinsurance<br />
(Ireland) Ltd.<br />
Protection<br />
Reinsurance<br />
Intermediaries AG<br />
<strong>Talanx</strong> Service AG<br />
<strong>Talanx</strong> Systeme AG<br />
29
30 <strong>Talanx</strong> Group Financial report 2010<br />
The Retail International segment is charged with growing in<br />
the strategic target markets of Central and Eastern Europe<br />
as well as Latin America both through its own eff orts and by<br />
way of acquisitions; it is also tasked with optimizing activities<br />
in existing markets and cultivating new markets. Despite the<br />
diff erences in the various target markets, experience, practices<br />
and products can be transferred to other markets. This<br />
division will thus evolve into a source of know-how that will<br />
fi nd it easier to expand its business or enter lucrative new<br />
markets.<br />
The Reinsurance segment, led by Hannover Re, remains<br />
unchanged.<br />
The Corporate Operations segment has been enlarged<br />
through the addition of two companies: the service company<br />
<strong>Talanx</strong> Service AG and the IT service provider <strong>Talanx</strong><br />
Systeme AG, which is to commence operational activities in<br />
the course of 2011. As before, the segment also includes the<br />
Financial Services sector, which along with the Group’s own<br />
internal reinsurance broker Protection Reinsurance Intermediaries<br />
consists primarily of the asset management companies.<br />
<strong>Talanx</strong> AG, which is also assigned to this segment, is<br />
extending its function from that of a pure fi nancial holding<br />
company to a fi nancial and management holding company<br />
as part of the restructuring. Going forward, then, the Group<br />
will be steered more centrally from <strong>Talanx</strong> AG. The latter will<br />
continue to perform its previous strategic tasks, but will also<br />
exert a greater infl uence on the positioning and performance<br />
of the divisions in order to ensure adherence to the overall<br />
strategy.<br />
Strategy<br />
The <strong>Talanx</strong> Group is internationally active in primary insurance<br />
(with the exception of the health and credit lines) and<br />
reinsurance business. In its domestic market our Group is a<br />
major player in shaping the insurance industry. At <strong>Talanx</strong>,<br />
we optimize the interplay of insurance and reinsurance<br />
as an integral component of our business model with the<br />
aim of consistently enhancing the opportunity/risk profi le,<br />
increasing capital effi ciency and leveraging growth and profi t<br />
opportunities more fl exibly. What is more, this composition<br />
of the Group portfolio ensures that even in diffi cult market<br />
phases our Group has at its disposal suffi cient independent<br />
risk capacities to support its clients reliably and over the long<br />
term, tap into interesting markets and thereby safeguard<br />
and enhance the independence and underlying value of the<br />
Group for investors and employees on a lasting basis.<br />
The Group is headed by <strong>Talanx</strong> AG as a fi nancial and management<br />
holding company. Its primary task is to lead and steer<br />
the Group. In its management of the Group, <strong>Talanx</strong> AG relies<br />
on the organizational principle of centralized Group steering<br />
functions and concentrated Group service functions, on the<br />
one hand, combined with local profi t responsibility on the<br />
part of the divisions, on the other. The success enjoyed by the<br />
<strong>Talanx</strong> Group is attributable in special measure to this organizational<br />
structure, which accords the individual divisions a<br />
very high level of entrepreneurial freedom and profi t responsibility.<br />
In this way the various units are best able to act on<br />
their growth and profi t opportunities.<br />
While the <strong>Talanx</strong> brand – as the name given to the fi nancial<br />
and management holding company, the service companies<br />
and the management companies of individual divisions – is<br />
oriented exclusively towards the capital market, on the operating<br />
side our considerable international product expertise,<br />
our forward-looking underwriting <strong>policy</strong> and our distribution<br />
resources are refl ected in a multi-brand strategy. This enables<br />
us to optimally align ourselves with the needs of diff erent<br />
customer groups, regions and cooperation partners. Furthermore,<br />
it promotes the effi cient integration of new companies<br />
and/or business sectors into the Group. Not only that, this<br />
structure facilitates a highly developed capacity for cooperation<br />
which can be harmonized with a diverse range of partners<br />
and business models.
A crucial factor in the success of our multi-brand strategy is<br />
the optimal support that it is given through lean, effi cient<br />
and standardized business processes combined with a stateof-the-art<br />
and – as far as possible – uniform IT structure.<br />
Strategic objectives of <strong>Talanx</strong><br />
The paramount strategic objectives of the <strong>Talanx</strong> Group are<br />
safeguarding a lasting majority interest of HDI V. a. G. and<br />
hence extensive independence from unsustainable capital<br />
market interests with a short-term orientation as well as<br />
focusing on stakeholder value. This is driven by the fi rm<br />
conviction that only on this basis can the Group’s <strong>policy</strong> be<br />
geared to reliable continuity, above-average profi table growth<br />
and hence long-term value enhancement. This is done with<br />
the intention of living up to the interests of both shareholders<br />
and – so to speak as a prerequisite – customers and staff<br />
in a balanced manner and generating the greatest possible<br />
benefi t for these groups. We accomplish these aspirations<br />
through a strong <strong>Talanx</strong> Group that is continuously able<br />
to provide the best possible risk protection by consistently<br />
consolidating and optimizing its equity base and capital<br />
allocation. As a mandatory guiding principle, these strategic<br />
objectives form the basis from which all other Group goals<br />
are derived.<br />
Our strategy for human resources management is described<br />
at length in the section “Non-fi nancial performance indicators”,<br />
pages 74 et seqq. while the management of opportunities<br />
and risks is described in the “Opportunity and risk<br />
report” pages 83 et seqq. These two aspects are therefore<br />
not discussed further here.<br />
Profi t target<br />
The <strong>Talanx</strong> Group strives for continual, above-average value<br />
enhancement of the invested capital in keeping with the<br />
risk exposure. We seek to rank among the fi ve most profi table<br />
of Europe’s 20 largest insurance groups – measured by<br />
our return on equity under IFRS. Our Group’s minimum target<br />
in relation to the Group net profi t aft er tax and before<br />
minorities is an IFRS return on equity 750 basis points in<br />
excess of the average risk-free interest rate. This is defi ned<br />
as the average market rate over the past fi ve years for<br />
10-year German government bonds.<br />
Management report The <strong>Talanx</strong> Group. Strategy<br />
The utilization of the Group net income is geared both to<br />
any necessary strengthening of the Group’s capital base and<br />
to the distribution expectations of investors. Reinforcement<br />
of our capital base makes us less dependent upon movements<br />
on primary and reinsurance markets and enables<br />
us to generate a sustainable attractive dividend yield commensurate<br />
with market standards. The distribution <strong>policy</strong> of<br />
the divisions is centrally managed by <strong>Talanx</strong> AG in compliance<br />
with the pertinent legal framework conditions, always<br />
guided by the twin goals of optimizing capital effi ciency<br />
at the Group companies and satisfying the liquidity and<br />
capital requirements of the Group and <strong>Talanx</strong> AG. Building<br />
upon this, we are able to pay our shareholders an attractive<br />
competitive dividend on a sustained basis.<br />
Capital management<br />
The capital management of the <strong>Talanx</strong> Group is geared to<br />
an optimized risk-adequate capital structure in order to<br />
reinforce the Group’s fi nancial strength.<br />
This is achieved in two ways: fi rstly, we optimize the capital<br />
structure by using appropriate equity substitutes and<br />
fi nancing instruments; secondly, we align our equity<br />
resources such that they at least meet the requirements of<br />
Standard & Poor’s capital model for an “AA” rating. Equity<br />
resources in excess of this requirement are established to<br />
boost our earnings potential above and beyond the return<br />
on reinvested funds, e.g. through improved provision of risk<br />
capacity and protection or through greater independence<br />
from reinsurance and retrocession markets.<br />
Capital resources are, as a general principle, allocated to<br />
those areas that promise the highest risk-adjusted posttax<br />
profi t over the medium term. In this context we make<br />
allowance for the desired portfolio diversifi cation and the<br />
required risk capital as well as the general regulatory framework.<br />
Allocation is based on the expected intrinsic value<br />
creation (IVC), arrived at from coordinated business plans.<br />
31
32 <strong>Talanx</strong> Group Financial report 2010<br />
In recent years <strong>Talanx</strong> AG has opened up to the capital<br />
market in order to be able to boost its fi nancial strength<br />
even before going public. The next logical step as part of<br />
this progressive capital market orientation is an initial<br />
public off ering (IPO) with the aim of placing a maximum<br />
49.9 percent of the voting equity of <strong>Talanx</strong> AG on the stock<br />
market. This stock market fl otation will be implemented by<br />
way of a capital increase in order to maximize the strengthening<br />
of our asset base and the resulting strategic options.<br />
Growth target<br />
In order to preserve and further improve our competitiveness,<br />
we strive for profi t-oriented growth within the <strong>Talanx</strong><br />
Group while preserving the optimal segmental and regional<br />
diversifi cation of the portfolio and keeping a close eye on the<br />
risk-adjusted return. This is achieved organically, by way of<br />
strategic and complementary acquisitions as well as through<br />
cooperation arrangements.<br />
The target structure, measured by the value contribution of<br />
the individual divisions to the total value of the Group aft er<br />
minorities, breaks down as follows:<br />
Life/Health<br />
Reinsurance<br />
15%<br />
Non-Life<br />
Reinsurance<br />
15%<br />
Retail International<br />
20%<br />
Industrial Lines<br />
30%<br />
Retail Germany<br />
20%<br />
In the medium term it is envisaged that the proportion of<br />
gross premium from primary insurance generated outside<br />
Germany (Industrial Lines and Retail) should amount to half<br />
the total gross premium volume in primary insurance.<br />
In view of the varying risk profi les of our divisions we set<br />
ourselves exclusively profi t targets in volatile segments. In<br />
less risk-exposed segments we defi ne both profi t and volume<br />
targets.<br />
More extensive elaboration of this strategic framework – in<br />
terms of products, customer groups, sales channels and countries<br />
– is provided by our individual divisions.<br />
Enterprise management<br />
Within the <strong>Talanx</strong> Group we have set ourselves the following<br />
core tasks, which must be fulfi lled on a sustained basis:<br />
providing reliable support for our customers, maintaining<br />
suffi cient independent capacity in all market phases, cultivating<br />
new markets and safeguarding as well as increasing<br />
the intrinsic value of the Group for stakeholders for the<br />
long term. At the same time, the extent of the requirements<br />
placed on insurance groups by the regulatory environment<br />
and by capital markets and rating agencies is growing. The<br />
point of departure determined by these internal and external<br />
infl uencing factors causes us to defi ne the following goals:<br />
■<br />
■<br />
■<br />
■<br />
■<br />
Increase profitability and create value<br />
Make optimal use of capital<br />
Optimize the cost of capital<br />
Invest in areas where we generate the highest risk-adjusted<br />
return over the long term<br />
Seize strategic opportunities and at the same time remain<br />
aware of and manage the immanent risks<br />
We pursue these goals with the aid of our holistic, integrated<br />
management system, in which we devote special attention<br />
to the four fundamental management processes that govern<br />
the interplay between the holding company <strong>Talanx</strong> AG and<br />
the Group’s various divisions: capital management, performance<br />
management, risk management and mergers & acquisitions<br />
(M&A).<br />
Performance management<br />
Performance management is the centerpiece of our array<br />
of steering tools. Under our systematic approach a clear<br />
strategy geared to ensuring the Group’s long-term survival<br />
and the consistent implementation of this strategy are fundamental<br />
to effi cient enterprise and group management.<br />
Since instances of mismanagement are very oft en due to the<br />
inadequate implementation of strategy, we devote particularly<br />
close attention to the process steps that enable targeted<br />
alignment of our entrepreneurial actions with the strategic<br />
objectives.
The major stages of strategy implementation consist of the<br />
drawing up of strategic program planning, i.e. the breaking<br />
down of the strategic objectives into subgoals, and the subsequent<br />
breaking down of these subgoals into operational goals<br />
that are backed by concrete measures.<br />
Performance management and the steering of segments/<br />
divisions are guided by the following basic principles:<br />
■<br />
The Board of Management of <strong>Talanx</strong> AG (holding com-<br />
pany) sets out strategic indications as a framework for the<br />
planning and orientation of business activities. The focus<br />
is on the Group’s core management ratios and on Groupwide<br />
strategic initiatives. The target indications set by the<br />
holding company thus define the Group’s aspirations to<br />
economic value creation, profitability, level of security and<br />
growth initiatives.<br />
Core management ratios<br />
From Group parameters and strategic program<br />
planning of the segments/divisions:<br />
IVC, xRoCC<br />
Dividend<br />
Risk budget,<br />
capital adequacy ratio (CAR)<br />
Our fi ve core management ratios:<br />
Operational management ratios<br />
Operational requirements from the segments/divisions:<br />
Financial perspective<br />
Finance<br />
Internal perspective<br />
Processes<br />
■ IVC – Intrinsic Value Creation<br />
Value creation of the segment/division in accordance with value-based management (as an absolute amount)<br />
■ xRoCC – Excess Return on Company’s Capital<br />
Value creation of the segment/division in accordance with value-based management (relative to the company’s capital)<br />
■ Dividend/profit transfer of the segment/division<br />
■ Risk budget<br />
Definition of available risk capital per segment/division<br />
■ Capital adequacy ratio (CAR)<br />
Minimum solvency level of the segment/division (ratio of company’s capital to risk-based capital)<br />
Group holding company and Group segments/divisions use a consistent performance metric to manage business.<br />
■<br />
■<br />
Management report The <strong>Talanx</strong> Group. Enterprise management<br />
The holding company and segments/divisions use a con-<br />
sistent performance metric to manage their business.<br />
The performance metric not only encompasses purely<br />
financial core management ratios but also other relevant<br />
operational management ratios from four different perspectives:<br />
the financial perspective, the market/customer<br />
perspective, the process perspective and the staff perspective.<br />
Performance is discussed and assessed in regular meetings<br />
between the Board members with responsibility for the<br />
holding company and the segments/divisions on the basis<br />
of this performance metric.<br />
We link our strategic planning with the operational planning<br />
using the performance metric by setting out our strategy<br />
measurably in structured overviews and monitoring its<br />
execution.<br />
Market and customer perspective<br />
Market/Customers<br />
Learning and development perspective<br />
Staff<br />
33
34 <strong>Talanx</strong> Group Financial report 2010<br />
Management indicators<br />
As part of our performance management we measure economic<br />
value creation from strategic planning to operational<br />
management using our central management indicator,<br />
namely Intrinsic Value Creation (IVC).<br />
The IVC enables us to record and consistently allocate the<br />
value contributions of the Group on diff erent hierarchical<br />
levels – Group, segment/division and company. The IVC and<br />
its methodological determination form the basis on which<br />
the value contributions of the segments/divisions and of the<br />
individual operational units can be measured in a comparable<br />
manner – making allowance for their specifi c characteristics<br />
– in order to reliably identify value-creating areas. The<br />
core management ratios, the operational management ratios<br />
and their respective degrees of goal accomplishment create<br />
the transparency needed to optimize the allocation of capital<br />
and resources, pinpoint risks and opportunities and initiate<br />
further measures.<br />
Our value-based management tools were continuously<br />
refi ned and anchored in the Group-wide management process<br />
in 2010. A key point of emphasis – one that should also<br />
be viewed in conjunction with the relevant initiatives to<br />
regulate remuneration systems in the insurance sector – was<br />
conceptualizing the operationalization of value-based management<br />
on the levels of areas of Board responsibility, companies<br />
and lines of business. The methodological determination<br />
of the IVC – and hence of the economic value creation<br />
– is carried out unchanged according to the basic scheme for<br />
the life and non-life companies. Under this approach, the<br />
intrinsic value creation constitutes the economic net income<br />
for the period less the cost of capital.<br />
The IVC is calculated diff erently for “life” and “non-life” on<br />
the basis of distinct specifi c ratios:<br />
NOPAT Cost of<br />
risk-based<br />
capital<br />
Cost of excess<br />
capital<br />
IVC<br />
Non-Life<br />
In non-life business (i.e. property/casualty insurance and<br />
non-life reinsurance) the IVC measures the diff erence<br />
between the NOPAT (net operating profi t aft er adjustments<br />
and tax) and the cost of capital for risk-based capital and<br />
excess capital.<br />
The NOPAT is an economically informative performance<br />
and management ratio for the reporting period in question.<br />
It is comprised of the Group net income recognized under<br />
IFRS aft er tax and fair value adjustments that arise out of<br />
the change in diff erences between present values and carrying<br />
amounts in the balance sheet (loss reserve discount,<br />
excess loss reserves, fair value changes not recognized in<br />
income).<br />
The cost of capital consists of the costs for the allocated<br />
risk-based capital and the costs of excess capital. While the<br />
risk-based capital is divided between the profi t centers in<br />
a manner commensurate with the risk using the <strong>Talanx</strong><br />
risk model on the basis of a 99.97 percent Value at Risk,<br />
the excess capital is arrived at as the diff erence between<br />
the risk-based capital and the company’s capital. The costs<br />
for the risk-based capital are determined from the following<br />
components: a risk-free basic interest rate*, frictional<br />
costs** and a risk margin to refl ect the market in question.<br />
For the excess capital, on the other hand, only the risk-free<br />
interest rate and the frictional costs are used, since the capital<br />
involved here is not at risk. On the basis of our currently<br />
* In the context of the risk-based capital: calculated as the three-year average<br />
of ten-year swap rates<br />
** Opportunity costs incurred by shareholders as a consequence of the fact that<br />
they invest their capital not directly in the capital market but rather by a “roundabout<br />
route” through a company and the capital is tied to the company rather<br />
than being fr eely fungible
applicable determination of the cost of capital, the investor<br />
incurs opportunity costs for the risk-based capital that are<br />
600 basis points above the risk-free interest rate. Value is created<br />
above this rate of return. The targeted return-on-equity<br />
for the Group of at least 750 basis points above “risk-free”<br />
defi ned in our umbrella strategy thus already includes a not<br />
inconsiderable aspiration to intrinsic value creation.<br />
MCEV<br />
Earnings<br />
Roll Forward<br />
IVC<br />
Life<br />
Value creation in life business (i.e. life insurance and life/<br />
health reinsurance) is measured on the basis of the change<br />
in the Market Consistent Embedded Value (MCEV), which is<br />
expressed in the MCEV earnings. The MCEV earnings are thus<br />
equivalent to the NOPAT. The MCEV is defi ned as the value of<br />
the undertaking, which is measured as the discounted present<br />
value of future earnings until fi nal run-off of the in-force<br />
portfolio plus the fair value of equity, making allowance for<br />
capital commitment costs. We chose the MCEV as the basis<br />
for value-based management of the life insurance business<br />
because it constitutes the value of the undertaking inherent<br />
in the already transacted insurance portfolio from the standpoint<br />
of the shareholder. The IVC Life is determined as the<br />
diff erence between the MCEV earnings and the roll forward;<br />
the latter corresponds to the expected cost of capital aft er<br />
allowance for the risk exposure in relation to capital market<br />
risks.<br />
In order to measure the comparable return delivered by business<br />
units or divisions of varying size, the IVC is considered<br />
in relation to the corresponding available capital. In this way<br />
we arrive at the ratio known as the xRoCC (Excess Return on<br />
Company’s Capital), which indicates the return for the shareholder<br />
in excess of the cost of capital.<br />
Management report Enterprise management. Research and development<br />
Research and development<br />
As a holding company, <strong>Talanx</strong> AG does not conduct any product-related<br />
research and development of its own. However,<br />
we continuously work to refi ne methods and processes that<br />
are necessary in order to fulfi ll the business purpose, especially<br />
in the area of risk management. In the various divisions<br />
we analyze trends such as demographics or climate change<br />
and develop products tailored to our markets and customers.<br />
35
36 <strong>Talanx</strong> Group Financial report 2010<br />
Markets, business climate and<br />
legal environment<br />
Overall economic development<br />
The hallmarks of 2010 were the global economic recovery<br />
and the sovereign debt crisis. The picture around the world<br />
was a very mixed one: emerging markets as well as developed<br />
countries – fi rst and foremost Germany – linked with them<br />
through strong export relationships enjoyed a vigorous<br />
upturn. Growth in some countries on the Eurozone periphery,<br />
however, was curtailed by the spreading sovereign debt<br />
contagion and corresponding austerity eff orts.<br />
The eruption of the sovereign debt crisis was triggered by the<br />
downgrading of Greece’s credit rating and the rapid increase<br />
in risk premiums for Spain, Portugal and Ireland too – as<br />
well as Italy as the year progressed. The European Union and<br />
the International Monetary Fund (IMF) approved a bailout<br />
package for Greece and additionally agreed upon a safety net<br />
– comprised of credit commitments – for Eurozone countries<br />
at risk. Ireland was the fi rst country to avail itself of this assistance,<br />
taking out loans of EUR 85 billion in November.<br />
Unemployment in the United States remained stubbornly<br />
at a historic high of 9.4%, just 0.5% lower than at the end<br />
of 2009. Convincing corporate profi ts across all reporting<br />
seasons provided a ray of light, and hence the US generated<br />
third-quarter growth of 3.2% year-on-year. The fi gure for<br />
the Eurozone was 1.9%. Germany took over as the driver of<br />
growth within the Eurozone, recording an increase of 3.6%<br />
for the full year.<br />
Change in real gross domestic product<br />
relative to the previous year 1)<br />
2010 1) 2009<br />
% change relative to the previous year<br />
USA +2.9 –2.6<br />
Eurozone +1.7 –4.0<br />
Germany +3.6 –4.7<br />
United Kingdom +1.7 –4.9<br />
Japan +4.2 –6.3<br />
1) Source: Commerzbank, Economic and Market Monitor, valid: 17 January 2011;<br />
2010: provisional fi gures<br />
Despite monetary <strong>policy</strong> intervention by the US Federal<br />
Reserve and the European Central Bank on a massively<br />
expansionary scale, infl ation in both regions remained on<br />
a modest level. The infl ation rate in the United States in<br />
November 2010 stood at 1.1% relative to the previous year,<br />
while in the Eurozone the fi gure was 1.9% and in the United<br />
Kingdom it was 3.3%. In the latter case, however, an increase<br />
in value-added tax and exchange rate eff ects both played a<br />
signifi cant role. Core infl ation reached historic lows in 2010,<br />
standing at 0.8% in the US in November, 1.1% in the Eurozone<br />
and 2.5% in the UK.<br />
Movement of the euro relative to other currencies<br />
31.12.2009 = 100<br />
110<br />
105<br />
100<br />
95<br />
90<br />
85<br />
JAN FEB MAR APR MAY JUN JUL AUG SEP OCT NOV DEC<br />
The euro depreciated against the US dollar from 1.43 USD/<br />
EUR to 1.19 USD/EUR. The bailout package for Greece and<br />
the subsequent establishment of a rescue fund for aff ected<br />
Eurozone countries gave the single currency some breathing<br />
space, as a result of which it had recovered to 1.34 USD/<br />
EUR by year-end. The movement of the rate against the<br />
pound sterling was almost a mirror image: the rate slipped<br />
from 0.89 GBP/EUR as the year progressed to 0.81 GBP/EUR<br />
and then recovered by year-end to 0.86 GBP/EUR.<br />
Capital markets<br />
Pound<br />
sterling<br />
US dollar<br />
Central banks in the United States and the Eurozone pressed<br />
ahead with their extremely relaxed monetary <strong>policy</strong> in<br />
2010. The US Federal Reserve left its key interest rate<br />
unchanged at virtually zero. In the third quarter the decision<br />
was taken to invest funds from maturing instruments<br />
in US treasury bonds. This was followed in November by<br />
the announcement of further monetary <strong>policy</strong> expansion<br />
through the additional purchase of government bonds.<br />
Altogether, the Federal Reserve is looking to buy up the<br />
equivalent of roughly USD 900 billion by the summer of<br />
2011. These unprecedented steps were prompted by the fear<br />
that the US economy could slip back again into recession.
Similarly, the European Central Bank also kept its foot on<br />
the gas in 2010. The prime rate was left unchanged at 1%<br />
and tender transactions were awarded in full. Not only that,<br />
the ECB also began to buy up government bonds. As justifi -<br />
cation for this move, hitherto unprecedented in the history<br />
of the ECB, the temporary impairment in the proper functioning<br />
of the markets was cited: the purpose of these measures<br />
is not to extend the money supply, but rather to hold<br />
it on a constant level through off setting transactions.<br />
Aft er an untroubled fi rst quarter in which yields moved<br />
sideways, the debt crisis aff ecting countries on the Eurozone<br />
periphery took center stage in the following months. This<br />
prompted a fl ight to low-risk asset classes among market<br />
players. The market for government bonds issued by AAArated<br />
core countries, especially Germany, profi ted from this<br />
development. The risk aversion displayed by market participants<br />
caused yields on 10-year government bonds in the<br />
Eurozone to fall to levels barely above 2% on multiple occasions<br />
between April and August. Parallel to this, risk premiums<br />
for government bonds issued by peripheral Eurozone<br />
countries increased sharply. While the extensive bailout<br />
packages repeatedly served to calm markets for the short<br />
term in the period that followed, the skepticism prevailing<br />
among market players remains very high overall to this day.<br />
Yields on 10-year government bonds in 2010<br />
%<br />
4.5<br />
4.0<br />
3.5<br />
3.0<br />
2.5<br />
JAN FEB MAR APR MAY JUN JUL AUG SEP OC NOV DEC<br />
United<br />
Kingdom<br />
In conjunction with implementation of a Bank Reorganization<br />
Act in Germany at the beginning of November, the<br />
market segment for fi nancial bonds also saw a signifi cant<br />
increase in risk premiums. Since developments on the economic<br />
side were looking brighter, particularly in Germany,<br />
yields rose sharply in this period on the interest rate front.<br />
10-year German federal government bonds listed just below<br />
3% at year-end. All relevant euro bond markets closed the<br />
year with a positive performance.<br />
USA<br />
Germany<br />
Movements on equity markets in 2010<br />
31.12.2009 = 100<br />
130<br />
115<br />
100<br />
85<br />
Management report Markets, business climate and legal environment<br />
JAN FEB MAR APR MAY JUN JUL AUG SEP OCT NOV DEC<br />
DAX<br />
S&P 500<br />
Dow Jones<br />
EURO STOXX 50<br />
Movements on equity markets in the developed countries<br />
were driven by the sovereign debt crisis in 2010. A brief<br />
period of consolidation at the beginning of the year was<br />
followed by an upward movement from February onwards,<br />
although this quickly came to an end as the second quarter<br />
got underway owing to the emerging sovereign debt issues.<br />
Prices then moved sideways until the end of the third quarter.<br />
The closing quarter of 2010 ushered in a year-end rally in<br />
which almost all indices reached new highs.<br />
The varying economic developments were refl ected in the<br />
equity indices. The strong performance of the German economy<br />
carried over to the DAX, which closed the year with a<br />
performance of +16%. The EURO STOXX 50, on the other hand,<br />
performed weakly in the course of the year on the back of the<br />
sovereign debt crisis aff ecting Eurozone peripheral countries<br />
and recorded a negative performance of –2%. The S&P500<br />
Total Return beat the previous year by 14%.<br />
While economic worries proved to be a drag on stock markets,<br />
the abundant supply of liquidity provided by central banks<br />
as well as – most signifi cantly – surprisingly strong corporate<br />
profi ts and increased M&A activities were positive drivers.<br />
The successful outcome of the stress tests performed on<br />
banks at the start of the second half-year was also a source<br />
of relief.<br />
37
38 <strong>Talanx</strong> Group Financial report 2010<br />
International insurance markets<br />
The dominant infl uencing factor on international insurance<br />
markets in 2010 was the global economic recovery, which<br />
off ered insurance enterprises a good opportunity to replenish<br />
their capital resources aft er the slumps prompted by the<br />
worldwide fi nancial and economic crisis. The broadly positive<br />
development of business was, however, adversely aff ected by<br />
disruptive eff ects such as the sovereign debt crisis and protracted<br />
political turmoil in several regions of the world along<br />
with the associated instabilities. Steadily growing importance<br />
also attaches to the requirements – which have become<br />
increasingly exacting in recent years – placed by regulators<br />
on insurers and fi nancial services providers; these are giving<br />
rise to a broad spectrum of new management and supervision<br />
processes that need to be implemented. The sustained<br />
low interest rate environment continues to present an enormous<br />
challenge to the ability of companies to fulfi ll insurance<br />
contracts, some of which remain in force over decades.<br />
Measured by international standards, even though the shock<br />
waves of the fi nancial crisis have still not entirely dissipated,<br />
the insurance sector nevertheless once again proved to be a<br />
major stabilizing factor in 2010. The security and provision<br />
concepts that it off ered again constituted an indispensable<br />
element of the macroeconomic cycle. As one of the most<br />
prominent investors around the globe, the international<br />
insurance industry plays a key role in growing prosperity<br />
for private households and the business community. Life<br />
insurance markets continued to recover from the setbacks<br />
of the fi nancial crisis in 2010, which had taken a particularly<br />
heavy toll on certain products such as unit-linked life and<br />
annuity insurance. The resurgence of new business helped<br />
boost premium income worldwide. On the other hand, the<br />
diminished returns in the investment sector served to curtail<br />
the profi tability of life insurers. On the life reinsurance side,<br />
products for longevity risks and sizeable block assumption<br />
transactions served as growth drivers in the industrialized<br />
nations, while sales of products covering the risks of death<br />
and disability were fl at. Demand for individual retirement<br />
provision and coverage for surviving dependants neverthe-<br />
less remains strong, since the earliest possible and continuous<br />
accumulation of funded individual retirement provision<br />
constitutes an essential component of long-term wealth<br />
management.<br />
The picture on the non-life insurance and reinsurance markets<br />
was a mixed one in 2010. Although the primary sector<br />
profi ted from rising demand as the economic gloom lift ed,<br />
premium growth – especially in saturated markets – was<br />
limited. The continued soft market conditions, particularly in<br />
the industrial and motor insurance lines, led to a worsening<br />
of the underwriting result in 2010 that refl ected an increase<br />
in the combined ratios based on claims for the fi nancial year.<br />
This was equally true of the US and major European markets.<br />
Reinsurance markets, on the other hand, were in a comparatively<br />
better state. Along with the positive run-off results<br />
from well-priced prior years and broadly intact underwriting<br />
discipline combined with an adequate rate level, this produced<br />
satisfactory results overall despite increased spending<br />
on catastrophe losses.<br />
On the climate front 2010 will go down in the books as the<br />
warmest year since measurements began around 160 years<br />
ago. With 950 natural catastrophes – roughly 90% of them<br />
weather-related – it also recorded the second-highest number<br />
of major loss events since 1980. The probability of a correlation<br />
between the clearly measurably trend towards global<br />
warming and the increased proliferation of natural disasters<br />
to record levels is now assessed as high by georesearchers and<br />
risk researchers. It should also be noted that the number and<br />
severity of earthquakes has also grown steadily in recent years.
Compared to the previous year, the volume of total economic<br />
losses climbed in 2010 by around USD 60 billion to<br />
roughly USD 130 billion worldwide, of which approximately<br />
USD 37 (2009: 22) billion were attributable to insured losses.<br />
What is more, 2010 saw the third-most severe hurricane season<br />
– measured by number and intensity – in the past 100<br />
years, although it produced relatively low insured losses in<br />
the order of USD 150 million owing to the fact that the hurricanes<br />
raged almost exclusively on the open seas. The rising<br />
population density and concentration of values around the<br />
world, sharply growing traffi c and shipping volumes and the<br />
close interlinking of goods and services internationally are<br />
refl ected in a steadily increasing vulnerability of people and<br />
infrastructure to natural catastrophes and man-made disasters.<br />
Despite the alarming numbers, therefore, it may be concluded<br />
that 2010 passed off reasonably innocuously.<br />
German insurance industry<br />
Development of premium income in the individual<br />
insurance lines in Germany<br />
2010 1) in % compared to previous year<br />
2009<br />
Property/casualty insurance<br />
Life insurance/<br />
+0.7 +0.2<br />
occupational retirement provision +6.8 +7.1<br />
Private health insurance +6.0 +3.8<br />
Total +4.7 +4.2<br />
1) Provisional fi gures<br />
With growth of a good 4% in 2010 – another slight increase<br />
on the previous year – the German insurance industry<br />
impressively maintained its positive premium trend of<br />
recent years. It should, however, be borne in mind that a not<br />
inconsiderable part of this growth derives from so-called<br />
single-premium business in life insurance. This is a product<br />
group that consists, fi rstly, of annuity insurance products<br />
and, secondly, of so-called capitalization products under<br />
which investors are able to park capital at attractive interest<br />
rates. Although there was no mistaking an appreciable caution<br />
among broad groups of buyers – especially with respect<br />
Management report Markets, business climate and legal environment<br />
to a long-term commitment such as for retirement provision<br />
–, the German insurance industry presented an exceptionally<br />
stable picture – even without the growth eff ect stemming<br />
from single-premium business. Despite the limited<br />
growth potential due to the high level of market saturation in<br />
Germany, the capital and reserves of the German insurance<br />
industry make it – now more than ever – a reliable guarantor<br />
for protection against the diverse risks faced in both private<br />
and business life.<br />
In German property and casualty insurance the upturn in<br />
business was further consolidated – insofar as this was possible<br />
given the degree of market saturation reached in most<br />
lines – and led to premium growth of just under 1%. Motor<br />
insurance, the largest single line, continues to be of crucial<br />
importance to the business development in property and<br />
casualty insurance as a whole. Massive price competition<br />
had raged in this key line for numerous years; with the premium<br />
level no longer adequate, however, most providers<br />
have now begun to rethink their approach with an eye to<br />
greater commercial sense, and this has been refl ected in corresponding<br />
tariff increases for new business. This marks a<br />
fi rst step towards bringing about the urgently needed turnaround<br />
in average premiums – which are currently still falling<br />
– in motor business in the foreseeable future. The growth<br />
recorded in motor insurance in 2010 was generated above<br />
all by own damage insurance, while premiums for liability<br />
coverage continued to decline slightly. In the other property<br />
and casualty insurance lines, too, premium increases are to<br />
be expected for 2010 – with the exception of marine and<br />
general liability insurance. The picture on the claims side<br />
shows – compared with the burden of losses incurred in previous<br />
years and also with an eye to the premium growth – a<br />
disproportionately marked increase, which can be attributed<br />
not least to the major loss events recorded in the year under<br />
review (including winter storm “Xynthia”). The underwriting<br />
results are therefore likely to refl ect a rise of 1–2 percentage<br />
points in the combined ratio, which could not be off set by<br />
investment income on account of the low interest rate environment.<br />
39
40 <strong>Talanx</strong> Group Financial report 2010<br />
For the second consecutive year the German life insurance<br />
industry generated signifi cant premium growth in 2010. With<br />
an increase of 7% German life insurers (excluding providers<br />
of occupational retirement provision in the form of Pensionskassen<br />
and Pensionsfonds) boosted their gross written<br />
premium to around EUR 87 billion. As in the previous year,<br />
a signifi cant portion of this gratifying growth derived from<br />
single-premium business, which recorded a gain of some<br />
30% to reach a volume of EUR 26 billion. Single-premium<br />
business was assisted by the prevailing climate and capital<br />
market conditions. The funds available for investment were<br />
only able to attract very low interest rates in bank deposits, as<br />
a consequence of which considerable amounts were invested<br />
in products off ered by insurers ranging from immediate and<br />
deferred private annuities through so-called “Riester” and<br />
“basic” pensions to capitalization products. Capitalization<br />
products – normally short-term fi nancial investments similar<br />
to savings accounts – at times enjoyed very brisk demand,<br />
at least as long as an appealing above-average return was<br />
off ered. Since the fourth quarter of 2010, however, the growth<br />
momentum of this form of single-premium business has<br />
slowed appreciably – a refl ection of interest rate reductions<br />
and the wide-ranging restriction of such product off erings to<br />
the maturity benefi ts of providers’ own existing customers.<br />
In contrast to single-premium business, new business with<br />
regular premium payments fell away sharply owing to the<br />
fact that the willingness to enter into longer-term contracts<br />
evidently has still to re-establish itself across a broad front<br />
in the wake of the shock infl icted by the fi nancial crisis. Nevertheless,<br />
customers remain keenly interested in security.<br />
This need dovetails with the core competence of German<br />
life insurers, who are able to satisfy the diverse spectrum of<br />
return and security expectations with their extensive product<br />
range.<br />
Despite the protracted low interest rate environment, which<br />
continues to put German life insurers to an endurance test<br />
that must be taken seriously, and despite <strong>policy</strong>holder bo nuses<br />
that are sinking market-wide, maturity benefi ts in profi tsharing<br />
new endowment and annuity business declined<br />
only very moderately, if at all. In this respect, <strong>policy</strong>holders<br />
benefi ted from the fact that the fi xing of the interest rate for<br />
the interest paid on credit balances constitutes only one of<br />
several factors that determine the total amount of surplus<br />
participation.<br />
Legal and regulatory<br />
environment<br />
Particularly in the sphere of international and national<br />
supervisory law, the year under review again confronted<br />
the Group with a large number of new and sometimes complex<br />
developments in the legal environment that were not<br />
always adequately coordinated on the international level.<br />
Most notable on the European level was the fact that the<br />
European Commission moved forward with its “Omnibus<br />
II Directive” proposal; on the one hand, this contains widereaching<br />
Solvency II transitional measures, while, on the<br />
other, it is intended – as an omnibus directive – to make<br />
amendments to other directives in order to bring them into<br />
line with the new EU regulatory architecture for fi nancial<br />
supervision.<br />
The new European regulatory agency for the insurance<br />
industry, the Frankfurt-based European Insurance and<br />
Occupational Pensions Authority (EIOPA), commenced its<br />
work on 1 January 2011. It forms part of the newly implemented<br />
European System of Financial Supervision (ESFS),<br />
which encompasses the European Systemic Risk Board<br />
(ESRB), the three new regulatory bodies – namely the European<br />
Banking Authority (EBA), the European Insurance and<br />
Occupational Pensions Authority (EIOPA) and the European<br />
Securities and Markets Authority (ESMA) – and, last but not<br />
least, the national regulatory bodies.<br />
Even though EIOPA probably will not, as a general principle,<br />
have any powers for operational supervision of the Group,<br />
its infl uence on our regulatory environment will be signifi -<br />
cant. In the fi rst place, going forward it is envisaged that<br />
national regulators will have to justify divergences from<br />
EIOPA recommendations to EIOPA. Secondly, the “Omnibus II<br />
Directive” proposal includes powers to adopt so-called binding<br />
technical standards, on the basis of which EIOPA would<br />
like to develop a “single rule book” EU-wide by the end of 2011.
In general terms, particularly on the international level,<br />
an unchanged tendency – for example on the part of the<br />
Financial Stability Board – could again be observed in the<br />
year under review towards applying to the insurance sector<br />
considerations relating to the avoidance of crises in<br />
the banking sector without any discernible appreciation of<br />
the considerable material diff erences. The Group is closely<br />
tracking these tendencies and adds its appropriate critical<br />
input to the ongoing discussions.<br />
Developments on the national level in the year under review<br />
included, for example, the replacement of the Requirements<br />
for Remuneration Systems in the Insurance Industry initially<br />
published in December 2009 in the form of a Circular by<br />
the Federal Financial Supervisory Authority (BaFin) with the<br />
Regulation on the Supervisory Law Requirements for Remuneration<br />
Schemes in the Insurance Sector (VersVergV), which<br />
entered into force on 13 October 2010. The legal basis for<br />
adoption of such a Regulation had been lacking in 2009; the<br />
legislator created it in the year under review in the form of<br />
the new § 64 b Para. 5 Sentences 1–4 of the Insurance Supervision<br />
Act (VAG). The content of the Regulation leans very heavily<br />
on the BaFin Circular on Requirements for Remuneration<br />
Systems in the Insurance Industry published in the previous<br />
reporting period. Essentially, it remains the case that the aim<br />
of legislators with the remuneration rules is to avoid negative<br />
incentives through inappropriate variable remuneration<br />
components.<br />
The protracted period of low interest rates in the year under<br />
review has demonstrated that the stipulations contained in<br />
§ 153 Paragraph 3 of the Insurance Contract Act (VVG) governing<br />
the participation of insureds in the valuation reserves<br />
need to be adjusted. Under the current legal regulations,<br />
such low-interest rate phases lead to excessive participation<br />
of departing <strong>policy</strong>holders in the area of long-dated bonds;<br />
this is not compatible with considerations of fairness within<br />
the collective of <strong>policy</strong>holders or with the imperative that<br />
the risk-bearing capacity of life insurers should be preserved.<br />
In the year under review the Group took an active part in<br />
discussions with lawmakers regarding the urgent need for<br />
immediate adjustment of the legal situation.<br />
Management report Markets, business climate and legal environment. Business development<br />
Business development<br />
The <strong>Talanx</strong> Group recorded single- to double-digit percentage<br />
growth for a number of key indicators in 2010: specifi cally,<br />
gross written premium – especially in foreign markets –, new<br />
business and investment income. The increased premium<br />
and improved investment performance did not, however, off -<br />
set the decline in the underwriting result, as a consequence of<br />
which the operating profi t (EBIT) fell well short of the previous<br />
year. The reasons are varied in nature, but are associated<br />
in particular with considerably high risk provision at German<br />
life insurers and in international retail business, most notably<br />
with an eye to future capital market measures. Despite<br />
this, the Group’s fi nancial strength – expressed in terms of its<br />
solvency ratio – was boosted.<br />
Gross written premium<br />
in EUR billion<br />
Operating profit (EBIT)<br />
in EUR million<br />
19.4<br />
1,286<br />
19.1<br />
1,462<br />
19.0<br />
2006 2007 2008 2009 2010<br />
608<br />
20.9<br />
1,497<br />
22.9<br />
1,032<br />
1) Adjusted on the basis of IAS 8 2006 1) 2007 1) 2008 1) 2009 1) 2010<br />
41
42 <strong>Talanx</strong> Group Financial report 2010<br />
First steps in the restructuring completed<br />
As planned, the fi rst steps in the restructuring of the <strong>Talanx</strong><br />
Group’s primary insurance sector launched in September<br />
2009 have been completed and agreed upon with the social<br />
partner. What is more, they are already bearing the fi rst fruit:<br />
in Germany the Group was able to expand its new business in<br />
2010 despite challenging market conditions. The fact that our<br />
measures are already working shows that we have reached<br />
our fi rst milestone in the Group restructuring without losing<br />
sight of the market. Yet we have not yet accomplished<br />
our goal. The next steps in the Group restructuring for 2011<br />
will focus on German retail lines. Intensive preparations are<br />
already being made in order to get this division fi t for the<br />
future. The aim is to gear business processes and the organization<br />
to the needs of customers and sales partners and, with<br />
this in mind, to develop product, sales and service strategies<br />
that span the various lines of business.<br />
Advances in international business<br />
The Group can report unusually strong organic growth in<br />
foreign markets, most notably in Latin America – and here<br />
especially Brazil.<br />
The agreement of a cooperation arrangement with the Japanese<br />
life insurer Meiji Yasuda marked another success for<br />
the Group. In this connection <strong>Talanx</strong> AG issued a Solvency<br />
II-compliant bond subject to mandatory conversion at the<br />
time of the planned initial public off ering of <strong>Talanx</strong> AG. Meiji<br />
Yasuda Life took up this capital participation in a volume<br />
of EUR 300 million; at the same time the two companies<br />
entered into a strategic partnership. The pooling of both<br />
partners’ strengths increases the prospects for each of them<br />
to access new markets. Joint investments are envisaged in the<br />
focus markets of Poland and Turkey. What is more, by putting<br />
in place an institutional anchor shareholder even before<br />
going public <strong>Talanx</strong> enjoys greater security in its fi nancial<br />
planning.<br />
Business experience of the Group<br />
Gross written premium including savings elements of premium<br />
under unit-linked life and annuity policies grew by<br />
9% to EUR 22.9 (20.9) billion. The increase stemmed from<br />
reinsurance business as well as the Retail International segment.<br />
Growth was for the most part organic; movements in<br />
exchange rates accounted for 3 percentage points of the rise<br />
in premium. The number of policies in primary insurance<br />
business climbed by 5.4% to 23.6 (22.4) million, driven chiefl y<br />
by the companies abroad.<br />
Investment income surged by 20% to EUR 3.2 (2.7) billion. The<br />
increase was attributable to improvements in the primary<br />
insurance segments – especially Retail Germany – and in<br />
Non-Life Reinsurance. The operating profi t (EBIT) came in at<br />
EUR 1.0 (1.5) billion, a contraction of 31%. This was due principally<br />
to a poorer performance in German life insurance<br />
– driven above all by increased risk provision – as well as the<br />
poorer experience of certain companies in the Retail International<br />
division. As a further factor, aft er an exceptionally low<br />
burden of losses in the previous year, the underwriting result<br />
in Industrial Lines and Non-Life Reinsurance declined. Overall,<br />
the underwriting result deteriorated – in part also due<br />
to the participation of <strong>policy</strong>holders in the increased investment<br />
income – by 98% to –EUR 2.0 (–1.0) billion. Owing to<br />
rising combined ratios – especially in the Industrial Lines and<br />
Retail Germany divisions – the overall combined ratio moved<br />
higher: it climbed 4.2 percentage points to 100.9 (96.7)%. The<br />
other income also fell short of the previous year’s level. Group<br />
net income aft er tax and minorities reached EUR 220 (485)<br />
million, corresponding to a return on equity of 4.6 (11.8)% on<br />
the considerably higher level of Group shareholders’ equity<br />
relative to the previous year.
Development of the Group segments<br />
Segmental breakdown of gross premium<br />
Life/Health<br />
Reinsurance<br />
21%<br />
Non-Life<br />
Reinsurance<br />
26%<br />
Industrial Lines<br />
Figures in EUR million<br />
2010 2009<br />
Gross written premium 3,076 3,077<br />
Net premium earned 1,413 1,405<br />
Underwriting result –57 134<br />
Net investment income 231 240<br />
Operating result (EBIT) 185 335<br />
Combined ratio (net) 1) in % 104.1 90.5<br />
1) Including deposit interest result<br />
The Industrial Lines division is led by HDI-Gerling Industrie<br />
Versicherung AG. The company off ers the entire spectrum of<br />
individual products and services for its clients from eleven<br />
locations in Germany. Through subsidiaries, dependent<br />
branches in 28 countries and network partners its activities<br />
span the globe.<br />
Major companies in the Group segment<br />
Industrial Lines<br />
13%<br />
Retail Germany<br />
30%<br />
Retail International<br />
10%<br />
HDI-Gerling Industrie Versicherung AG Germany<br />
HDI-Gerling Australia Insurance Company Pty. Ltd. Australia<br />
HDI-Gerling Assurances (Belgique) S. A. Belgium<br />
HDI-Gerling de México Seguros S. A. Mexico<br />
HDI-Gerling Verzekeringen N. V. Netherlands<br />
HDI Versicherung AG Austria<br />
HDI Seguros S. A. Spain<br />
HDI-Gerling Insurance of South Africa Ltd. South Africa<br />
HDI-Gerling America Insurance Company USA<br />
Management report Business development<br />
As an internationally operating industrial insurer, HDI-<br />
Gerling Industrie supports its clients at home and abroad<br />
with bespoke solutions optimally tailored to their individual<br />
needs. The product range extends from casualty, motor,<br />
accident, fi re and property insurance to marine, special lines<br />
and engineering insurance. Industrial clients in Germany<br />
and foreign markets profi t from decades of experience in risk<br />
assessment and risk management, since the complex risks<br />
faced by industry and SMEs necessitate special protection.<br />
Comprehensive insurance solutions are assembled on the<br />
basis of customized coverage concepts, thereby providing the<br />
complete product spectrum needed to protect against entrepreneurial<br />
risks. Just as importantly, thanks to its many years<br />
of experience and proven expertise, HDI-Gerling provides<br />
professional claims management that delivers the fastest<br />
possible assistance worldwide in the event of loss or damage.<br />
Stable premium volume<br />
The gross written premium in the Industrial Lines segment<br />
amounted to EUR 3.1 (3.1) billion at the end of the year under<br />
review and was thus maintained on a stable level year-onyear.<br />
Developments varied widely in the various submarkets:<br />
whereas in Germany it was possible in some instances to<br />
push through premium increases in industrial liability business<br />
for certain contracts in response to losses, lines such as<br />
marine insurance with turnover-based policies still suff ered<br />
under the aft er-eff ects of the economic crisis; supplementary<br />
premium adjustments and lower renewal premiums led<br />
to premium erosion. The assumption of a legal protection<br />
portfolio from the Retail Germany segment accounted for<br />
premium growth of around EUR 18 million.<br />
The development of business in the various submarkets<br />
abroad was mixed: our Dutch company HDI-Gerling<br />
Verzekeringen N. V. (+EUR 16 million) and our Belgian company<br />
HDI-Gerling Assurances S. A. (+EUR 8 million) held<br />
their ground well and recorded appreciable premium gains<br />
43
44 <strong>Talanx</strong> Group Financial report 2010<br />
in fi ercely competitive environments. The premium income<br />
booked by the Austrian company HDI Versicherung AG came<br />
in fractionally lower at EUR 192 (193) million. The challenging<br />
competitive state of the local market, which led to price<br />
cuts most notably in motor business and the turnover-based<br />
lines, was a factor here. The Spanish company HDI HANNOVER<br />
International España, Cía de Seguros y Reaseguros S. A. saw<br />
its premium volume contract by EUR 48 million. This can be<br />
attributed almost entirely to a fundamental change in the<br />
company’s orientation: since mid-2009 it has no longer been<br />
writing any new business with retail customers. Premiums<br />
from this business – especially in motor insurance – had still<br />
been recognized in the previous year.<br />
The reinsurance premiums written in the segment remained<br />
stable at EUR 1.7 (1.7) billion. Net premiums earned tracked<br />
this development at an unchanged level of EUR 1.4 (1.4) billion.<br />
Underwriting result impacted by claims expenditures and<br />
additional reserving<br />
The net underwriting result of the Industrial Lines segment<br />
showed a loss of EUR 58 (previous year: profi t of 134) million.<br />
With a net expense ratio of 22.1 (21.9)% and a loss ratio of 82.0<br />
(68.6)%, the combined ratio stood at 104.1 (90.5)%.<br />
Net underwriting expenses in the Industrial Lines segment<br />
climbed by an appreciable EUR 201 million to EUR 1.5 (1.3) billion.<br />
This rise was driven chiefl y by the increase in claims<br />
expenditures for the fi nancial year across virtually all market<br />
segments, although this should be viewed against the backdrop<br />
of an unusually favorable experience in the previous<br />
year. In addition, extensive steps were taken in the year under<br />
review to strengthen the loss reserves, especially for existing<br />
claims in the public liability line.<br />
The reinsurers’ share of the claims and claims expenses<br />
remained on a par with the previous year at EUR 0.9 (0.9) billion<br />
despite the rise in gross expenses. On the one hand, the<br />
reinsurers participated to a disproportionately modest extent<br />
in the aforementioned strengthening of the reserves; on the<br />
other hand, reinsurers’ shares of the loss reserves totaling<br />
around EUR 13 million were released in connection with commutation<br />
of the reinsurance relationship with Global Re in<br />
the previous year. Not only that, in the 2010 fi nancial year<br />
a sizeable reinsurance quota share treaty was commuted in<br />
the motor line in Germany, resulting in derecognition of the<br />
corresponding reinsurers’ shares in an amount of roughly<br />
EUR 28 million and hence reducing accordingly the relief<br />
aff orded by reinsurance arrangements.<br />
The gross acquisition costs and administrative expenses<br />
contracted by 9% to EUR 568 (622) million; this can be attributed<br />
to HDI-Gerling Industrie Versicherung AG (decrease of<br />
EUR 43 mil lion) and HDI HANNOVER International España<br />
(decrease of EUR 16 million). The improvement at the largest<br />
company in the segment, HDI-Gerling Industrie Versicherung<br />
(HG-I), resulted from increased deferral of commissions; in the<br />
comparable period a smaller portion of the paid commissions<br />
had been deferred. The reduced acquisition costs and administrative<br />
expenses at the Spanish company were due to the<br />
drop in the business volume. The decrease of EUR 59 million<br />
in the reinsurers’ shares of the acquisition costs and administrative<br />
expenses slightly overcompensated for the positive<br />
trend in the gross expenses, as a consequence of which the<br />
net expenses were almost unchanged at EUR 312 (307) million.<br />
Investment income just under the level of the previous year<br />
The investment income retreated by a modest 4% to EUR 231<br />
(240) million. Crucial here was the fall of EUR 17 million in<br />
the investment income booked by HG-I to EUR 195 (212) million.<br />
This was due to the fact that gains from the disposal of<br />
investments were lower than in the comparable reporting<br />
period; in the previous year substantial profi ts had been<br />
realized from the sale of equity funds in a sizeable volume.<br />
The other companies in the segment posted slightly to signifi<br />
cantly higher investment income virtually across the<br />
board. The infl uence of the fi nancial crisis had all but faded<br />
in the year under review.<br />
Other income infl uenced by special eff ects<br />
Other income improved to EUR 11 (–39) million. In this<br />
case, too, the change was attributable chiefl y to HG-I; in<br />
both the previous year and the year under review its other<br />
income was infl uenced by special eff ects. In the previous<br />
year income from the reversal of impairments on reinsurance<br />
recoverables had been recognized in an amount of<br />
EUR 58 million. This had, however, been virtually off set<br />
by opposing expenditures from derecognition of an asset<br />
item which stemmed from the acquisition balance of the<br />
largest property/casualty risk carrier of the Gerling Group<br />
and constituted a contra item to the loss reserves assumed
at carrying values at the time of acquisition. In addition,<br />
impairments of around EUR 30 million had to be taken on<br />
reinsurance recoverables. In the year under review it was<br />
possible to release a signifi cant volume of sundry provisions,<br />
as a consequence of which the other income booked<br />
by HG-I improved to EUR 28 (–7) million.<br />
Operating profi t sharply lower<br />
The operating profi t generated by the Industrial Lines segment<br />
came in at EUR 185 (335) million, a reduction of 45%.<br />
The key factor in the decline in profi tability was the development<br />
of the underwriting result owing to increased claims<br />
expenditures, which – with investment income remaining on<br />
a stable level – were not off set by the improvement in other<br />
income.<br />
Retail Germany<br />
Figures in EUR million<br />
2010 2009<br />
Gross written premium 6,823 6,614<br />
Net premium earned 5,507 5,158<br />
Underwriting result –1,631 –945<br />
Net investment income 1,577 1,207<br />
Operating result (EBIT) –44 209<br />
Combined ratio (net) 1) in % 104.2 99.2<br />
1) Including deposit interest result<br />
The Retail Germany division, which brings together the German<br />
business transacted by HDI-Gerling with private and<br />
commercial customers as well as all German bancassurance<br />
activities, off ers domestic retail customers insurance protection<br />
that is tailored to their needs. In the life insurance<br />
sector the division also operates internationally in Austria.<br />
The name of the new divisional company with eff ect from<br />
December 2010 is <strong>Talanx</strong> Deutschland AG. The product<br />
range extends from non-life insurances through all lines of<br />
retirement provision to complete solutions for small and<br />
mid-sized enterprises as well as freelance professions. In this<br />
context all distribution channels are available – both a tied<br />
agents’ network as well as sales through independent intermediaries<br />
and multiple agents, direct sales and bancassurance<br />
cooperations.<br />
The functional organization ensures clear responsibilities<br />
and puts in place the foundation for operations spanning the<br />
previous line-based boundaries between property/casualty<br />
and life insurance products. This multi-line perspective is a<br />
vital prerequisite for improving processes and services to the<br />
benefi t of customers.<br />
Major companies in the Group segment<br />
HDI-Gerling Lebensversicherung AG<br />
HDI-Gerling Pensionskasse AG<br />
HDI Direkt Versicherung AG<br />
HDI-Gerling Firmen und Privat Versicherung AG<br />
HDI-Gerling Rechtsschutz Versicherung AG<br />
neue leben Lebensversicherung AG<br />
PB Lebensversicherung AG<br />
PBV Lebensversicherung AG<br />
TARGO Lebensversicherung AG<br />
TARGO Versicherung AG<br />
Management report Business development<br />
Premium volume and new business slightly higher than in<br />
the previous year<br />
Gross written premium in the Group segment of Retail Germany<br />
– including savings elements of premiums from unitlinked<br />
life insurance – increased by 3% in the 2010 fi nancial<br />
year to EUR 6.8 (6.6) billion.<br />
The gross written premium from our property/casualty<br />
insurance products decreased by 3% year-on-year to EUR 1.5<br />
(1.5) billion. The decrease stood at just 1.5% aft er factoring<br />
out the eff ect of the transfer of the industrial portfolio of<br />
HDI-Gerling Rechtsschutz Versicherung AG to the new<br />
Industrial Lines segment, and the fi gure was a mere 0.3% in<br />
the most signifi cant property/casualty line – namely motor<br />
business.<br />
In life insurance sector, gross written premium including<br />
savings elements from premiums under unit-linked life<br />
insurance products was boosted by 5% in the year under<br />
review to EUR 5.4 (5.1) billion. This increase was driven in<br />
large measure by the particularly favorable development of<br />
single-premium business at Targo Lebensversicherung AG,<br />
PBV Lebensversicherung AG and neue leben Lebensversicherung<br />
AG, which together improved their gross premiums<br />
by EUR 277 million. Gross premiums of altogether<br />
EUR 2.5 billion – as in the previous year – were generated<br />
by the companies HDI-Gerling Lebensversicherung AG<br />
and Aspecta Lebensversicherung AG, which were merged<br />
with eff ect from 1 October 2010. In this case premium<br />
45
46 <strong>Talanx</strong> Group Financial report 2010<br />
erosion stemming primarily from the portfolio of policies<br />
with a regular premium payment held by the former<br />
Aspecta Lebensversicherung AG was off set by increased<br />
new business with a single premium payment. Looked at<br />
overall, then, the positive development of our life insurance<br />
products – refl ecting the market trend – derived from<br />
sharply higher single-premium business despite declining<br />
regular premiums; it should be noted in this context that<br />
our Group does not market any capitalization products.<br />
PB Lebensversicherung AG, which now only writes new business<br />
in the area of credit life, recorded a premium decrease<br />
of EUR 11 million. Measured by the internationally recognized<br />
yardstick of the Annual Premium Equivalent (APE),<br />
the new business booked by the life insurers grew to EUR 515<br />
(462) million and thus surpassed the previous year by 11%.<br />
The level of retained premium in the segment as a whole<br />
climbed from 89.2% to 92.6%, primarily as a consequence of<br />
the increase in single premiums combined with the drop in<br />
ceded regular premiums.<br />
Underwriting result retreats sharply<br />
The underwriting result fell by a substantial 73% overall to<br />
–EUR 1.6 (–0.9) billion. It includes inter alia the compounding<br />
of the technical liabilities (allocation to the benefi t reserve)<br />
and the participation of our <strong>policy</strong>holders in the investment<br />
income – which increased in the year under review owing to<br />
the development of capital markets (allocation to the provision<br />
for premium refunds). The income opposing these<br />
expenses is, however, recognized in the investment income,<br />
hence causing the underwriting result to close in negative<br />
territory.<br />
More than 9/10 of the underwriting result in the segment<br />
was determined by life insurance products: in this respect<br />
it decreased by 65% relative to the previous year to –EUR 1.6<br />
(–1.0) billion. The reasons were partly connected with the positive<br />
trend on capital markets in comparison with the previous<br />
year, but were also associated with various special charges.<br />
Thus, for example, in the context of the retroactive merger of<br />
Aspecta into HDI-Gerling Lebensversicherung AG reinsurance<br />
treaties were commuted, which – insofar as they were not<br />
off set by contributions from the controlling company – led to<br />
the bringing forward of a balance sheet strain in the reporting<br />
period. Strains were also incurred from the adjustment of<br />
values relating to various technical items in the balance sheet<br />
in connection with life business, especially as a consequence<br />
of capital market movements and changed cost structures<br />
as well as the associated lower contribution margins for inforce<br />
business. Not only that, the amortization of deferred<br />
acquisition costs and write-downs taken on in-force insurance<br />
portfolios also crucially impacted the performance of our life<br />
insurers. This was due principally to the capital market development<br />
in the year under review, which necessitated adjustments<br />
to the assumptions underlying the forecast of future<br />
profi ts. The underwriting result from property/casualty products<br />
fell from EUR 12 million to –EUR 56 million, fi rst and foremost<br />
on account of the claims experience. Key factors here<br />
– along with the favorable claims experience in the previous<br />
year – were the growth in motor business against a backdrop<br />
of lower average premiums. The loss reserves also had to be<br />
strengthened. The combined ratio for the segment as a whole<br />
stood at 104.2 (99.2)%.<br />
Investment income improves<br />
Investment income surged by an appreciable EUR 370 million<br />
(+31%) to EUR 1.6 billion. This increase was made possible by<br />
extraordinary income that was considerably better than in<br />
the previous year. While the previous year’s result had still<br />
been overshadowed by impairments on investments and<br />
losses on disposals in connection with the fi nancial crisis,<br />
gains on disposals from equity funds were the hallmark of<br />
the extraordinary profi t in the year under review. Of the total<br />
investment income, an amount of EUR 1.5 (1.1) billion is to be<br />
credited in very large measure pro rata to the holders of life<br />
insurance policies.<br />
Operating result falls short of the previous year<br />
The operating result (EBIT) came in at –EUR 44 (+209) million.<br />
The stronger investment income did not suffi ce to off set the<br />
marked reduction in the underwriting result. The EBIT was<br />
heavily infl uenced by the decline at HDI-Gerling Lebensversicherung<br />
AG (incl. Aspecta Lebensversicherung AG), but above<br />
all by the amortization of deferred acquisition costs at PBV<br />
Lebensversicherung AG, claims-related expenditures at<br />
HDI-Gerling Firmen- und Privatversicherung AG and cost burdens<br />
associated with the reorganization of the sales companies.
Retail International<br />
Figures in EUR million<br />
2010 2009<br />
Gross written premium 2,233 1,827<br />
Net premium earned 1,742 1,403<br />
Underwriting result –136 –99<br />
Net investment income 151 121<br />
Operating result (EBIT) 27 –42<br />
Combined ratio (net) 1) in % 105.2 102.5<br />
1) Including deposit interest result<br />
The Group segment of Retail International brings together<br />
the activities of the companies transacting retail business<br />
in property/casualty insurance, life insurance and bancassurance<br />
in international markets; it serves more than 8 million<br />
customers in 12 countries. The segment is led by <strong>Talanx</strong><br />
International AG (previously: HDI-Gerling International<br />
Holding AG).<br />
In this division we off er private and commercial customers<br />
abroad comprehensive insurance protection tailored to<br />
their needs. The product range encompasses inter alia motor<br />
insurance, property and casualty insurance, marine and fi re<br />
insurance as well as various off erings in the life insurance<br />
sector. Seasoned, expert management combined with the<br />
considerable underwriting expertise of local staff form the<br />
backbone of the <strong>Talanx</strong> International group. By drawing upon<br />
local, industry-specifi c know-how and our presence through<br />
an extended distribution network we are able to identify our<br />
customers’ particular requirements in foreign markets and<br />
provide customized solutions.<br />
Foreign business is to a large extent written through brokers<br />
and agents. Many of our companies also use post offi ces and<br />
banks as a sales channel.<br />
Major companies in the Group segment<br />
Management report Business development<br />
HDI Seguros S. A. Brazil<br />
HDI Zastrahovane AD Bulgaria<br />
HDI Seguros S. A. Chile<br />
HDI Assicurazioni S. p. A. Italy<br />
InChiaro Assicurazioni S. p. A Italy<br />
HDI Seguros S. A. Mexico<br />
HDI-Gerling Zycie TU S. A. Poland<br />
HDI Asekuracja TU S. A. Poland<br />
OOO Strakhovaya Kompaniya<br />
“HDI Strakhovannie” 1) Russia<br />
OOO Strakhovaya Kompaniya “CiV Life” Russia<br />
CiV Hayat Sigorta A. Ş. Turkey<br />
HDI Sigorta A. Ş. Turkey<br />
HDI Strakhuvannya Ukraine<br />
Magyar Posta Biztosító Zrt. Hungary<br />
Magyar Posta Életbiztosító Zrt. Hungary<br />
1) Since the third quarter of 2010; business to be written fr om 2011 onwards.<br />
The company will complement the product portfolio of CiV Life with property/<br />
casualty products.<br />
Development of key markets<br />
Along with the general statements already made regarding<br />
the international insurance markets pages 38 et seq.,<br />
the following remarks may be added with respect to our<br />
highest-volume markets in this segment – Brazil, Italy and<br />
Poland: Brazil has recovered very quickly from the global<br />
economic and fi nancial market crisis. Economic output<br />
had already moved back into positive growth rates by the<br />
second quarter of 2009. With a view to countering any<br />
overheating of the Brazilian economy, spending cuts were<br />
announced in the course of 2010 and the prime rate was<br />
raised. In this market we are particularly active in motor<br />
insurance, which promises further growth in keeping with<br />
the favorable economic trend. Poland’s economic output has<br />
already shown soft er, but nevertheless positive growth since<br />
2009 – despite the global economic and fi nancial market<br />
crisis. These developments also promise further growth for<br />
the insurance market. In addition to motor insurance, we<br />
transact other lines in Poland such as casualty and general<br />
property insurance as well as life insurance. The year under<br />
review, especially the fi rst half of the year, was heavily overshadowed<br />
by the fl ooding along the rivers Oder and Vistula.<br />
On the Italian market we conduct operations both in the<br />
life insurance market and in property/casualty insurance<br />
47
48 <strong>Talanx</strong> Group Financial report 2010<br />
– predominantly motor insurance. The company noted the<br />
fi rst indications of rate increases beginning to take hold in<br />
motor insurance in 2010 aft er several years of fi erce competitive<br />
and pricing pressure.<br />
Premium volume and new business sharply higher<br />
Gross written premium in the segment climbed 22% year-onyear<br />
to EUR 2.2 (1.8) billion; adjusted for exchange rate eff ects,<br />
growth came in at 13%.<br />
The growth in property/casualty products (+32%) derived<br />
partly from exchange rate eff ects. If these eff ects are factored<br />
out, premium growth of 19% was booked in the property/<br />
casualty sector relative to the previous year. Most notably,<br />
the exchange rates for the Brazilian, Polish, Turkish and<br />
Mexican currencies strengthened appreciably. While the<br />
Brazilian company HDI Seguros delivered premium growth<br />
of 21% in the local currency based on its robust market position<br />
in the country, growth surged to 45% aft er translation<br />
into euros. The situation was similar at the Polish company<br />
HDI Asekuracja, into which HDI-Gerling Polska was merged<br />
in the second quarter of 2010 with retroactive eff ect from<br />
1. January 2010. Premium growth in the local currency stood<br />
at 5% compared to the previous year (taking into account<br />
the aggregate premium of what were then two companies),<br />
while the increase amounted to 13% aft er translation into<br />
euros. Similarly, the Turkish company HDI Sigorta boosted<br />
its premium volume by 28% in the local currency thanks to<br />
intensifi ed marketing eff orts and the opening of new agencies,<br />
whereas in euros the increase was as much as 38% owing<br />
to the favorable movement in exchange rates. The contribution<br />
delivered by HDI Seguros Mexico, which was added to<br />
the Group in the fourth quarter of 2009 and was thus only<br />
included pro rata in the comparable period, amounted to<br />
EUR 62 million.<br />
New business in our international property/casualty insurance<br />
portfolio was boosted in the 2010 fi nancial year – measured<br />
by <strong>policy</strong> numbers. The key driver here was the motor<br />
line, accounting for a portfolio around 4.3 (4.1) million of altogether<br />
roughly 7.8 (7.2) million policies.<br />
In the fi nancial year just-ended the Italian company HDI<br />
Assicurazioni generated premium volume in the life insurance<br />
sector of EUR 325 million, a decline of somewhat more<br />
than 9% relative to the previous year. The major factor in<br />
the previous fi nancial year had been the implementation<br />
of a government tax amnesty, as a consequence of which<br />
considerable amounts were available for investment in<br />
single-premium products – a state of aff airs from which life<br />
insurance policies also profi ted as an attractive investment<br />
alternative. This trend from 2009 was sustained in 2010,<br />
albeit not on the same scale. At the same time the company<br />
booked growth of around 9% from sales of property/casualty<br />
products (especially in the motor liability line) on the back of<br />
a higher average premium, as a result of which its total premium<br />
volume remained stable.<br />
The companies abroad transferred from Proactiv Holding<br />
AG to <strong>Talanx</strong> International Holding AG as part of the Group<br />
restructuring also played their part in premium growth. Our<br />
Hungarian life insurer, for example, boosted its premium<br />
volume by 11% from EUR 92 to 103 million thanks to its successful<br />
sales and marketing activities. Similar growth was also<br />
recorded by the companies in Russia and Turkey. Although<br />
they are still of minor importance measured by the total volume,<br />
they rank among the fastest growing companies in their<br />
markets. Our Russian company CiV Life grew its premium<br />
income by around 56% year-on-year, while our Turkish operation<br />
CiV Hayat boosted its volume by around 102% with the<br />
aid of successful sales activities – including intensive coaching<br />
measures – as well as modifi ed products. The Polish company<br />
HDI-Gerling Zycie also more than doubled its premium<br />
income year-on-year, most notably in the area of unit-linked<br />
life products, thanks to a new cooperative venture with the<br />
Polish BRE Bank launched in the middle of the year.<br />
Measured in terms of the APE, new business in international<br />
life insurance contracted to EUR 128 million, a fall of 4%<br />
relative to the previous year. The APE is split in particular<br />
between endowment policies and unit-linked as well as nonunit-linked<br />
products.<br />
The level of retained premium in the segment – at 90.0% –<br />
was 4.4 percentage points higher than at year-end 2009; as<br />
described in the following section, an infl uencing factor here
was the cancellation of a quota share reinsurance treaty in<br />
the motor line at the Turkish company HDI Sigorta, which<br />
caused its retention to rise from 55.8% to 85.7%.<br />
Underwriting result reduced<br />
The combined ratio in international property/casualty insurance<br />
was 105.2 (102.5)%, a refl ection in part of the aboveaverage<br />
burden of losses incurred in the fi rst half of the year<br />
under review. Particularly signifi cant here were fl ood and<br />
winter-related damage, which took a heavy toll on the result<br />
of the Polish company HDI Asekuracja. As a consequence<br />
of changes in the reinsurance structure for the motor line<br />
at this company, the reinsurer’s share of the paid claims<br />
decreased – leading to higher net claims expenditure. The<br />
company’s underwriting result therefore fell to –EUR 28 (–3)<br />
million. Similarly, the earthquake in Chile at the end of February<br />
2010 adversely impacted the burden of losses incurred by<br />
the Chilean company HDI Seguros. Changes in local supervisory<br />
law compelled the Turkish company HDI Sigorta to cancel<br />
a multi-year quota share reinsurance treaty in the motor<br />
line. The eff ect of cancelling this treaty is the primary reason<br />
why the company – despite growing its portfolio – closed the<br />
year under review with an underwriting defi cit of –EUR 52<br />
(–12) million. The deterioration in the underwriting result for<br />
the segment from –EUR 99 million to –EUR 136 million was<br />
therefore driven chiefl y by the companies HDI Sigorta and<br />
HDI Asekuracja. In addition, the loss reserves at some Group<br />
companies were strengthened on the basis of an annually<br />
compiled external loss reserve assessment.<br />
In the fi nancial year just-ended the writing of new business<br />
at the companies ASPECTA Liechtenstein and ASPECTA Luxemburg<br />
was discontinued until further notice on the basis of<br />
the Group’s strategic reorientation and both companies went<br />
into run-off ; consequently, the two companies produced an<br />
underwriting defi cit of –EUR 21 million overall. Our Brazilian<br />
company, on the other hand, boosted its underwriting profi t<br />
from EUR 1 million to EUR 13 million.<br />
Substantially increased investment income<br />
In the 2010 fi nancial year investment income of EUR 150 million<br />
was generated in the Retail International segment, an<br />
improvement of 24% over the previous year – in which the<br />
investment income booked by companies was still heavily<br />
overshadowed by the aft er-eff ects of the fi nancial crisis. The<br />
increased gains realized from the disposal of equities and<br />
fi xed-income securities contrasted as at year-end 2010 with<br />
appreciably lower realized losses than in the previous year. In<br />
the case of the Italian company HDI Assicurazioni, for example,<br />
impairments of EUR 14 million had to be taken on investments<br />
at the end of 2009; at year-end 2010 they amounted<br />
to just EUR 8 million. In addition, ordinary investment income<br />
was favorably aff ected by a modest upturn in the interest rate<br />
level in a small number of countries. The Brazilian company<br />
HDI Seguros, for example, boosted its investment income by<br />
55% year-on-year to EUR 39 (25) million.<br />
Operating result returns to positive territory<br />
The Retail International segment reported an operating result<br />
(EBIT) of EUR 26 (–42) million in the year under review. The<br />
amortization of goodwill for our Mexican subsidiary resulted<br />
in a charge to EBIT.<br />
Non-Life Reinsurance<br />
Management report Business development<br />
2009 2008 1) 2007 1), 2) 2006 1)<br />
2010<br />
Figures in<br />
EUR million<br />
Gross written<br />
premium<br />
Net premium<br />
6,340 5,753 4,997 5,611 7,143<br />
earned<br />
Underwriting<br />
5,395 5,237 4,287 4,631 5,638<br />
result<br />
Net invest-<br />
78 136 200 16 79<br />
ment income<br />
Operating<br />
779 610 47 863 925<br />
result (EBIT)<br />
Combined<br />
ratio (net)<br />
909 760 122 902 813<br />
3)<br />
in % 98.3 96.7 95.0 98.8 98.2<br />
1) Limited comparability due to changes in segment allocation<br />
2) Adjusted on the basis of IAS 8<br />
3) Including deposit interest result<br />
49
50 <strong>Talanx</strong> Group Financial report 2010<br />
By far the bulk of the non-life reinsurance transacted within<br />
the <strong>Talanx</strong> Group is written by the Hannover Re Group.<br />
Hannover Re maintains business relations with more than<br />
5,000 insurance companies in about 150 countries. With a<br />
global network consisting of more than 100 subsidiaries,<br />
affiliates, branches and representative offices in around<br />
20 countries, the group employs approximately 2,200 staff .<br />
In non-life reinsurance we do not pursue any growth targets,<br />
but instead keep a close eye on rate movements: we<br />
expand our business if the rate situation is favorable and<br />
scale back our portfolio if prices are not commensurate with<br />
the risks.<br />
Business experience in 2010 in line with expectations<br />
The expectations expressed with regard to the treaty renewals<br />
as at 1 January 2010 were confi rmed over the course of<br />
the year: prices remained broadly stable, although they soft -<br />
ened slightly in loss-free segments. Rate increases were also<br />
recorded in areas that had seen sizeable losses in 2009, such<br />
as aviation insurance or credit and surety reinsurance. The<br />
fact that prices remained on a largely stable level also refl ects<br />
the underwriting discipline practiced among reinsurers. Given<br />
the lower returns attainable on investments owing to the low<br />
interest rate level, the primary focus of attention was even<br />
more heavily on underwriting results. This was also true of<br />
the various treaty renewal phases that took place within<br />
the year.<br />
The treaty renewals in North America were in line with our<br />
expectations, although the rate level in many areas was not<br />
adequate. We therefore exercised caution in assuming additional<br />
risks. In credit and surety business – despite growing<br />
capacity on the market – we were again able to push through<br />
signifi cantly improved conditions and expand our market<br />
position. In worldwide catastrophe business prices for reinsurance<br />
covers declined as expected owing to the relatively<br />
untroubled major loss experience in 2009 as well as the<br />
improved capital resources of primary insurers. Rate reductions<br />
in the United States were particularly marked; price<br />
increases were nevertheless obtained under loss-impacted<br />
programs in certain regions. All in all, we enjoyed very good<br />
opportunities to generate profi table business and extend our<br />
market share. The focus of our activities was on the markets<br />
of China as well as Central and Eastern Europe, facultative<br />
reinsurance and agricultural risks. In the UK market, too,<br />
Hannover Re successfully extended its position.<br />
Premium growth of 10%<br />
The gross premium volume for our Non-Life Reinsurance<br />
segment increased as forecast, rising by 10% to EUR 6.3 (5.8) billion.<br />
At constant exchange rates, especially against the US<br />
dollar, growth would have come in at 7%. The level of retained<br />
premium fell from 94.1% to 88.9%. Net premium earned<br />
climbed 3% to EUR 5.4 (5.2) billion.<br />
Healthy profi tability despite heavy loss expenditure<br />
Even though the hurricane season in North and Central<br />
America again passed off very moderately in the year under<br />
review without any expenditures for our account, the major<br />
loss situation was exceptionally strained in 2010. Hannover<br />
Re’s total net expenditure on catastrophe losses and major<br />
claims in the year under review amounted to EUR 662 million,<br />
compared to EUR 240 million in the previous year. It thus<br />
surpassed the expected level of EUR 500 million. Against this<br />
backdrop, the combined ratio climbed to 98.3 (96.7)%. The<br />
largest single loss event for our account in the year under<br />
review – at EUR 182 million – was the severe earthquake in<br />
Chile. The devastating earthquake in Haiti, on the other hand,<br />
produced a somewhat more modest loss amount of EUR 27 million<br />
owing to lower insured values. In Europe, too, we were<br />
impacted by a number of natural disasters in the year under<br />
review, including for example several fl ood events and a powerful<br />
winter storm (“Xynthia”). The earthquake in New Zealand,<br />
which caused destruction on a massive scale, resulted in<br />
a net strain of EUR 114 million for our account.<br />
Along with the aforementioned natural disasters, one loss<br />
event in particular attracted worldwide attention in the year<br />
under review – namely the sinking of the “Deepwater Horizon”<br />
drilling rig, which caused extensive environmental damage.<br />
Particularly with regard to possible liability claims, very<br />
many questions remain unanswered; the loss for the insurance<br />
industry and hence also for reinsurers is therefore still<br />
diffi cult to assess. The loss reserves of EUR 85 million that we<br />
set aside in 2010 refl ect all the actual and potential exposures<br />
for our portfolio from this complex loss event that are known<br />
to us at this point in time and, as things currently stand, represent<br />
a conservative level of reserving.
In view of the substantial major loss expenditure, the underwriting<br />
result for non-life reinsurance contracted year-onyear<br />
by EUR 58 million to EUR 78 (136) million. Net investment<br />
income climbed 28% to EUR 779 (610) million. The operating<br />
profi t (EBIT) in this segment increased by 20% to EUR 909<br />
(760) million. The very good profi t on ordinary activities was<br />
assisted by a special eff ect associated with a decision of the<br />
Federal Fiscal Court (BFH). Aft er the BFH had confi rmed that<br />
taxation of foreign-sourced investment income recorded by<br />
Irish subsidiaries was not permissible, we were able to release<br />
provisions that had been constituted in this regard. Against<br />
this backdrop, all tax risks were reassessed.<br />
Our business fared better than expected in the year under<br />
review in our target markets of Germany and North America:<br />
the premium volume remained virtually unchanged at<br />
EUR 1,754 (1,738) million. The combined ratio stood at 97.4%<br />
in the year under review, aft er 104.7% in the previous year.<br />
The operating profi t (EBIT) for the target markets totaled<br />
EUR 301 (119) million.<br />
The development of our specialty lines was thoroughly satisfactory.<br />
This subsegment of non-life reinsurance includes<br />
marine and aviation business, credit/surety, structured reinsurance,<br />
ILS (insurance-linked securities), the London market<br />
and direct business. The premium volume climbed from<br />
EUR 2,234 million to EUR 2,372 million. The combined ratio<br />
improved to 91.4 (96.5)%. The specialty lines segment delivered<br />
an operating profi t (EBIT) of EUR 370 (256) million.<br />
We combine all markets worldwide under global reinsurance,<br />
with the exception of our target markets of Germany and<br />
North America and the specialty lines. This subsegment also<br />
encompasses worldwide catastrophe business, facultative<br />
reinsurance, agricultural risks and Sharia-compliant retakaful<br />
business. The development of markets in global reinsurance<br />
business was challenging in the year under review. The<br />
premium volume here surged by 25% to EUR 2,213 (1,775) million.<br />
The combined ratio soared to 106.1 (87.9)% owing to an<br />
exceptionally heavy burden of major losses. The operating<br />
profi t (EBIT) consequently shrank to EUR 112 (356) million.<br />
Life/Health Reinsurance<br />
2010<br />
2009 1) 2008 1) 2007 2006<br />
Figures in<br />
EUR million<br />
Gross written<br />
premium<br />
Net premium<br />
5,090 4,529 3,135 3,083 2,794<br />
earned<br />
Net invest-<br />
4,654 4,078 2,785 2,795 2,374<br />
ment income<br />
Operating<br />
508 525 371 313 345<br />
result (EBIT) 276 371 114 231 146<br />
1) Adjusted on the basis of IAS 8<br />
Management report Business development<br />
The Group segment of Life/Health Reinsurance brings together<br />
our reinsurance activities in the life, annuity and health lines<br />
under the worldwide Hannover Life Re brand name. We also<br />
write the accident line in this segment, to the extent that it is<br />
transacted by life insurers, as well as some Islamic insurance<br />
products, the so-called family takaful products.<br />
Tried and trusted business model<br />
In the year under review we moved a signifi cant step closer<br />
towards attaining our longer-term goal of becoming the<br />
number three in the worldwide life reinsurance market. Outside<br />
the US we already rank third by a wide margin.<br />
We are able, on the one hand, to selectively tap into attractive<br />
business potential in the traditional market through conventional<br />
reinsurance off erings, while at the same time working<br />
systematically on the development of special product and<br />
sales solutions through our four specialist segments. To a<br />
signifi cant extent Hannover Life Re is thus able to decouple<br />
itself from developments on the standard reinsurance markets.<br />
In many instances Hannover Life Re has been able to operate<br />
as a pioneer for new markets and has played a crucial role<br />
in shaping the dynamic growth of these markets – the entry<br />
into the UK private annuity sector with enhanced annuities<br />
in the years 1994/95 may be cited as a well-known example<br />
of this approach.<br />
51
52 <strong>Talanx</strong> Group Financial report 2010<br />
At the present time conventional reinsurance accounts for<br />
the lion’s share of our portfolio. In the medium term, however,<br />
we anticipate stronger growth from the pillars of new<br />
markets and bancassurance; it should therefore be possible<br />
to restore the desired long-term balance between conventional<br />
reinsurance (at around 40% of the portfolio) and the<br />
other four pillars (at around 60% of the portfolio) in the next<br />
few years.<br />
Value contribution through diversifi cation<br />
We devote particularly close attention to optimal risk diversifi<br />
cation – something which is also evident in the relevant risk<br />
models under Solvency II. The negative correlation between<br />
the biometric components of mortality and longevity plays a<br />
special role here.<br />
The growth in longevity business diversifi es our mortality<br />
risk, while the growth on emerging markets in Asia, Africa<br />
and Latin America serves to improve the geographical spread<br />
of our portfolio from the major markets of the United States,<br />
United Kingdom and Germany; fi nancial solutions provide<br />
an additional element of structural diversifi cation.<br />
All in all, we consider Hannover Life Re to be a superbly<br />
diversifi ed reinsurer that optimally combines the prospects<br />
for long-term growth and profi tability over the next 20 to 30<br />
years. Certain risks that enjoy occasional demand as growth<br />
drivers in the international reinsurance markets have been<br />
considered unreinsurable by our company for quite some<br />
years. We include here derivative fi nancial options and guarantees<br />
deriving from variable annuity products, the longevity<br />
risk for affl uent socio-economic groups and life-long guarantees<br />
for morbidity products.<br />
Our business model is founded on a concept of organic<br />
growth, although we are open to acquisitions. Going forward,<br />
as in the past, we expect to maintain our growth on an average<br />
level of 10 to 12% per year through appropriate portfolio<br />
acquisitions, thereby systematically gaining market shares in<br />
the global market without this detrimentally impacting the<br />
quality of our acceptances.<br />
Business development<br />
As expected, the repercussions of the international fi nancial<br />
market crisis continued to reverberate beyond 2009. On the<br />
one hand, consumers in many markets showed caution when<br />
it came to demand for long-term life insurance products; on<br />
the other hand, the persistency of older in-force portfolios<br />
deteriorated owing to an increased lapse rate. What is more,<br />
in the important US mortality market and in the Australian<br />
disability market we noted an increase in the biometric claim<br />
frequencies; in some cases they were signifi cantly higher<br />
than the comparative historical values. Aft er detailed analysis<br />
of the data it is our assumption that these are temporary<br />
phenomena. Despite this sometimes diffi cult environment,<br />
we were again able to generate a highly satisfactory result in<br />
life/health reinsurance.<br />
Market position extended<br />
We selectively strengthened our position in our relevant<br />
focus markets of the United States, United Kingdom, Germany,<br />
Australia and France.<br />
In view of the extremely competitive market climate, we<br />
wrote new mortality and critical illness/trauma risks in the<br />
UK and Australian markets only with considerable restraint.<br />
In large parts of these markets we no longer consider the<br />
reinsurance conditions to be commensurate with the risks.<br />
On the other hand, following on from the acquisition of the<br />
ING life reinsurance portfolio in 2009, we again signifi cantly<br />
expanded our position in the US mortality market in the<br />
course of the year under review. We revived reinsurance relations<br />
with several ceding companies and are now well on<br />
track in the medium term to becoming a relevant market<br />
player in the US mortality market with a 10 to 15% share of<br />
new business.<br />
We were similarly able to build on our leading role in the UK<br />
longevity market. We have a strong presence in new business<br />
involving personal annuities for individuals with a reduced<br />
life expectancy; in this area we support a number of particularly<br />
dynamic providers through quota share reinsurance<br />
models.<br />
What is more, we are expanding activities relating to the<br />
reinsurance of sizeable pension funds in the United Kingdom<br />
through so-called longevity swaps – under which the rein-
surer assumes the biometric risk of longevity associated with<br />
a portfolio (normally only the part of the portfolio on which<br />
benefi ts are already being paid) in exchange for payment of a<br />
regular fi xed premium.<br />
In South Africa we continue to be the leading life reinsurer,<br />
based on our extensive support for innovative, customeroriented<br />
insurance companies. In the Indian market, in which<br />
we only established a footing in 2008 with a service offi ce in<br />
Mumbai, we moved forward with our strategic life cooperation<br />
with GIC Re and were able to acquire a number of Indian<br />
primary insurers as new clients.<br />
In the Chinese market (Greater China) we are currently represented<br />
by three offi ces: the branch in Hong Kong serves both<br />
the market comprised of locally-based life insurers and the<br />
regional centers of large multinational insurance groups. It<br />
also operates as a regional service center for East Asia. Our<br />
service offi ce in Taipei serves the local Taiwanese market. The<br />
branch in Shanghai concentrates on business from China,<br />
where – in close cooperation with and express approval from<br />
the local regulator (CIRC) – we were able to close the fi rst two<br />
liquidity-related fi nancing transactions.<br />
The development of our business in the Islamic insurance<br />
sector (takaful), which we write through our subsidiary<br />
Hannover ReTakaful in Manama/Bahrain, was also highly<br />
gratifying. Our retakaful cedants are located predominantly<br />
in Saudi Arabia, Bahrain and the United Arab Emirates.<br />
Pleasing premium growth<br />
The gross premium income booked in the year under review<br />
totaled EUR 5.1 billion, an increase of 12% relative to the previous<br />
year’s fi gure of EUR 4.5 billion. At constant exchange rates<br />
– especially against the US dollar – growth would have come<br />
in at 7%. Net premium earned amounted to EUR 4.7 billion;<br />
this represents a slightly higher level of retained premium of<br />
91.7% compared to the previous year.<br />
In geographical terms, growth impetus in the year under<br />
review derived from the United States, United Kingdom,<br />
South Africa, Latin America and East Asia – particularly noteworthy<br />
is the rapid growth witnessed in China.<br />
Management report Business development<br />
The core of our activities is in the life and annuity lines,<br />
which accounted for altogether 87% of worldwide premium<br />
income in the year under review.<br />
The various covers associated with the biometric risk segment<br />
of morbidity, such as disability covers, critical illness/<br />
trauma covers and health covers, accounted for 11%, while the<br />
modest but highly profi table portfolio of accident business<br />
contributed a share of 2%.<br />
The experience of the biometric risks of mortality and morbidity<br />
was extremely mixed in the year under review and less<br />
favorable overall than in the two previous years. Irregularities<br />
were observed in the mortality risk in some subsegments of<br />
the US portfolio, which – especially in the second half of the<br />
year – was impacted by an unusually large number of claims<br />
with high sums insured. In total, additional expenditure in<br />
the mid-double-digit million euro range was incurred. The<br />
claims experience in Australian disability annuity business<br />
was similarly unusual: the period during which annuity<br />
recipients remained in the disability phase was longer by<br />
market standards. This prompted a strengthening of the IBNR<br />
reserves and the provision for claims already being paid out.<br />
Altogether, additional expenditure in the low-double-digit<br />
million euros was incurred.<br />
We continued to enjoy very favorable claims experiences in<br />
the United Kingdom, Germany and France as well as in the<br />
emerging markets of South Africa, Latin America and Asia.<br />
The results of the longevity risk, which at the present time<br />
we write primarily in the United Kingdom, are inconspicuous<br />
and currently in line with our actuarial assumptions.<br />
Investment income almost on a par with the previous year<br />
To a large extent we do not carry any investment risk with<br />
respect to the investments that we deposit with ceding companies<br />
under reinsurance contracts fi nanced from premiums;<br />
this is because the reinsurer is credited with fi xed interest<br />
income irrespective of whether or not the primary insurer<br />
generates this rate of return.<br />
The situation is diff erent in the US reinsurance market, where<br />
we are exposed to a volatility risk through the market-oriented<br />
measurement of the securities deposited under ModCo<br />
reinsurance treaties. For 2010 this risk – the development of<br />
53
54 <strong>Talanx</strong> Group Financial report 2010<br />
which is refl ected on the accounting side through unrealized<br />
gains/losses – showed a slightly positive experience, compared<br />
with the profi t running into the low-triple-digit million euros<br />
that had been recognized in the previous year.<br />
Total investment income came in at EUR 508 (525) million;<br />
of this amount, EUR 204 million derived from assets under<br />
own management and EUR 304 million was attributable<br />
to amounts credited on deposits with ceding companies.<br />
Internal administrative expenses in life/health reinsurance<br />
amounted to EUR 119 million.<br />
Results within the bounds of expectations<br />
The operating profi t (EBIT) for the year under review totaled<br />
EUR 276 million. The previous year, which produced a record<br />
result of EUR 371 million, had been infl uenced by special<br />
eff ects associated with the acquisition of the US ING life<br />
reinsurance portfolio as well as fair value adjustments on<br />
reinsurance deposits in the US and UK. Our lean processes,<br />
quick decision-making structures and our focus on relevant<br />
client relationships in the context of a detailed CRM strategy<br />
are key factors in the effi ciency of our business model.<br />
Corporate Operations<br />
2010<br />
2009 2008 1) 2007 1) 2006 1)<br />
Figures in<br />
EUR million<br />
Net investment<br />
income –97 –56 –96 –67 –49<br />
EBIT –315 –26 –16 60 55<br />
1) The years prior to 2009 are of only limited comparability due to changes in<br />
segment allocation<br />
Along with <strong>Talanx</strong> AG, this Group segment essentially consists<br />
of the AmpegaGerling companies, the reinsurance broker<br />
Protection Reinsurance Intermediaries AG (Protection Re)<br />
and the Group’s internal service companies, namely <strong>Talanx</strong><br />
Service AG and the IT service provider – which will commence<br />
operational business in 2011. As a result of the restructuring<br />
within the <strong>Talanx</strong> Group the tasks assigned to the former<br />
HDI-Gerling Sach Serviceholding were reconfi gured. As<br />
<strong>Talanx</strong> Service AG, it now brings together the domestic<br />
central functions that do not relate directly to the insurance<br />
business, such as accounting, purchasing, facility management<br />
and human resources.<br />
AmpegaGerling – the investment specialist<br />
The “AmpegaGerling” brand encompasses both the asset<br />
management of the <strong>Talanx</strong> Group itself as well as asset<br />
management and funds provider activities aimed at institutional<br />
and private clients. The Asset Management GmbH,<br />
Investment GmbH and Immobilien Management GmbH are<br />
grouped together under this brand. In the course of the year,<br />
as part of the restructuring measures, AmpegaGerling Asset<br />
Management is to be renamed <strong>Talanx</strong> Asset Management<br />
and AmpegaGerling Immobilien Management will begin<br />
trading as <strong>Talanx</strong> Immobilien Management. AmpegaGerling<br />
Investment GmbH remains unaff ected by the rebranding and<br />
its products will continue to bear this name on the market<br />
going forward.<br />
AmpegaGerling Asset Management GmbH – in cooperation<br />
with the subsidiary AmpegaGerling Investment GmbH<br />
– is chiefl y responsible for handling the management and<br />
administration of Group companies’ securities portfolios and<br />
performs associated services such as investment bookkeeping<br />
and reporting. The company had assets under management<br />
of EUR 67.2 billion as at 31 December 2010, compared with a<br />
volume of EUR 59.9 billion at year-end 2009.<br />
As an investment company, AmpegaGerling Investment<br />
GmbH administers public and special funds and performs<br />
fi nancial portfolio management tasks for institutional clients.<br />
The emphasis is on portfolio management and the administration<br />
of investments for clients outside the Group. The<br />
company’s retail business fared highly successfully in 2010<br />
thanks to signifi cant cash infl ows of EUR 738 million. The<br />
volume of public funds grew by EUR 0.9 billion year-on-year<br />
to EUR 3.5 billion. The company was thus able to purposefully<br />
enlarge this strategic subsegment. While the industry as a<br />
whole posted growth of 12% in the volume of public funds in<br />
2010, AmpegaGerling generated a disproportionately vigorous<br />
increase of 33%. Looking at the sales trend in terms of
distribution channels and customer segments, administrative<br />
business with label funds for external fund initiators proved<br />
to be the most crucial success factor. Another key sales area is<br />
the Group’s own unit-linked business based on insurance policies<br />
of this type. In addition to retail business, the company<br />
engages in institutional business with third-party clients<br />
and – on the basis of its available know-how profi le – positions<br />
itself as an outsourcing partner for non-Group insurers.<br />
Existing mandates were enlarged by EUR 140 million in 2010.<br />
The total volume of assets under management grew to<br />
EUR 14.7 billion, an increase of 11% relative to the level at the<br />
beginning of the year (EUR 13.3 billion). Of this total volume,<br />
more than half – specifi cally EUR 8.0 (7.7) billion – was administered<br />
on behalf of Group companies through special funds<br />
and direct investment mandates. The remaining portion was<br />
attributable to institutional third-party clients in an amount<br />
of EUR 3.4 (3.3) billion and retail business in an amount of<br />
EUR 3.3 (2.3) billion. The latter is off ered both through the<br />
Group’s own sales channels and products such as unit-linked<br />
life insurance as well as through external asset managers and<br />
banks.<br />
Assets of EUR 1.2 (2.4) billion were attributable to AmpegaGerling<br />
Immobilien Management GmbH as at 31. December 2010. The<br />
contraction in assets resulted from the transfer of mortgage<br />
portfolios to HDI-Gerling Lebensversicherung AG.<br />
All in all, the volume of assets under management by all<br />
AmpegaGerling companies grew from EUR 75.5 billion to<br />
EUR 83.1 billion as at year-end 2010, of which EUR 74.5 billion<br />
was apportionable to Group companies and EUR 8.6 billion<br />
to business with third-party clients.<br />
Protection Re – intermediary for reinsurance cessions<br />
Protection Reinsurance Intermediaries AG (Protection Re),<br />
which is wholly owned by <strong>Talanx</strong> AG, is allocated to the Corporate<br />
Operations segment within the <strong>Talanx</strong> Group. In the<br />
course of the year Protection Re was also renamed and is now<br />
trading as <strong>Talanx</strong> Reinsurance Broker. The company serves as<br />
the professional reinsurance advisor and broker for reinsurance<br />
cessions (non-life business) of the <strong>Talanx</strong> Group. Its core<br />
Management report Business development<br />
business consists of providing primary insurers with comprehensive<br />
advice on all aspects of outward composite reinsurance.<br />
Protection Re handles the complete spectrum of the<br />
reinsurance business process for each Group cedant to the<br />
extent necessary in each particular case. From portfolio analysis<br />
and advising on the structuring of reinsurance programs<br />
to administration and run-off of the placed reinsurance<br />
arrangements, specialized teams develop and support viable<br />
solutions that help Group cedants to achieve their business<br />
objectives on a lasting basis.<br />
The reinsurance capacities required for all Group cedants<br />
served by Protection Re were again successfully obtained<br />
for 2011 on the world market. The operating profi t (EBIT) for<br />
2010 totaled EUR 8 (12) million. The branch of Protection Re<br />
that was established in 2009 in London specifi cally for the<br />
purpose of placing the business of German cedants with<br />
reinsurance companies outside the European Union fulfi lled<br />
the requirements placed on it in 2010 and contributed to the<br />
company’s good result.<br />
Segment result driven by <strong>Talanx</strong> AG<br />
The investment income and expenses in this segment<br />
encompass principally personnel and social expenditures<br />
for administration of the Group’s own investments and<br />
third-party portfolios. The amount recognized is therefore<br />
frequently negative, but this has no implications for the<br />
Group’s investment income. The latter is described below<br />
in the subsections entitled “Assets and shareholders’ equity”<br />
and “Financial position”. The operating result (EBIT) of<br />
–EUR 315 (–26) million for the segment is overshadowed<br />
this year by the defi cit posted by <strong>Talanx</strong> AG, which arose<br />
out of various contributions and provisions associated with<br />
indemnity commitments given to the segments <strong>Talanx</strong><br />
Deutschland and <strong>Talanx</strong> International. They are for the most<br />
part connected with the merger of Aspecta Lebensversicherung<br />
into HDI-Gerling Lebensversicherung as well as the<br />
cessation of ASPECTA’s new business activities in Luxembourg<br />
and Liechtenstein.<br />
55
56 <strong>Talanx</strong> Group Financial report 2010<br />
Assets and shareholders’ equity<br />
Assets<br />
The balance sheet structure of the <strong>Talanx</strong> Group is shaped<br />
by its character as a diversifi ed fi nancial services group<br />
and its activities as a globally operating insurance group.<br />
The dominant item on the assets side is the investments,<br />
which – excluding funds held by ceding companies (EUR 11.0<br />
billion) – accounted for 65% of total assets. They serve fi rst<br />
and foremost as security for the provisions constituted in<br />
insurance business, which – including provisions in the area<br />
Capital structure over a multi-year period<br />
of life insurance insofar as the investment risk is borne by<br />
<strong>policy</strong>holders – totaled EUR 72.5 billion. Over and above this,<br />
the most important sources of funding are the shareholders’<br />
equity (7% of the balance sheet total) and the issued subordinated<br />
debt (3% of the balance sheet total).<br />
Amount and composition of assets<br />
The assets of the Group are described on the basis of the following<br />
overview, which is based on the assets shown in the<br />
consolidated balance sheet.<br />
2010 2009 1) 2008 1)<br />
EUR million % EUR million % EUR million %<br />
Intangible assets 2,440 2 2,747 3 2,938 3<br />
Investments 83,422 75 76,385 75 69,466 74<br />
Investments for the account and risk of holders of<br />
life insurance policies 6,414 6 4,975 5 3,371 4<br />
Reinsurance recoverables on technical provisions 5,523 5 5,962 6 6,989 7<br />
Accounts receivable on insurance business 5,011 5 4,342 4 4,438 5<br />
Deferred acquisition costs 3,715 3 3,544 3 3,509 4<br />
Cash 1,265 1 1,685 2 1,408 1<br />
Deferred tax assets 268
Intangible assets<br />
The intangible assets shown in the balance sheet (EUR 2.4 billion)<br />
are attributable largely to insurance-related intangible<br />
assets arising out of the acquisition of past insurance portfolios<br />
(EUR 1.7 billion aft er EUR 2.0 billion in the previous year).<br />
In addition, a not insignifi cant amount of EUR 589 (593) million<br />
derived from acquired goodwill. In this context we would<br />
refer the reader to the explanatory remarks in the subsections<br />
of the Notes entitled “Goodwill” and “Other intangible<br />
assets”, pages 187 et seqq.<br />
The amortization to be taken on acquired insurance portfolios<br />
produces a charge to net income, to the extent that it is<br />
attributable to the shareholders’ portion, of EUR 152 million.<br />
The recognized insurance-related assets – in relation to the<br />
<strong>policy</strong>holders’ share – are opposed by corresponding provisions<br />
for premium refunds. In this context we would refer the<br />
reader to our explanatory remarks in the subsection of the<br />
Notes entitled “Other intangible assets”, pages 192 et seq.<br />
The balance sheet item “Technical provisions in the area of<br />
life insurance insofar as the investment risk is borne by <strong>policy</strong>holders”<br />
grew by EUR 1.4 billion in step with the increase<br />
in the item “Investments for the account and risk of holders<br />
of life insurance policies”, which is comprised of the investments<br />
relating to unit-linked insurance products. In the case<br />
of these life insurance products, under which <strong>policy</strong>holders<br />
themselves carry the investment risk, the technical liabilities<br />
refl ect the fair values of the corresponding assets.<br />
The subgroup Clarendon Insurance Group, Inc., Wilmington,<br />
of Hannover Rückversicherung AG in the Group segment<br />
of Non-Life Reinsurance, the sale of which is highly probable<br />
within one year, is recognized under the item “Assets<br />
of disposal groups classifi ed as held for sale”. The procedure<br />
is explained in greater detail in the subsection of the Notes<br />
entitled “Non-current assets held for sale and disposal<br />
groups”, pages 164 et seq.<br />
Management report Assets and shareholders’ equity<br />
Investment management and objectives<br />
Our investment management is geared to optimally resolving<br />
the confl icting interests of security, liquidity and return<br />
arising out of the principles of the Insurance Supervision Act<br />
by means of appropriate steering mechanisms.<br />
In this respect, the management of the <strong>Talanx</strong> Group’s assets<br />
follows a rigorous investment process, the goal of which is<br />
to defi ne an asset allocation in keeping with the risk-bearing<br />
capacity and earnings/return target of the individual company.<br />
The point of departure for the management of investments<br />
is the steering impetus delivered by the <strong>Talanx</strong> Group<br />
risk capital model, which determines the allocation of the<br />
available risk capital. Based on the risk capital released by the<br />
corresponding insurance enterprise for investment management,<br />
a company-specifi c asset allocation is developed which<br />
incorporates the specifi c requirements of the business model<br />
(cash fl ow structure and/or duration of the liabilities side,<br />
requirements for the holding of cash and for return contributions,<br />
etc.). The resulting optimal portfolio ensures a highest<br />
possible return in conformity with the set risk parameters.<br />
In the context of the rigorous investment process, the limits<br />
set by the legislator or internally defi ned are monitored<br />
through an extensive system of limits; the internally defi ned<br />
limits are derived chiefl y from the investment strategy and<br />
the conservative investment <strong>policy</strong> of the <strong>Talanx</strong> Group. It<br />
thus remains the case that more than 90% of instruments<br />
in the asset class of fi xed-income securities are rated “A” or<br />
better. A wide-ranging system designed to limit accumulation<br />
risks results in a balanced mix of assets, the risk-reducing<br />
aspects of which have also proven their worth during the<br />
Eurozone crisis.<br />
In addition to the framework conditions for asset management<br />
specifi ed in this way by the Group, the linkage of the<br />
underwriting portfolios on the liabilities side to the risk<br />
characteristics of the investments on the assets side gives<br />
rise to company-specifi c parameters (duration management,<br />
preserving of matching currencies) which are continuously<br />
monitored and as necessary adjusted. Oversteps and undershoots<br />
are reported on a same-day basis in order to facilitate<br />
57
58 <strong>Talanx</strong> Group Financial report 2010<br />
immediate defi nition of measures to rectify limit violations.<br />
In addition, thresholds are defi ned for signifi cant corporate<br />
performance indicators – upon attainment of which measures<br />
can be initiated in due time so as to avert at an early<br />
stage any possible jeopardizing of the performance indicators<br />
or goals. Covering the provisions constituted for our customers<br />
with assets at all times – measured both by book value<br />
and fair value – is always a focus of our activities, even in<br />
extreme market situations.<br />
Furthermore, multi-year liquidity planning shows the annual<br />
cash fl ows. The fi ne-tuning of our asset management makes<br />
allowance for the need to be able to meet the payment obligations<br />
existing within the Group at all times.<br />
Movements in investments<br />
Breakdown of the investment portfolio<br />
Figures in EUR million<br />
Funds held by ceding companies<br />
Assets under own management<br />
1) Adjusted on the basIS of IAS 8<br />
65,938 69,627 69,466 76,385 83,422<br />
8,173<br />
57,765<br />
8,055<br />
61,572<br />
7,242<br />
62,224<br />
9,349<br />
67,036<br />
2006 2007 1) 2008 1) 2009 1) 2010<br />
10,961<br />
72,461<br />
In 2010 the investment portfolio was boosted by a substantial<br />
EUR 7.0 billion to EUR 83.4 billion. The favorable trend in the<br />
asset volume, which was already emerging in the previous<br />
year, was thus sustained in 2010 with a rate of increase of<br />
9%. While the growth in funds held by ceding companies in<br />
2010 fell short of that recorded in 2009, the increase in the<br />
volume of assets under own management – at 8% – actually<br />
improved slightly on the previous year. This was principally<br />
due to cash infl ows from the underwriting business, which<br />
were reinvested in accordance with the existing asset structure.<br />
In 2010, too, fi xed-income assets continued to be the<br />
dominant investment class. The reinvestment of the income<br />
generated – particularly noteworthy here is the interest<br />
income from fi xed-income investments with a profi t contribution<br />
of EUR 2.6 billion in 2010 – also promoted continuous<br />
growth in the asset holdings.<br />
In addition to these infl uencing factors stemming from the<br />
original business, developments on the capital market also<br />
led to portfolio-increasing eff ects. Special mention should be<br />
made here of the decline in interest rates and the movement<br />
in the USD exchange rate: having listed at 1.44 as at 31 December<br />
2009, the USD stood at 1.34 to the euro on 31 December<br />
2010. An increase in value of almost EUR 2 billion in the USD<br />
holdings can be attributed to this eff ect.<br />
In compliance with all legal requirements and internal Group<br />
guidelines, the diversifi cation of the investment portfolio as<br />
at 31 December 2010 was very similar to year-end 2009 with<br />
slight tendencies in favor of fi xed-income securities.<br />
Breakdown of the investment portfolio<br />
%<br />
Other<br />
Real estate<br />
Funds held by ceding companies<br />
Equities and other variable-yield<br />
investments<br />
Fixed-income securities<br />
7<br />
2<br />
14 2<br />
75<br />
2009 2010<br />
7<br />
2<br />
13<br />
2<br />
76
The composition of the assets under own management recognized in the balance sheet is shown below.<br />
Breakdown of the assets under own management by asset classes<br />
2010 2009 1) Change<br />
EUR million % EUR million % EUR million %<br />
Investment property 860 1 726 1 134 19<br />
Investments in affiliated companies 74
60 <strong>Talanx</strong> Group Financial report 2010<br />
As a fundamental principle, however, the <strong>Talanx</strong> Group<br />
stands by its strategy of making new investments where possible<br />
in the category of “Loans and receivables” in order to<br />
reduce balance sheet volatility. Assets under the item “Loans<br />
and receivables” decreased by EUR 0.8 billion to EUR 32.3 billion.<br />
The reserves here increased to EUR 842 (667) million.<br />
Government bonds or instruments of similarly sound issuers<br />
continue to be the focus of our investments in fixedincome<br />
securities. At year-end 2010 they amounted to almost<br />
EUR 30.9 billion, corresponding to a share of 48% of the total<br />
volume of fi xed-income securities and loans.<br />
Rating of fixed-income securities<br />
%<br />
BBB or less<br />
A<br />
AA<br />
AAA<br />
The <strong>Talanx</strong> Group continues to pursue a conservative investment<br />
<strong>policy</strong>. For detailed information on the quality of our<br />
investments please see pages 177 et seqq. of the Notes.<br />
The funds withheld by ceding companies with respect to<br />
collateral furnished for the technical reserves of cedants in<br />
the Reinsurance segment climbed from EUR 9.3 billion at<br />
year-end 2009 to EUR 11.0 billion. Allowing for increased total<br />
asset holdings, this corresponds to a ratio of 13 (12)%.<br />
6<br />
21<br />
2008 2009 2010<br />
Equities and equity funds<br />
Overall, the equity portfolio held by the <strong>Talanx</strong> Group<br />
remained on a par with the previous year at EUR 1.7 billion,<br />
although appreciable movements in the portfolio were<br />
31<br />
42<br />
8<br />
18<br />
29<br />
45<br />
9<br />
19<br />
27<br />
45<br />
recorded within the year: in the fi rst quarter of 2010 strategic<br />
positions in the area of equities and equity funds were<br />
reduced, inter alia owing to higher costs for the renewal of<br />
hedges. A re-entry into tactical positions was executed only<br />
on a limited scale using defi ned stop loss strategies. For the<br />
most part, the second and third quarters did not see any<br />
major changes in the portfolio. It was only in the fourth quarter<br />
that the upturn on the market was used to implement<br />
re-entry programs. Special mention should be made here of<br />
the Reinsurance division, which has built up a fresh strategic<br />
asset allocation aft er moving out of equities in 2008.<br />
Relative to the total investment portfolio of the <strong>Talanx</strong><br />
Group, the equity allocation at year-end 2010 remained<br />
unchanged at around 2%. Since hedges were largely implemented<br />
using dynamic stop loss strategies and derivative<br />
instruments, the equity allocations before and aft er hedges<br />
diverge by only a few basis points (at fair values: gross 2.3%,<br />
net 2.2%).<br />
The net balance of unrealized gains and losses on holdings of<br />
equity securities within the Group classifi ed as available for<br />
sale (excluding other invested assets) amounted to +EUR 308<br />
(+349) million.<br />
Real estate including shares in real estate funds<br />
Investment property was held with a value of EUR 860 million.<br />
This is an increase of EUR 134 million relative to the previous<br />
year, corresponding to portfolio growth of 19%. Along<br />
with scheduled depreciation of EUR 15 million, impairments<br />
of EUR 6 million were taken in the year under review on the<br />
basis of market valuations. An amount of EUR 6 million was<br />
written off real estate funds held in the portfolio.<br />
The real estate allocation, which also includes investments in<br />
real estate funds, was unchanged at 2%.
Investment income<br />
Development of net investment income<br />
Figures in EUR million<br />
2010 2009 Change<br />
Ordinary investment<br />
income 2,782 2,607 175<br />
thereof current<br />
income from<br />
interest 2,616 2,457 159<br />
thereof profit/loss<br />
from shares in associated<br />
companies 2 –6 8<br />
Realized net gains on<br />
investments 385 236 149<br />
Write-ups/write-downs<br />
on investments –78 –332 254<br />
Unrealized net gains/<br />
losses on investments –12 52 –64<br />
Other investment<br />
expenses 180 145 35<br />
Income from investments<br />
under own<br />
management 2,897 2,418 479<br />
Interest income on<br />
funds withheld and<br />
contract deposits 280 240 40<br />
Net investment income 3,177 2,658 519<br />
The net investment income for the year under review of<br />
EUR 3.2 billion surpassed the previous year’s level by 19.5%.<br />
While current income from interest was again the main<br />
driver in 2010, its share of total investment income declined<br />
from 92% to 82%. This can be attributed to the higher realized<br />
net gains as well as lower write-down requirements,<br />
which on balance contributed EUR 403 million more to<br />
investment income than in the previous year. The unrealized<br />
net gains deteriorated, on the other hand, by EUR 64 mill ion<br />
to –EUR 12 million. Interest income and expenses on funds<br />
withheld and contract deposits totaled EUR 280 (240) million.<br />
The increase in ordinary investment income – in this case<br />
excluding income from funds held by ceding companies –<br />
to EUR 2,616 million (+EUR 159 million) went hand-in-hand<br />
with the growth in the volume invested in fi xed-income securities.<br />
While this portfolio increased by almost 9%, however,<br />
the income interest showed a rise of just 6%. Along with the<br />
fact that some investments were only completed in the<br />
course of the year and their infl uence on profi tability was<br />
Management report Assets and shareholders’ equity<br />
not fully felt in 2010, the portfolios for investment had to<br />
be newly purchased on the capital market at lower returns<br />
as a consequence of the low interest rate level. Forward purchases<br />
were made as part of the hedging of the reinvestment<br />
risk – especially in the case of the life insurers operating in<br />
the Retail Germany segment. On the fi nancial implications<br />
see item 12 of the Notes “Derivative fi nancial instruments<br />
and hedge accounting”, pages 207 et seqq. of the Notes.<br />
The average coupon of the portfolio of fi xed-income securities<br />
remained virtually unchanged in the 2010 fi nancial<br />
year at 4.1 (4.2)%.<br />
Whereas the aft er-eff ects of the fi nancial market crisis had<br />
still been very heavily refl ected in write-downs taken on<br />
both equities and fi xed-income securities in the 2009 fi nancial<br />
year, a marked recovery was recorded in 2010. Impairments<br />
of EUR 45 (112) million were taken on equities; the<br />
impairments on fixed-income positions amounted to<br />
EUR 17 (101) million. Owing to bailout mechanisms existing<br />
on the European level (so-called Eurozone safety net), no<br />
default risk that would justify taking an impairment loss<br />
existed with respect to bonds issued by the PIIGS quintet<br />
of countries; decreases in value were therefore considered<br />
temporary and impairments were almost entirely avoided.<br />
The write-downs were opposed by write-ups of EUR 37 million<br />
that resulted from the reversal of impairments taken<br />
on instruments in prior years.<br />
The net gains realized on investments totaled EUR 385 million<br />
at the end of 2010. The low level of interest rates was<br />
used by many units to realize the reserves consequently<br />
inherent in fi xed-income assets, as a result of which the<br />
total amount of realized gains and losses from sales of fi xedincome<br />
investments surpassed the net gains recorded in the<br />
previous year by a comfortable EUR 149 million.<br />
The net investment income generated in 2010 is shown<br />
below broken down into Group segments. All segments<br />
show a signifi cant recovery in profi tability, which can be<br />
attributed chiefl y to the fact that impairment items have<br />
returned to a normal level.<br />
61
62 <strong>Talanx</strong> Group Financial report 2010<br />
Breakdown of net investment income by Group segments 1)<br />
Figures in EUR million<br />
2009 2)<br />
2010<br />
231 224<br />
Industrial<br />
Lines<br />
1,245<br />
1,610<br />
Retail<br />
Germany<br />
126 154<br />
782<br />
601<br />
Retail<br />
International Non-Life<br />
Reinsurance<br />
1) Presentation aft er elimination of intra-Group relations<br />
2) Figures for the previous year adjusted on the basis of modifi ed segment<br />
reporting pursuant to IFRS 8<br />
The investment income reported by the Group segment of<br />
Corporate Operations consists principally of the costs of<br />
managing all assets – both the Group’s own and third-party<br />
holdings.<br />
Off -balance sheet fi nancing instruments<br />
517 502<br />
Life/Health<br />
Reinsurance<br />
–62 –95<br />
Corporate<br />
Operations<br />
The <strong>Talanx</strong> Group enters into various commitments. Of<br />
material signifi cance in this context to the assessment of its<br />
assets are letters of credit and trust accounts put up as security<br />
for technical liabilities (EUR 5,727 million), guarantee payments<br />
under issued subordinated bonds (EUR 2,131 million),<br />
blocked custody accounts and other trust accounts (EUR 1,902<br />
mil lion), outstanding commitments under existing capital<br />
Capital structure over a multi-year period<br />
participations (EUR 553 million), obligations under §§ 124 et<br />
seq. of the Insurance Supervision Act (VAG) as a member of<br />
the Security Fund for Life Insurers (EUR 372 million) and commitments<br />
arising out of rental/lease agreements (EUR 492 mil -<br />
lion). In addition, there were “Other liabilities” of EUR 796 mil -<br />
lion as at 31 December 2010.<br />
Furthermore, the <strong>Talanx</strong> Group is subject to contingent<br />
liabilities due to its involvement in court proceedings and<br />
arbitration procedures. All these liabilities are set out in the<br />
subsections of the Notes entitled “Other information – Contingent<br />
liabilities and other fi nancial commitments” on<br />
pages 251 et seq. and “Other information – Rents and<br />
leases” on page 253.<br />
Financial position<br />
The capital structure and composition of the liabilities of the<br />
<strong>Talanx</strong> Group are shaped by its primary insurance and reinsurance<br />
business. The technical provisions, which in accordance<br />
with the requirements of regulators are to be covered<br />
by assets, account for the largest share. In addition, the Group<br />
fi nances itself most notably through shareholders’ equity as<br />
well as through subordinated debt and liabilities, which also<br />
represent our most important sources of funds.<br />
The fi nancial position of the Group is illustrated by the<br />
following overview, which we have based on the liabilities<br />
shown in the consolidated balance sheet.<br />
2010 2009 1) 2008 1)<br />
EUR million % EUR million % EUR million %%<br />
Shareholders' equity 7,991 7 7,153 7 5,718 6<br />
Subordinated liabilities 2,791 3 2,003 2 2,074 2<br />
Technical provisions – gross 77,778 70 73,531 72 69,612 74<br />
Technical provisions in the area of life insurance insofar as the<br />
investment risk is borne by <strong>policy</strong>holders 6,414 6 4,975 5 3,371 4<br />
Other provisions 2,751 2 2,644 3 2,416 3<br />
Liabilities 10,829 10 9,750 10 9,625 10<br />
Provisions for deferred taxes 1,433 1 1,509 1 1,377 2<br />
Debts of disposal groups classified as held for sale 1,381 1 — — — —<br />
Total liabilities 111,368 100 101,565 100 94,193 100<br />
1) Adjusted on the basis of IAS 8
Currency eff ects<br />
Currency-related interdependencies inevitably exist between<br />
the assets and fi nancial position in view of the international<br />
orientation of the insurers brought together in the <strong>Talanx</strong><br />
Group.<br />
In principle, however, the internationally operating insurers<br />
normally receive payments and reimburse claims in their<br />
respective national currency. This means that assets to cover<br />
liabilities are also held in foreign currencies. Matching currency<br />
coverage is required for this purpose. In this regard we<br />
would refer the reader to our remarks in the risk report. For<br />
the purposes of the consolidated fi nancial statement the relevant<br />
national currencies are presented as explained in the<br />
Notes under “Accounting policies – Currency translation” on<br />
pages 142 et seq.<br />
Development of major items<br />
In the fi nancial year just-ended the shareholders’ equity<br />
in creased by EUR 838 million – or 12% – to EUR 7,991 (7,153) mil -<br />
lion. The Group’s share amounted to EUR 4,956 (4,574) million.<br />
Through the issue of two subordinated bonds the volume of<br />
subordinated liabilities grew by 39% relative to the previous<br />
year to reach EUR 2.8 billion.<br />
A new subordinated debt with a nominal value of EUR 500 million<br />
was placed by Hannover Rückversicherung AG through<br />
its subsidiary Hannover Finance (Luxembourg) S. A. along<br />
with another bond of nominally EUR 300 million placed by<br />
<strong>Talanx</strong> AG, Hannover. The features of the bonds are described<br />
in the subsection of the report entitled “Analysis of debt” as<br />
well in the remarks on item 17 of the Notes “Subordinated<br />
liabilities” on pages 216 et seq.<br />
In addition, a line of credit is available to <strong>Talanx</strong> AG with a<br />
volume of nominally EUR 1.5 billion, of which – as in the previous<br />
year – an amount of EUR 550 million was utilized. The<br />
available fl oating-rate loan has a term ending at the latest on<br />
31 July 2012.<br />
With respect to further loan agreements and letters of credit<br />
we would refer the reader to the presentation of off -balance<br />
sheet fi nancial instruments as well as the explanatory remarks<br />
in the Notes on page 186.<br />
The provisions connected with the insurance business aft er<br />
consolidation can be broken down as follows:<br />
Figures in EUR billion<br />
2010 2009 1) 2008<br />
Benefit reserve 42.5 39.8 36.4<br />
Loss and loss adjustment<br />
expense<br />
reserve 28.5 27.3 27.2<br />
Unearned premium<br />
reserve 5.4 5.0 4.9<br />
Provision for<br />
premium refunds 1.1 1.2 0.9<br />
Other technical<br />
provisions 0.3 0.2 0.2<br />
Total 77.8 73.5 69.6<br />
1) Adjusted on the basis of IAS 8<br />
Aft er allowance for the shares of reinsurers, the breakdown<br />
is as follows:<br />
Figures in EUR billion<br />
2010 2009 1) 2008<br />
Benefit reserve 41.5 39.0 35.5<br />
Loss and loss adjustment<br />
expense<br />
reserve 24.5 22.5 21.7<br />
Unearned premium<br />
reserve 5.0 4.6 4.5<br />
Provision for<br />
premium refunds 1.1 1.2 0.9<br />
Other technical<br />
provisions 0.3 — —<br />
Total 72.4 67.3 62.6<br />
1) Adjusted on the basis of IAS 8<br />
Management report Assets and shareholders’ equity<br />
63
64 <strong>Talanx</strong> Group Financial report 2010<br />
In this respect, the existing liabilities to <strong>policy</strong>holders are<br />
to be covered by assets in at least the same amount. The<br />
proportion of net provisions connected with the insurance<br />
business relative to the total assets as at the balance sheet<br />
date – including funds held by ceding companies – stood at<br />
87 (88)%. Surplus coverage of the provisions thus exists in an<br />
amount of EUR 11.0 (9.0) million.<br />
The provisions are available to the Group in accordance<br />
with the corresponding time to maturity. We would refer the<br />
reader here to the presentation of maturities – especially of<br />
the benefi t reserve and the loss and loss adjustment expense<br />
reserve (see the Notes, item 19 “Benefi t reserve” and item 20<br />
“Loss and loss adjustment expense reserve”, pages 218 and<br />
219 et seqq.).<br />
The gross amounts of the technical liabilities aft er consolidation<br />
are crucially determined by the benefi t reserve and the<br />
loss and loss adjustment expense reserve. As at the balance<br />
sheet date 55 (55)% of the total provisions were attributable to<br />
the benefi t reserves.<br />
The gross provisions (aft er consolidation) were divided as follows<br />
among the segments:<br />
Figures in EUR million<br />
Benefit<br />
reserve<br />
Loss and loss<br />
adjustment<br />
expense reserve<br />
2010 2009 2010 2009<br />
Industrial Lines — — 7,746 7,388<br />
Retail Germany 32,311 30,899 2,695 2,772<br />
Retail International 1,752 1,527 1,130 936<br />
Non-Life Reinsurance — — 14,577 14,163<br />
Life/Health Reinsurance 8,403 7,328 2,390 1,991<br />
Corporate Operations — — — 6<br />
Total 42,466 39,754 28,538 27,256<br />
The benefi t reserve is a mathematically calculated value for<br />
future liabilities (present value of future obligations less the<br />
present value of future incoming premiums), above all in life<br />
insurance.<br />
Altogether, the gross provisions increased by 6% or EUR 4.3 bil -<br />
lion relative to the previous year. This growth was driven<br />
largely by the rise in the benefi t reserve (+7% or EUR 2.7 billion)<br />
and in the loss and loss adjustment expense reserve<br />
(+5% or EUR 1.3 billion).<br />
The increase in the benefi t reserve can be attributed to the<br />
natural aging of the in-force portfolios as well as pleasing<br />
organic growth. Of the total increase of EUR 2.7 billion,<br />
EUR 1.4 bill ion was apportionable to the Retail Germany<br />
segment and EUR 1.0 billion to the Life/Health Reinsurance<br />
segment.<br />
The rise in the loss and loss adjustment expense reserve<br />
resulted from higher claims burdens in all primary insurance<br />
segments. In relation to Non-Life Reinsurance a modest<br />
decrease from 73% to 72% was observed.
Disposal groups<br />
We recognized the planned sale of the US subgroup Clarendon<br />
Insurance Group, Inc., Wilmington, to Enstar Group Ltd.,<br />
Hamilton, Bermuda, in the Non-Life Reinsurance segment<br />
in accordance with IFRS 5 “Non-current Assets Held for Sale<br />
and Discontinued Operations” in the year under review. The<br />
assets and liabilities attributable to the disposal group are<br />
presented unoff set.<br />
For further details please see our explanatory remarks in the<br />
section of the Notes entitled “Non-current assets held for sale<br />
and disposal groups” on pages 164 et seq.<br />
Off -balance sheet transactions<br />
Contingent liabilities exist as described on page 251 of<br />
the Notes.<br />
Asset/liability management<br />
The structure of our technical provisions and other liabilities<br />
essentially establishes the basis for the <strong>Talanx</strong> Group’s investment<br />
strategy. The focus here is on asset/liability management:<br />
changes in the value of investments should as far as<br />
possible off set changes in the technical liabilities and requirements<br />
on the liabilities side. This stabilizes our positions<br />
against fl uctuations on capital markets.<br />
To this end we refl ect important properties of the liabilities<br />
such as the maturity and currency structure – as well as the<br />
infl ation sensitivity – on the assets side by acquiring, wherever<br />
possible, investments that respond in a similar manner.<br />
In this regard we would also refer the reader to our remarks<br />
in the risk report from page 83 onwards.<br />
The duration (average period of capital commitment) of the<br />
entire investment portfolio of fi xed-income securities held<br />
within the <strong>Talanx</strong> Group has been maintained on a stable<br />
level at 5.5 years since the end of 2009. The duration management<br />
of the individual segments is guided by the needs<br />
arising out of the underwriting business. Thus, for example,<br />
the asset duration in the Retail Germany division (7 years) is<br />
relatively long compared to that of the Industrial Lines division<br />
(3.4 years) in order to satisfy the capital commitment<br />
period, especially with respect to life insurance products. The<br />
assets-side duration is reconciled with the requirements of<br />
the liabilities side at regular intervals between the insurance<br />
carriers and AmpegaGerling.<br />
With an eye to matching currency coverage USD-denominated<br />
investments continue to account for the lion’s share<br />
– at 14% – of the foreign currency portfolio within the <strong>Talanx</strong><br />
Group. Sizeable positions are also held in GBP and AUD,<br />
although in total they do not account for more than 5% of<br />
all assets.<br />
An infl ation swap was taken out by the Hannover Re subgroup<br />
to hedge the infl ation risk. This derivative fi nancial<br />
instrument is intended to hedge the loss reserves against<br />
infl ation risks.<br />
We also use derivative fi nancial instruments in order to structure<br />
asset management activities as eff ectively as possible<br />
(see here our remarks in subsection 12 of the Notes entitled<br />
“Derivative fi nancial instruments and hedge accounting”,<br />
pages 207 et seqq.).<br />
Management report Assets and shareholders’ equity<br />
65
66 <strong>Talanx</strong> Group Financial report 2010<br />
Capital management<br />
Capital management process<br />
Bringing transparency<br />
to the actual<br />
capitalization<br />
Determining the<br />
required capital<br />
Optimizing the<br />
required capital<br />
Optimizing the<br />
capital structure<br />
Implementing<br />
capital measures<br />
Capital management is based on a process geared to optimizing the steering and use of capital within the Group<br />
that is structured according to clear guidelines and workflows.<br />
Eff ective and effi cient capital management is a vital component<br />
of the Group’s holistic set of management tools. We<br />
diff erentiate between three fundamental capital concepts:<br />
“Company’s Capital”, “Risk-Based Capital” and “Excess Capital”.<br />
We refer to the company’s capital as the economic capital<br />
available in a business unit that is allocated to the shareholder.<br />
It is composed of the IFRS shareholders’ equity and<br />
the so-called soft capital. We count as soft capital, which<br />
includes unrealized gains/losses on the assets and liabilities<br />
sides aft er taxes, inter alia the loss reserve discount, a level<br />
of overreserving in property/casualty insurance that goes<br />
beyond best estimate reserving, the non-capitalized value of<br />
in-force business in life insurance and life/health reinsurance<br />
and the unrealized gains/losses in the asset category<br />
of “loans and receivables”. In the context of our value-based<br />
management the company’s capital serves as a basis for<br />
establishing the cost of capital as well as the shareholder’s<br />
return expectation above and beyond the cost of capital<br />
(cf. also the explanation of xRoCC on pages 33 and 35).<br />
Risk-based capital is the amount of capital required for<br />
operation of the insurance business in order to ensure that<br />
the probability of capital erosion is less than 0.03% (cf. risk<br />
report). This confi dence level corresponds to a 99.97% Value<br />
at Risk. The capital required for this purpose is calculated for<br />
the primary insurance companies on the basis of the <strong>Talanx</strong><br />
risk capital model.<br />
Excess capital is the residual of the company’s capital and<br />
risk-based capital; it thus consists of capital that is not at<br />
risk. Since it is not required for coverage of business risks and<br />
insofar as it also cannot be utilized for additional risk carrying,<br />
it can be withdrawn without overstraining the risk-bearing<br />
capacity. The ratio of company’s capital and risk-based<br />
capital further indicates the capital adequacy. Given that<br />
excess capital is a component of company’s capital, it does<br />
not contain any borrowed funds whatsoever but is instead<br />
directly allocable to the shareholder. There are, however,<br />
restrictions on the repatriation of excess capital associated<br />
with both regulatory/legal considerations and rating requirements.<br />
The general goal of capital management within the <strong>Talanx</strong><br />
Group – an optimized risk-appropriate capital structure of<br />
the Group – is explicitly anchored in the strategy ( pages 30<br />
et seqq.). In addition to satisfying legal requirements and the<br />
capital requirements of rating agencies, the capital allocation<br />
within the Group is therefore also – as a collateral condition<br />
– systematically guided by risk-return aspects and the target<br />
portfolio to which <strong>Talanx</strong> aspires. In this way investments<br />
are channeled into preferred growth markets/business segments,<br />
also with an eye to considerations of diversifi cation.
A central task of capital management therefore lies in<br />
identifying the capital that exceeds the required risk-based<br />
capital on the defi ned confi dence level or – in the opposite<br />
case – that falls short of this level. The Value at Risk defi nes<br />
the estimated maximum loss that with a specifi ed probability<br />
will not be exceeded within a specifi ed holding period.<br />
In the event of over- or undercapitalization, the next step is<br />
to rectify or at least alleviate it by taking appropriate corrective<br />
actions. In the case of signifi cant overcapitalization at<br />
the company level, for example, capital management measures<br />
may be geared to systematically reducing free excess<br />
capital in order to allocate it to more effi cient reinvestment<br />
elsewhere within the Group. Our stated aim is to achieve the<br />
most effi cient possible utilization of our capital while at the<br />
same time ensuring appropriate capital adequacy and making<br />
allowance for the eff ects of diversifi cation.<br />
Another major objective is the substitution of shareholders’<br />
equity with equity surrogates such as hybrid capital, which<br />
positively aff ects the capital structure of the Group as well<br />
as the ability of <strong>Talanx</strong> AG to make own funds available to<br />
the operational units.<br />
By optimizing the Group’s capital structure, our capital management<br />
safeguards the adequacy of our capital resources<br />
both from a rating standpoint and in light of solvency and<br />
economic considerations. At the same time, it ensures that<br />
the return on the invested capital can be generated for shareholders<br />
on a sustainable basis in accordance with the <strong>Talanx</strong><br />
strategy. Not only that, the capital structure must continue to<br />
facilitate action on organic and inorganic growth opportunities<br />
at both the Group and company level and it must off er<br />
the certainty that volatilities on the capital markets and in<br />
insurance business can be absorbed without undershooting<br />
the desired confi dence level. The effi cient handling of capital<br />
resources is a crucial indicator for existing and potential<br />
investors that <strong>Talanx</strong> utilizes the capital made available to it<br />
in a responsible and effi cient manner.<br />
The Group steering function of capital management thus<br />
enables us to<br />
■<br />
■<br />
■<br />
create transparency as to the actually available<br />
( company’s) capital,<br />
specify the required risk-based capital and coordinate the<br />
calculation thereof, and<br />
optimize the capital structure, implement financing<br />
measures and support all structural changes that have<br />
implications for the required capital.<br />
Shareholders’ equity<br />
Strategic equity targets<br />
Within the scope of the communicated profi t targets the<br />
<strong>Talanx</strong> Group sets itself the goal of generating a continuous,<br />
above-average increase in the value of the invested capital<br />
that takes account of the risk position.<br />
■<br />
■<br />
We strive to rank among the five most profitable of the<br />
20 largest European insurance groups, measured by the<br />
IFRS return on equity.<br />
Our Group’s minimum target in relation to consolidated<br />
net income after taxes and before minority interests is an<br />
IFRS return on equity of 750 basis points above the average<br />
risk-free interest rate. This is defined as the average<br />
market interest rate over the past five years for 10-year<br />
German government bonds.<br />
The equity ratio, defi ned as the sum total of the equity components<br />
relative to total assets, has changed as follows:<br />
2010 2009 1) 2008 1) 2007 1)<br />
Total equity as<br />
shown in the<br />
balance sheet<br />
thereof<br />
EUR million 7,991 7,153 5,718 6,163<br />
minorities EUR million 3,035 2,579 2,092 2,431<br />
Total assets EUR million 111,368 101,565 94,193 95,395<br />
Equity ratio % 7.2 7.0 6.1 6.5<br />
1) Adjusted on the basIS of IAS 8<br />
Management report Assets and shareholders’ equity<br />
67
68 <strong>Talanx</strong> Group Financial report 2010<br />
Allowing for equity components recognized by regulators<br />
such as subordinated liabilities, the modifi ed equity ratio was<br />
as follows:<br />
2010 2009 1)<br />
Regulatory capital EUR million 1,469 1,117<br />
Modified equity ratio % 8.5 8.1<br />
1) Adjusted on the basIS of IAS 8<br />
The return on equity, defi ned as the result for the period<br />
excluding minority interests in relation to the average equity<br />
excluding minority interests, has changed as follows:<br />
2010 2009 1) 2008 1) 2007<br />
Net income 2) EUR million 220 485 183 477<br />
Return on equity % 4.6 11.8 5.1 13.1<br />
Risk-free<br />
interest rate % 3.5 3.6 3.7 3.9<br />
Target value % 11.0 11.1 11.2 11.4<br />
Performance % –6.4 0.7 –6.1 1.7<br />
1) Adjusted on the basIS of IAS 8<br />
2) Net income excluding minorities<br />
In this context, the performance represents the over- or<br />
underfulfi llment of the target value. In the years 2009 and<br />
2007 we accomplished the goals that we had set ourselves.<br />
The profi tability of the <strong>Talanx</strong> Group was crucially impacted<br />
in the 2008 fi nancial year by the worldwide fi nancial market<br />
crisis and the associated slump on equity markets. The consequences<br />
of this crisis on international capital markets were a<br />
considerable drag on net income.<br />
With regard to developments in the current fi nancial year,<br />
please see our remarks in the section entitled “Business<br />
development” on pages 41 et seqq.<br />
Movements in shareholders’ equity<br />
The major movements in shareholders’ equity were driven by<br />
the following factors:<br />
The Group net income apportionable to our shareholders<br />
contracted sharply by 55% to EUR 220 (485) million and was<br />
allocated in full to retained earnings.<br />
“Cumulative other comprehensive income and other reserves”<br />
increased by a substantial 85% year-on-year to EUR 388 million.<br />
Crucial to this growth was, fi rst and foremost, the rise in<br />
gains/losses from currency translation (+EUR 144 million) as<br />
well as in the other changes in shareholders’ equity (+EUR 279<br />
million; principally changes in <strong>policy</strong>holder participation/<br />
shadow accounting). The increase of the gains/losses from<br />
currency translation was driven in particular by the appreciation<br />
of the US dollar against the euro. The “gains/losses on<br />
investments” moved in opposite directions. The unrealized<br />
gains/losses on investments declined on balance by EUR 174<br />
million to EUR 522 (696) million. The cash fl ow hedge reserve<br />
decreased appreciably to –EUR 123 (–23) million.<br />
The minority interests in shareholders’ equity increased by<br />
EUR 456 million – or 18% – to EUR 3.0 billion. The minority<br />
interest in net income amounted to EUR 615 (491) million.<br />
The dividends paid to non-Group shareholders, principally<br />
from the Hannover Re Group, produced an opposing eff ect<br />
in an amount of EUR 162 million.<br />
Changes in shareholders’ equity<br />
Figures in EUR million<br />
Common shares<br />
Additional paid-in capital<br />
Retained earnings<br />
Cumulative other comprehensive income (other reserves)<br />
Minority interest in shareholders’ equity<br />
630<br />
260<br />
6,163 5,718<br />
7,153<br />
7,991<br />
3,474<br />
3,678<br />
2,799<br />
2,977<br />
3,035<br />
2,431<br />
2,579<br />
2,092<br />
43<br />
2007 1)<br />
630<br />
260<br />
1) Adjusted on the basIS of IAS 8<br />
–241<br />
2008 1)<br />
630<br />
260 210<br />
2009 1)<br />
630<br />
260<br />
2010<br />
388
Valuation reserves not recognized in the balance sheet<br />
The unrecognized valuation reserves shown in the following<br />
table make no allowance for technical liabilities. The valuation<br />
reserves are attributable principally – in an amount of<br />
EUR 842 (667) million – to loans and receivables. Please see<br />
our remarks in the Notes on the items “Investment property”,<br />
“Loans and receivables”, “Financial assets held to maturity”,<br />
“Other assets” and “Subordinated liabilities”.<br />
Figures in EUR billion<br />
2010 2009 1) 2008 1) 2007 1)<br />
Group shareholders'<br />
equity 8.0 7.1 5.7 6.2<br />
Valuation reserves not<br />
recognized in the balance<br />
sheet before taxes,<br />
including the shares<br />
of <strong>policy</strong> holders and<br />
minority interests 1.2 1.1 1.6 –1.2<br />
1) Adjusted on the basIS of IAS 8<br />
Liquidity and fi nancing<br />
We generate liquidity primarily from our operational insurance<br />
and reinsurance business, the current income on our<br />
investments and from fi nancing measures. Through regular<br />
liquidity planning and an investment strategy geared inter<br />
alia to liquidity requirements, we ensure that the <strong>Talanx</strong><br />
Group is able to make the necessary payments at all times.<br />
Liquidity shortages consequently did not arise.<br />
Analysis of the consolidated cash fl ow statement<br />
In the case of the <strong>Talanx</strong> Group the consolidated cash fl ow<br />
statement can be regarded as having minimal informational<br />
value. The Group’s cash fl ow is shaped fi rst and foremost by<br />
the business model of an insurer and reinsurer. Normally, we<br />
fi rst receive premiums for the agreed risk acceptance in order<br />
to be able to make payments at a later date in the event of a<br />
claim. Until such time we invest the funds in interest-bearing<br />
instruments and thus earn current income from our investments.<br />
For us, therefore, the cash fl ow statement is not a substitute<br />
for either liquidity planning or fi nancial planning, nor<br />
is it used as a management tool.<br />
The cash fl ows are shown in full in the cash fl ow statement<br />
on page 113; they are presented in summary form in the<br />
table below:<br />
Figures in EUR million<br />
2010 2009 1)<br />
Cash flow from operating activities 4,584 5,472<br />
Cash flow from investing activities –5,586 –5,072<br />
Cash flow from financing activities 553 –129<br />
Change in cash<br />
and cash equivalents –449 271<br />
1) Adjusted on the basis of IAS 8<br />
Management report Assets and shareholders’ equity<br />
The cash fl ow from operating activities, which also includes<br />
infl ows from the generated investment income, fell sharply<br />
year-on-year to EUR 4,584 (5,472) million. The calculation<br />
adjusts the net income of EUR 670 (893) million in the consolidated<br />
cash fl ow statement to allow for the increase in<br />
the technical provisions (net perspective) (EUR 3.9 billion).<br />
The most notable factor in this development was the signifi<br />
cant rise in the benefi t reserves, especially in the Retail<br />
Germany and Life/Health Reinsurance segments (see here<br />
also our explanatory remarks in the section describing the<br />
fi nancial position). The appreciable decrease with respect to<br />
the “Changes in funds held and in accounts receivable and<br />
payable” in an amount of –EUR 1.2 billion is off set by the<br />
“Changes in other non-cash expenses and income as well as<br />
adjustments to net income”. The changes in funds held result<br />
from the furnishing of collateral by reinsurers. Please see the<br />
comments on the development of investments.<br />
The cash outfl ow from investing activities is determined by<br />
payments made to purchase investments. As in the previous<br />
year, the outfl ows associated with the purchase of investments<br />
amounting to EUR 4.2 (2.7) billion exceeded the infl ows<br />
from sales and maturities. In addition, there were “Changes<br />
in investments for the account and risk of holders of life<br />
insurance policies” totaling EUR 1.4 (1.6) billion. Of these cash<br />
outfl ows, an amount of EUR 1.2 billion derived from increased<br />
investments in these assets in the Retail Germany segment.<br />
69
70 <strong>Talanx</strong> Group Financial report 2010<br />
The cash infl ow from fi nancing activities was shaped in the<br />
year under review by the “Net changes from other fi nancing<br />
activities” amounting to EUR 719 (–123) million. The increase<br />
was attributable above all to the issue of subordinated<br />
bonds as well as to the bank borrowings and notes payable.<br />
The dividends paid in the year under review climbed by<br />
EUR 144 mil lion year-on-year to EUR 162 million. Cash infl ows<br />
from fi nancing activities increased by EUR 682 million on<br />
balance.<br />
Cash and cash equivalents were reduced by altogether<br />
EUR 420 million in the year under review to EUR 1.3 billion.<br />
An amount of EUR 27 million was deducted from the cash<br />
and cash equivalents for disposal groups pursuant to IFRS 5.<br />
For further information on our liquidity management please<br />
see the section of the risk report on the liquidity risk, page 93.<br />
Financing<br />
Along with the assets available to cover provisions and liabilities,<br />
the Group has at its disposal the following additional lines<br />
of credit that can be drawn upon as required:<br />
Unsecured letter of credit facilities with various terms (maturing<br />
at the latest in 2017) and a total volume equivalent to<br />
EUR 1,207 million (EUR 802 million) exist on a bilateral basis<br />
with fi nancial institutions.<br />
In the Life/Health Reinsurance and Non-Life Reinsurance segments<br />
facilities exist with various fi nancial institutions for<br />
letters of credit, including two syndicated guarantee facilities<br />
from 2005 and 2006. Following the contractual maturity<br />
of the fi rst half of the line from 2005 in January 2010, it<br />
amounted to an equivalent of EUR 755 (1,395) million as at the<br />
balance sheet date. The other half of this line matures in January<br />
2012. The line from 2006, the amount of which as at the<br />
balance sheet date was equivalent to EUR 1,509 (1,395) million,<br />
matures in January 2013.<br />
Furthermore, a long-term unsecured line of credit with a<br />
total volume equivalent to at most EUR 566 (523) million was<br />
concluded in December 2009. It is intended specifi cally for<br />
US life reinsurance business. For further information on the<br />
letters of credit provided please see our explanatory remarks<br />
in the item of the Notes entitled “Other information – Contingent<br />
liabilities and other fi nancial commitments”, pages<br />
251 et seq.<br />
A number of LoC facilities include standard market clauses<br />
that grant rights of cancellation to the banks in the event of<br />
material changes in our shareholding structure or trigger a<br />
requirement on the part of Hannover Re to furnish collateral<br />
upon materialization of major events, for example if our rating<br />
is signifi cantly downgraded.<br />
Further information on our liquidity management is provided<br />
in the subsection of the risk report concerning liquidity risks.<br />
Analysis of debt<br />
With the aim of optimizing the capital structure, our subordinated<br />
bonds and debentures (abbreviated to: subordinated<br />
debt) complement our shareholders’ equity and help<br />
to ensure liquidity at all times. We refer to this subordinated<br />
debt and other bank borrowings that serve to fi nance corporate<br />
acquisitions as “strategic debt”.<br />
<strong>Talanx</strong> AG has concluded a fi rm agreement with a broad<br />
consortium of banks regarding an available fl oating-rate line<br />
of credit that may be drawn upon as necessary. At the end<br />
of 2009 we had used one tranche amounting to altogether<br />
EUR 550 million. The nominal amount of the line of credit<br />
was EUR 1.5 billion as at the balance sheet. The line of credit<br />
matures at the latest in 31 July 2012 and can be called at three<br />
months’ notice. Furthermore, several Group companies have<br />
taken up long-term debt – principally in the form of mortgage<br />
loans – amounting to EUR 188 (116) million.<br />
On 14 September 2010 Hannover Re placed a new subordinated<br />
bond on the European capital market through its<br />
subsidiary Hannover Finance (Luxembourg) S. A. This subordinated<br />
debt with a nominal value of EUR 500 million has a<br />
maturity of 30 years with a fi rst scheduled call option aft er<br />
ten years. The bond carries a fi xed coupon of 5.75% p.a. in<br />
the fi rst ten years, aft er which the interest basis changes to<br />
a fl oating rate of three-month EURIBOR +423.5 basis points.
On 18. November 2010 <strong>Talanx</strong> AG issued a subordinated, in<br />
principle perpetual, bond with a nominal volume of EUR 300<br />
million and an initially fi xed coupon, with a fi rst scheduled<br />
call option aft er ten years for the entire bond. At the end of<br />
this period the interest basis changes to a fl oating rate and<br />
the bond may then be called in its entirety on a quarterly<br />
basis by <strong>Talanx</strong> AG. There is a contractual obligation to convert<br />
the bond to shares of <strong>Talanx</strong> AG at the issue price in the<br />
event of an initial public off ering.<br />
Eff ective 14 March 2011 the subordinated debt of nominally<br />
EUR 350 million issued in September 2001 through Hannover<br />
Finance (Luxembourg) S. A. was called as scheduled. The calling<br />
of the bond results in a reduction of our debt leverage.<br />
This notifi cation was published on 1 February 2011 in the<br />
newspaper “Luxemburger Wort”.<br />
Issued debt was repurchased only to a minimal extent in 2010.<br />
The changes in the strategic debt were as follows:<br />
Figures in EUR million<br />
2010 2009<br />
Subordinated bonds of Hannover<br />
Finance (Luxembourg) S. A. 1,869 1,365<br />
Subordinated bonds of HDI-Gerling<br />
Industrie Versicherung AG 265 269<br />
Subordinated bonds of HDI-Gerling<br />
Lebensversicherung AG 115 105<br />
Subordinated bonds of<br />
<strong>Talanx</strong> Finanz 242 264<br />
Subordinated bonds of <strong>Talanx</strong> AG 300 —<br />
Bank borrowings of <strong>Talanx</strong> AG 550 550<br />
Mortgage loans of Hannover Re<br />
Real Estate Holdings, Inc., Orlando 188 116<br />
Other bank borrowings<br />
of <strong>Talanx</strong> AG — 57<br />
Total 3,529 2,726<br />
For further explanation please see our remarks in the Notes<br />
on items 16 “Shareholders’ equity”, 17 “Subordinated liabilities”,<br />
25 “Notes payable and loans”, 26 “Other liabilities” as<br />
well as under “Other information – Contingent liabilities and<br />
other fi nancial commitments”.<br />
Group solvency<br />
As an insurance holding company <strong>Talanx</strong> AG is subject to<br />
regulatory provisions pursuant to §1 b) Insurance Supervision<br />
Act (VAG). For the <strong>Talanx</strong> Group, supervision is carried out on<br />
Management report Assets and shareholders’ equity<br />
the Group level by the Federal Financial Supervisory Authority<br />
(BaFin). For this purpose the parent company HDI V. a. G.<br />
reports supplementary information to the BaFin in accordance<br />
with the “adjusted solvency” rules.<br />
Solvency refers to the ability of an insurer to meet the obligations<br />
assumed under its contracts on a lasting basis. Above<br />
all, this means fulfi lling defi ned minimum capital requirements.<br />
The aim of the “adjusted solvency” rules is to prevent<br />
the multiple use of equity to cover risks from underwriting<br />
business at diff erent levels of the Group hierarchy. To calculate<br />
the adjusted solvency, the minimum equity required<br />
for the volume of business (required solvency margin) is<br />
compared with the eligible equity actually available (actual<br />
solvency margin) on the basis of the IFRS consolidated fi nancial<br />
statements. To determine the eligible capital elements,<br />
the IFRS equity is adjusted; in particular, it is increased by<br />
portions of the subordinated liabilities as well as valuation<br />
reserves not included in equity and reduced by intangible<br />
assets. The <strong>Talanx</strong> Group’s eligible capital is roughly twice as<br />
high as legally required.<br />
Adjusted solvency 1)<br />
2010 2009<br />
Eligible capital of the Group EUR million 6,361 5,639<br />
Adjusted solvency ratio % 196.6 184.2<br />
1) Calculated analogously for <strong>Talanx</strong> fr om the adjusted solvency of the HDI Group<br />
The increase in the adjusted solvency ratio from 184.2% to<br />
196.6% can be attributed in part to the rise in the IFRS Group<br />
shareholders’ equity as a consequence of the Group net<br />
income allocated to retained earnings. Furthermore, the taking<br />
up of subordinated bonds and debentures to an extent<br />
that more than off set partial repurchases of such instruments<br />
had a favorable infl uence on the Group’s eligible capital.<br />
The development of items to be deducted or added was<br />
virtually unchanged from the previous year.<br />
Rating of the Group and its major<br />
subsidiaries<br />
In the year under review the <strong>Talanx</strong> Group and its companies<br />
again maintained their excellent or very good ratings from<br />
the international rating agencies Standard & Poor’s (S&P) and<br />
A. M. Best. It is important to distinguish between the “Insurer<br />
71
72 <strong>Talanx</strong> Group Financial report 2010<br />
Financial Strength Rating”, which primarily assesses our<br />
ability to meet our obligations to our <strong>policy</strong>holders, and the<br />
“Issuer Credit Rating” or “Counterparty Credit Rating”, which<br />
provides investors with information from an independent<br />
source about a company’s credit quality in general.<br />
Financial Strength Ratings of the <strong>Talanx</strong> Group and its<br />
subgroups<br />
Standard & Poor’s A. M. Best<br />
Grade Outlook Grade Outlook<br />
<strong>Talanx</strong> Group 1) A Stable<br />
<strong>Talanx</strong> Primary Group 2) A+ Stable<br />
Hannover Re subgroup 3) AA– Stable A Positive<br />
1) The designation used by A. M. Best for the Group is “<strong>Talanx</strong> AG and its leading<br />
non-life direct insurance operation and its leading life insurance operation”<br />
2) This rating applies to the subgroup of primary insurers (the <strong>Talanx</strong> Group<br />
divisions of Industrial Lines, Retail Germany and Retail International) as well as<br />
its major core companies<br />
3) This rating applies to Hannover Re and its major core companies. The Hannover<br />
Re subgroup corresponds to the <strong>Talanx</strong> Group division of Reinsurance<br />
The fi nancial stability of the <strong>Talanx</strong> Group (with respect to<br />
both the primary insurance sector and the reinsurance sector)<br />
is assessed by the rating agency A. M. Best as “Excellent”;<br />
with a rating of A it is placed in the second-best rating category.<br />
The outlook for the rating of the primary insurance<br />
The fi nancial strength ratings from the primary insurance sector are summarized in the following table:<br />
Financial Strength Ratings of companies in the primary insurance sector<br />
sector is stable. The outlook for the rating of Hannover Re is<br />
assessed as positive in light of the company’s improved capitalization.<br />
In the case of S&P, the Hannover Re subgroup is awarded<br />
a rating in the second-best rating category at AA– (“Very<br />
Strong”), while the Primary Group was placed within the<br />
third-best rating category with an A+ (“Strong”). The outlook<br />
for the ratings is assessed as stable in both cases.<br />
The strong competitive position of both subgroups is highlighted<br />
by S&P as a particularly impressive strength. A. M. Best<br />
affi rmed inter alia the very good capitalization of both subgroups,<br />
which even beat the rating agency’s expectations.<br />
In 2010 another rating was added for a company belonging<br />
to the <strong>Talanx</strong> Group: HDI-Gerling Welt Service AG received its<br />
initial rating of A (Excellent) with a stable outlook from A. M.<br />
Best in December 2010. On the other hand, the S&P ratings of<br />
AA– awarded to Hannover Reinsurance (Dublin) Ltd. and E+S<br />
Reinsurance (Ireland) were withdrawn on account of their liquidation.<br />
The reason here was Hannover Re’s move to concentrate<br />
its business activities in Ireland at a single subsidiary,<br />
namely Hannover Reinsurance (Ireland) Ltd.<br />
Standard & Poor’s A. M. Best<br />
Companies Location Grade Outlook Grade Outlook<br />
HDI Direkt Versicherung AG Germany A+ Stable – –<br />
HDI-Gerling America Insurance Company USA A+ Stable A Stable<br />
HDI-Gerling Firmen und Privat Versicherung AG Germany A+ Stable – –<br />
HDI-Gerling Industrie Versicherung AG Germany A+ Stable A Stable<br />
HDI-Gerling Lebensversicherung AG Germany A+ Stable A Stable<br />
HDI-Gerling Welt Service AG Germany A+ Stable A Stable<br />
neue leben Lebensversicherung AG Germany A+ Stable – –<br />
HDI-Gerling Verzekeringen N. V. (Nederland)<br />
HDI-Gerling Verzekeringen N. V./<br />
Netherlands A Stable – –<br />
HDI-Gerling Assurances S. A. (Belgie/Belgique) Belgium A Stable – –<br />
HDI Versicherung AG Austria A Stable – –<br />
PB Lebensversicherung AG Germany A Stable – –<br />
PBV Lebensversicherung AG Germany A Stable – –<br />
TARGO Lebensversicherung AG Germany A Stable – –
S&P defi nes the fi rst seven companies listed in the table<br />
(shown against a grey background) as “core companies” of<br />
the <strong>Talanx</strong> Primary Group. This is also why they received the<br />
same rating. The other companies listed in the table are considered<br />
by S&P to be strategically signifi cant participations<br />
and have therefore been awarded grades that are one notch<br />
lower. In the case of A. M. Best, all four companies analyzed<br />
by this agency received the same rating of A with a stable<br />
outlook.<br />
Current ratings of Hannover Re subsidiaries are available on<br />
the Hannover Re website, www.hannover-re.com.<br />
Issuer Credit Ratings of companies belonging<br />
to the <strong>Talanx</strong> Group<br />
Standard & Poor’s A. M. Best<br />
Grade Outlook Grade 1) Outlook<br />
<strong>Talanx</strong> AG<br />
Hannover<br />
A– Stable bbb+ Stable<br />
Rückversicherung AG AA– Stable a+ Positive<br />
1) In order to distinguish Financial Strength Ratings fr om Issuer Credit Ratings,<br />
A. M. Best uses lower-case script for the latter<br />
This table provides an overview of the Issuer Credit Ratings<br />
(ICR). On the basis of the rating of A– (“Strong”), <strong>Talanx</strong> AG’s<br />
ability to pay is assessed by S&P as “Very Good”, hence corresponding<br />
to the third-best category on the issuer credit<br />
rating scale. A.M. Best rates the ability to pay of <strong>Talanx</strong> AG<br />
as bbb+ (“Good”), corresponding to the fourth-best rating<br />
category. The outlook of these ratings is assessed as stable by<br />
both rating agencies.<br />
The somewhat inferior assessment of <strong>Talanx</strong> AG relative to<br />
the Financial Strength Ratings can be attributed to the methodology<br />
used by the rating agencies, under which a rating<br />
markdown is applied to holding companies. In other words,<br />
in accordance with the general analytical criteria used by<br />
the rating agencies, companies that exercise a purely holding<br />
function with no operational activities of their own are<br />
downgraded relative to the Financial Strength Rating that<br />
would be awarded to a comparable insurance undertaking.<br />
Management report Assets and shareholders’ equity. Overall assessment of the economic situation<br />
Hannover Re is rated AA– (“Very Strong”) by S&P, equivalent<br />
to the second-best rating category. The outlook for this rating<br />
is stable. A. M. Best has awarded Hannover Re an Issuer Credit<br />
Rating of a+ (“Strong”), corresponding to the third-best rating<br />
category on the ICR rating scale used by A. M. Best. The outlook<br />
for Hannover Re’s ICR is – in keeping with its Financial<br />
Strength Rating – positive.<br />
Various ratings also exist for the subordinated liabilities<br />
issued by Group companies (issue ratings). These ratings are<br />
set out in the explanatory notes on the consolidated balance<br />
sheet in subsection 17 “Subordinated liabilities” of the Notes,<br />
page 216.<br />
Overall assessment of the<br />
economic situation<br />
The Management of <strong>Talanx</strong> AG assesses the development of<br />
business in 2010 – aft er elimination of non-recurring eff ects<br />
– as satisfactory overall. It is true that the targets for the<br />
operating profi t (EBIT) and return on equity were not accomplished,<br />
and the result therefore came in below expectations.<br />
Yet the decline in the result was attributable above all to special<br />
eff ects and the increased burden of losses aft er the exceptionally<br />
low claims expenditure of the previous year. From<br />
a structural perspective, the result is good: gross premiums<br />
and new business are growing and we boosted our fi nancial<br />
strength relative to the previous year. At the time when the<br />
management report was drawn up the Group’s economic<br />
situation continued to be favorable.<br />
73
74 <strong>Talanx</strong> Group Financial report 2010<br />
Non-financial performance indicators<br />
Staff<br />
Only thanks to the extraordinary commitment shown by the<br />
men and women working for the <strong>Talanx</strong> Group worldwide<br />
were we able to generate another good result in a market climate<br />
that remained challenging. The Board of Management<br />
would like to express its appreciation to all of the Group’s<br />
staff for their considerable dedication and good performance<br />
in the fi nancial year just-ended. The Board of Management<br />
thanks the Group Employee Council and all the other employee<br />
council bodies for their cooperation, which was at all times<br />
trusting and constructive.<br />
The number of staff employed within the <strong>Talanx</strong> Group at yearend<br />
stood at 18,006 (18,038); this was equivalent to 16,874<br />
(16,921) full-time positions. The workforce thus remained<br />
stable. Of the 18,006 employees that constitute the total<br />
labor force, 6,865 (6,656) – i.e. 38% – worked abroad and 11,141<br />
(11,382) were employed in Germany. Our Group has employees<br />
in 40 countries on 5 continents around the world. In<br />
Germany, roughly three-quarters of staff are employed in the<br />
federal states of North-Rhine Westphalia and Lower Saxony.<br />
Headcount by regions<br />
Other<br />
4%<br />
South and North America<br />
12%<br />
Eastern Europe<br />
13%<br />
Rest of Western Europe<br />
9%<br />
Germany<br />
62 %<br />
In Germany the proportion of female staff stood at 48%,<br />
while the proportion of part-time employees stood at 17%;<br />
both these fi gures were thus on a par with the previous year.<br />
Of the employees not subject to collective bargaining agreements,<br />
28% were women; the representation of women on<br />
senior executive level was 11%.<br />
Headcount by part-time/full-time status<br />
Part-time<br />
17%<br />
A fundamental principle at <strong>Talanx</strong> is that high performers<br />
with potential are fostered without regard to their ethnic origin,<br />
religion or gender. In the area of development programs<br />
for junior managers and newly appointed managers, the participation<br />
of women in most programs has averaged around<br />
25% in recent years. This level rises to 40% in the development<br />
program currently running for managerial staff in the<br />
property/casualty insurance sector. Female participation<br />
in the management program for future senior executives<br />
is close to the current representation of women among the<br />
ranks of senior management at altogether 12%.<br />
Systematic advancement through appropriate working-time<br />
models geared to the various phases of life – such as parttime<br />
working and telecommuting – as well as the assistance<br />
given to families in their search for suitable daycare facilities<br />
for children are intended to optimally develop and build the<br />
loyalty of women with the potential to take on leadership roles.<br />
Based on these measures, it is our expectation that women will<br />
increasingly move into all echelons of management.<br />
Headcount by gender<br />
Female<br />
48%<br />
Full-time<br />
83%<br />
Male<br />
52%<br />
For the <strong>Talanx</strong> Group, state-of-the-art human resources management<br />
is crucial to the successful execution of strategy.<br />
Considerable eff orts were devoted in the year under review to<br />
the project activities carried out in the context of the organizational<br />
reconfi guration of the <strong>Talanx</strong> Group. A key concern
here is improving the competitiveness of the <strong>Talanx</strong> Group<br />
in order to ensure that growth and profi tability targets are<br />
achieved and secure jobs created for the long term. In this<br />
connection, most notably, various central functions are to be<br />
concentrated at a newly established service company and at<br />
<strong>Talanx</strong> AG as part of the latter’s expansion into the Group’s<br />
fi nancial and management holding company.<br />
In addition, Group-wide personnel management activities<br />
were focused on personnel marketing, personnel development<br />
and training.<br />
One consequence of the impending demographic shift is<br />
that even in the near future companies will have to face up<br />
to greater competition for qualifi ed university graduates and<br />
specialists. In order to ensure that <strong>Talanx</strong> continues to be<br />
able to attract highly skilled and motivated recruits, considerable<br />
importance attaches to boosting awareness of the <strong>Talanx</strong><br />
Group and its individual brands. As part of university marketing<br />
activities and the placement of <strong>Talanx</strong> as a successful<br />
employer brand, we launched our comprehensive employer<br />
image campaign in the year under review; driven by the slogan<br />
“<strong>Talanx</strong> your career”, it enjoys strong recognition value.<br />
Along with personnel marketing, personnel development is a<br />
focal point of our human resources management. As in past<br />
years, our employees’ skills were systematically enhanced to<br />
handle their demanding tasks by way of training and personnel<br />
development measures. The goal is to consolidate and<br />
extend the above-average skills set of our workforce in order<br />
to optimally prepare the Group for the challenges presented<br />
by the market. Launched in the previous year, the <strong>Talanx</strong><br />
Corporate Academy has been very successful in establishing<br />
itself and off ers an especially high-grade training program<br />
in German and English for Board members and senior<br />
managers. Complementing the already existing off erings of<br />
the divisions, the Corporate Academy serves in particular<br />
to convey the <strong>Talanx</strong> strategy and management methods.<br />
Another important goal is to enhance communication and<br />
links between the holding company and the divisions as<br />
well as between the various divisions. Professors from<br />
highly reputed business schools are joined by members of<br />
the <strong>Talanx</strong> AG Board of Management as guest speakers and<br />
discussants.<br />
Management report Non-fi nancial performance indicators<br />
The extent to which members of staff across all divisions<br />
sought to improve themselves was gratifying. Not only did<br />
they make the most of off erings relating to specialist topics,<br />
they also worked intensively to refi ne their methodological,<br />
managerial and social skills.<br />
The Industrial Lines division focused on fostering young<br />
talent. Trainee programs in the individual insurance lines<br />
convey a solidly grounded grasp of the theory and practice<br />
of property/casualty insurance in self-contained, one-year<br />
units. These activities are designed to build up a suffi cient<br />
number of suitably qualifi ed employees in order to meet the<br />
increased need for specialist staff .<br />
For the most part, the Retail Germany division cooperates in<br />
the area of human resources development with the Group’s<br />
own training center in Cologne in order to off er a broad range<br />
of specialist, methodological and social skills enhancement<br />
measures. This encompasses technical seminars, personality<br />
training and also specially devised programs aimed at<br />
specifi c target groups. In addition, a specialist career model<br />
developed in the previous year in the bancassurance sector<br />
was rolled out for a number of other functions: employees<br />
follow an individually tailored three-part development plan<br />
worked out with their manager. This includes personality<br />
seminars geared closely to the company’s competence profi le.<br />
The second element of the career plan is specialist further<br />
training, such as participation in study programs alongside<br />
an employee’s job with the encouragement and fi nancial<br />
support of the company. Thirdly, project skills are enhanced –<br />
with employees able to extend their theoretical and practical<br />
grasp of the role of both project worker and project manager.<br />
The successful and innovative execution of this concept<br />
was recognized with the award of the insurance industry’s<br />
internal training prize “InnoWard 2010”, beating out 37 other<br />
candidatures from throughout the entire German insurance<br />
industry.<br />
75
76 <strong>Talanx</strong> Group Financial report 2010<br />
On the reinsurance side, too, considerable importance<br />
attaches to solid and state-of-the-art internal training. This<br />
system has been continuously expanded and enhanced in<br />
recent years. Along with traditional presence seminars, Hannover<br />
Re is developing a second pillar of learning methodology<br />
known as “blended learning”. This refers to a learning<br />
arrangement in which online study phases and presence<br />
training are intelligently combined and synthesized into a<br />
single unit. Learning thus becomes more self-manageable<br />
and, not least, more independent of time and place, hence<br />
making it possible to integrate colleagues at locations abroad<br />
more easily.<br />
For many years Hannover Re has been off ering a practicetested<br />
trainee program focused on graduates in economics<br />
(business administration and economics) and (commercial)<br />
law as well as graduates in cultural studies. The purpose<br />
of this cross-divisional program is to systematically train<br />
young talent for its core business of underwriting. In 2009<br />
Hannover Re extended this highly tailored, internal form<br />
of further training; it put in place another special training<br />
program for (business) mathematicians in response to the<br />
continuous and appreciable growth in the need for qualifi ed<br />
mathematicians in recent years.<br />
The Group also continues to attach considerable importance<br />
to initial training: it enables the company to attract capable,<br />
skilled and motivated recruits. For the individual, it is a vital<br />
prerequisite for getting off to a successful start in working life.<br />
The vast majority of those undergoing training are taken on<br />
following completion of their instruction. 404 (391) apprentices<br />
and student trainees were employed by the <strong>Talanx</strong> Group<br />
in Germany as at 31 December 2010.<br />
Sustainability<br />
The member companies of the <strong>Talanx</strong> Group demonstrate<br />
their sense of responsibility to the environment in a broad<br />
variety of ways. Three courses of action are available to our<br />
insurers: sustainable enterprise management, the development<br />
of products that promote criteria such as environmental<br />
conservation, energy effi ciency and social responsibility,<br />
and observance of such criteria in their own investment<br />
decisions.<br />
At our companies we are committed inter alia to energysaving<br />
measures, which take a number of forms in our offi ce<br />
buildings. New buildings, in particular, off er an opportunity<br />
to pay close attention to environmentally compatible construction<br />
techniques and ecologically friendly operation. A<br />
current example is the new corporate headquarters in Hannover,<br />
which is to be occupied by the end of 2011: the technical<br />
concept here is geared to the minimal consumption of<br />
energy and resources. The basic energy need for heating and<br />
cooling, for example, is served by the earth’s natural potential<br />
(geothermal energy). A highly insulated building envelope,<br />
triple glazing and the greening of roof surfaces similarly contribute<br />
to the building’s sustainability.<br />
On the product side our range of insurance off erings includes<br />
coverage extensions for photovoltaic systems as well as preferential<br />
rates in motor insurance for fuel-effi cient vehicles,<br />
hybrid vehicles and those with engines powered by electricity,<br />
natural gas, hydrogen or fuel cells. HDI-Gerling off ers an<br />
actively managed eco-portfolio in all its current fund products.<br />
The “Zukunft ” (“Future”) investment strategy contains<br />
sustainable equity, mixed and bond funds. The selection<br />
criteria are conservation of the natural environment, economical<br />
use of resources, fair treatment of people and an<br />
attractive return.<br />
AmpegaGerling’s portfolio also contains investment products<br />
that accommodate sustainability concerns. It off ers several<br />
sustainable investments, including not only the Gerling<br />
Responsibility Fund but also the special bond and equity<br />
funds terrAssisi Renten I AMI and terrAssisi Aktien I AMI.<br />
These funds invest in entities and issuers that incorporate<br />
not only economic but also environmental and social criteria<br />
into their company strategy and which are considered<br />
trailblazers when it comes to assuming responsibility for a<br />
sustainable future.<br />
Our Group invests in accordance with regulatory requirements<br />
with an eye to the greatest possible profi tability,<br />
liquidity and security so as to be able to render the agreed<br />
insurance benefi ts at all times. If investment options are<br />
available to us that accommodate particular ethical, social<br />
and ecological concerns while at the same time meeting all<br />
the aforementioned requirements, these are given special<br />
consideration.
Social responsibility<br />
<strong>Talanx</strong> has combined its activities in the fi eld of Corporate<br />
Social Responsibility under the heading of education and<br />
training. A central step was the establishment of a foundation.<br />
The <strong>Talanx</strong> Foundation, which was set up in 2009 with<br />
the aim of off ering fi nancial assistance to particularly strong<br />
students in insurance-related disciplines and institutes at<br />
selected universities, awarded ten study scholarships per<br />
semester for the fi rst time in 2010. The scholarships were initially<br />
awarded for one year and may be extended for a further<br />
year on at most two occasions until completion of the standard<br />
period of study. By way of this engagement <strong>Talanx</strong> AG<br />
seeks to live up to its responsibility to society through the<br />
emphasis that it has placed on education and training. We<br />
believe it is important to off er fi nancial assistance to particularly<br />
strong and deserving students. The aim is to support<br />
above all those students who themselves lack the resources<br />
to complete their degree in the standard period of study<br />
and with an outcome that refl ects their talent if they do not<br />
receive appropriate assistance.<br />
Marketing and advertising, sales<br />
The multi-brand principle pursued within the <strong>Talanx</strong> Group<br />
is refl ected in its polyphonic external communications<br />
inasmuch as the subsidiaries seek to address their specifi c<br />
customer segments with their various brands through tailored<br />
marketing and advertising. Primary insurers such as<br />
HDI and HDI-Gerling engage directly with the broader public,<br />
using inter alia TV commercials, publicity campaigns and<br />
sponsorship activities. Reinsurance and asset management<br />
operations focus on their particular target groups. <strong>Talanx</strong> AG<br />
speaks principally to the broader fi nancial community and<br />
business journalists and its communication is therefore limited<br />
chiefl y to print advertisements in selected media.<br />
The sales channels employed by the Group’s companies are<br />
extremely diverse: they range from our own tied agents’<br />
organizations and local representation by branch offi ces and<br />
sales outlets through the use of brokers and independent<br />
agents to highly specialized bancassurance cooperations. For<br />
further information please see the subsections on the various<br />
Group segments.<br />
Management report Non-fi nancial performance indicators. Corporate Governance<br />
Corporate Governance<br />
<strong>Talanx</strong> AG takes good Corporate Governance to mean responsible<br />
enterprise management and supervision geared to<br />
sustainable value creation. In particular, we strive to further<br />
foster the trust placed in us by future investors, our customers<br />
and employees as well as the public at large. We also<br />
attach considerable importance to the effi cient conduct of<br />
their work by the Board of Management and Supervisory<br />
Board, good cooperation between these bodies and with the<br />
company’s staff as well as open and transparent corporate<br />
communications.<br />
<strong>Talanx</strong> AG is a joint-stock company under German stock<br />
corporation law. It has three executive bodies: the Board of<br />
Management, Supervisory Board and General Meeting. The<br />
tasks and powers of these bodies are defi ned by law, the<br />
company’s Articles of Association and the Rules of Procedure<br />
for the Board of Management and Supervisory Board.<br />
In accomplishing its goal of generating a sustainable increase<br />
in the value of the company, <strong>Talanx</strong> AG is guided extensively<br />
by the principles of the German Corporate Governance Code<br />
(DCGK), by means of which it is progressively aligning itself<br />
with the standards of German listed enterprises.<br />
Board of Management<br />
The Board of Management leads the company at its own<br />
responsibility and defi nes goals as well as strategy. In accordance<br />
with § 7 Paragraph 1 of the Articles of Association, the<br />
Board of Management is comprised of at least two persons.<br />
Beyond that, the Supervisory Board determines the number<br />
of members. The current composition of the Board of Management<br />
is set out on page 8 of the Annual Report.<br />
The working practice of the Board of Management is governed<br />
by Rules of Procedure adopted by the Supervisory<br />
Board. These defi ne the areas of responsibility of the individual<br />
members of the Board of Management. Each member of<br />
the Board of Management leads the area(s) assigned to them<br />
at their own responsibility within the scope of the resolutions<br />
of the full Board of Management. In addition, the Rules of<br />
Procedure set out the matters reserved for the full Board of<br />
Management as well as the required voting majorities. The<br />
full Board of Management decides in all cases where adoption<br />
of a resolution by the full Board of Management is stipulated<br />
by law, the Articles of Association or the Rules of Procedure.<br />
The Board of Management meets at least once a month.<br />
77
78 <strong>Talanx</strong> Group Financial report 2010<br />
The Board of Management reports regularly and comprehensively<br />
to the Supervisory Board on the strategic orientation,<br />
the development of business, the fi nancial position and<br />
results of operations, the planning and goal accomplishment<br />
as well as the existing opportunities and risks.<br />
Certain decisions of the Board of Management that are of<br />
special importance require the approval of the Supervisory<br />
Board. Some of these reservations of approval are prescribed<br />
by law, others are governed by the Rules of Procedure of the<br />
Board of Management.<br />
Supervisory Board<br />
The Supervisory Board advises and monitors the management<br />
of the company. It is also responsible, in particular, for<br />
the appointment and employment contracts of members of<br />
the Board of Management and for the examination of the<br />
annual fi nancial statements.<br />
The Supervisory Board consists of 16 members. Half of them<br />
are chosen by the shareholders and the other half are elected<br />
by the employees. In order to ensure that the Supervisory<br />
Board performs its tasks eff ectively, it has formed the following<br />
committees:<br />
■<br />
■<br />
■<br />
■<br />
Personnel Committee<br />
Finance and Audit Committee<br />
Nomination Committee<br />
Standing Committee<br />
The Board of Management informs the Supervisory Board in<br />
a regular and timely manner of the development of business,<br />
the implementation of strategic decisions, material opportunities<br />
and risks as well as the company’s planning. The Chairman<br />
of the Supervisory Board is in constant contact with the<br />
Chairman of the Board of Management in order to discuss<br />
with him the company’s strategy, business development and<br />
risk management. The composition of the Supervisory Board<br />
and its committees is set out on pages 9 et seq.<br />
General Meeting<br />
Shareholders exercise their rights at the General Meeting.<br />
The sole shareholder is HDI Haft pfl ichtverband der<br />
Deutschen Industrie V. a. G.<br />
Each share carries one vote in the voting on resolutions.<br />
The General Meeting elects the members of the Supervisory<br />
Board representing the shareholders and votes to ratify the<br />
acts of management of the Board of Management and the<br />
Supervisory Board. It decides upon the appropriation of the<br />
disposable profi t, on capital measures and the approval of<br />
company agreements, as well as on the remuneration of the<br />
Supervisory Board and on amendments to the company’s<br />
Articles of Association. Each year an ordinary General Meeting<br />
is held, at which the Board of Management and the Supervisory<br />
Board provide an account of the fi nancial year justended.<br />
In special cases, the Stock Corporation Act provides<br />
for the convening of an extraordinary General Meeting.<br />
Compliance<br />
For the <strong>Talanx</strong> Group, compliance with applicable laws as<br />
a fundamental prerequisite for lasting successful business<br />
operations is a matter of course. Employees are supported in<br />
this respect by the compliance offi cers at <strong>Talanx</strong>.<br />
The Code of Conduct for our staff has defi ned standards for<br />
responsible and ethical behavior on all levels of the Group.<br />
It is incumbent upon every employee within the Group to<br />
ensure that their actions are in compliance with this code<br />
and the laws, guidelines and instructions governing their<br />
area of work.<br />
Our commercial success is determined not only by the quality<br />
of our products and services, but also by the legally correct<br />
and responsible conduct of our employees towards each<br />
other, our business partners and the public at large. Only in<br />
this way can we create trust, an especially decisive competitive<br />
factor in our industry.
In the form of training events and programs we off er staff the<br />
opportunity to refresh, broaden and deepen their knowledge<br />
and profi ciency with respect to selected compliance-related<br />
topics.<br />
A whistleblower system gives staff the opportunity to provide<br />
tips on certain serious breaches of the law – anonymously, if<br />
they so desire. This enables compliance offi cers to take action,<br />
contain the damage and avoid further losses.<br />
Risk monitoring and steering<br />
The risk management system of <strong>Talanx</strong> AG applicable throughout<br />
the Group is based on the risk strategy, which in turn is<br />
derived from the company strategy. A core component is systematic<br />
and comprehensive recording of all risks that from<br />
the current standpoint could conceivably jeopardize the company’s<br />
profi tability and continued existence. Further details<br />
in this regard may be obtained from the risk report contained<br />
in the present Annual Report on pages 84 et seq.<br />
Management report Corporate Governance. Remuneration report<br />
Remuneration report<br />
The remuneration report describes and explains the basic<br />
features of the remuneration structure for the Board of Management<br />
of <strong>Talanx</strong> AG as well as the amount of remuneration<br />
paid to the Board of Management and the key criteria used in<br />
its determination. The explanations provided cover both the<br />
remuneration structure applicable to the year under review<br />
and the revised remuneration structure for the Board of<br />
Management that is to be adopted for the 2011 fi nancial year.<br />
The remuneration of the Supervisory Board of <strong>Talanx</strong> AG,<br />
which additionally included a performance-based component<br />
for the fi rst time in the year under review, is also described.<br />
Furthermore, the main features of the remuneration paid to<br />
managing directors and managers outside the Group Board<br />
of Management are also discussed.<br />
Remuneration of the Board of<br />
Management<br />
The remuneration of the Board of Management is determined<br />
by the Supervisory Board. The Supervisory Board<br />
reviews and discusses the remuneration structure and the<br />
appropriateness of the remuneration at regular intervals.<br />
The most recent review was conducted by the Supervisory<br />
Board at its meeting on 13 November 2010. At this meeting<br />
the Supervisory Board also decided upon a fundamental<br />
reorientation of the system of remuneration for the Board<br />
of Management with eff ect from the 2011 fi nancial year. This<br />
is described in greater detail below.<br />
The purpose of the remuneration system for the Board of<br />
Management is to appropriately recompense the members<br />
of the Board of Management. Based on the scope of activity<br />
and responsibility of the individual member of the Board of<br />
Management, the total remuneration is geared to his or her<br />
personal performance and the commercial success of the<br />
company. It consists of the following components:<br />
Fixed remuneration: The fi xed remuneration is paid in twelve<br />
equal monthly installments. It is guided, in particular, by<br />
the range of duties and professional experience of the individual<br />
Board member. The amount of fi xed remuneration is<br />
reviewed by the Supervisory Board at intervals of two years.<br />
79
80 <strong>Talanx</strong> Group Financial report 2010<br />
Variable remuneration: The individual performance of a particular<br />
Board member and the commercial success of the<br />
company are recognized through an appropriate portion of<br />
variable remuneration in the total remuneration.<br />
The variable remuneration is paid in the form of a bonus for<br />
the fi nancial year just-ended. It is determined by the Supervisor<br />
Board in light of the performance and economic position<br />
of the company and the Group as a whole, the performance<br />
of the specifi c Board member’s area of responsibility as well<br />
as his or her individual performance.<br />
Fringe benefi ts: The members of the Board of Management<br />
also receive certain fringe benefi ts, most notably a company<br />
car and insurance protection (liability, accident and luggage<br />
insurance).<br />
Insofar as Board members exercise a mandate at Group companies<br />
and are recompensed for this function, such remuneration<br />
is counted towards the bonus paid by <strong>Talanx</strong> AG.<br />
With regard to the amount of remuneration received by the<br />
Board of Management, please see the information contained<br />
in the present Annual Report on pages 253 et seq.<br />
Occupational retirement provision<br />
The employment contracts of the members of the Board of<br />
Management with <strong>Talanx</strong> AG include – with one exception,<br />
where an annual funding contribution is paid according to<br />
the fi xed remuneration – commitments to an annual pension<br />
that is calculated as a percentage of the fi xed annual<br />
remuneration (“defi ned benefi t”). The agreed maximum<br />
pension amounts to – depending on the particular contract<br />
– between 35% and 65% of the monthly fi xed salary payable<br />
upon retirement as provided for by the contract at the<br />
age of 65. In one instance a commitment exists on the basis<br />
of a defi ned contribution. In this case the company pays<br />
an annual funding contribution amounting to 20% of the<br />
pensionable income (fi xed annual remuneration as at the<br />
key date of 1 July of any year). Under both contract variants<br />
(“defi ned benefi t” and “defi ned contribution”) income from<br />
other sources during drawing of the pension may under certain<br />
circumstances be counted towards it pro rata or in full<br />
(e.g. in the event of incapacity for work or termination of the<br />
employment contract before reaching age 65, drawing of disability<br />
benefi ts or previously earned pension payments).<br />
In the year under review six individual commitments existed<br />
to active members of the Board of Management. The provision<br />
expensed for this purpose pursuant to International<br />
Financial Reporting Standards amounted to EUR 3.9 million<br />
in the year under review.<br />
With respect to the remuneration received by former members<br />
of the Board of Management and their surviving dependents<br />
as well as the provisions for pension liabilities constituted<br />
for this group of persons, please see the information<br />
provided in the Notes to this Annual Report.<br />
Revised remuneration structure from 1 January 2011<br />
onwards<br />
The Supervisory Board reviewed the remuneration system<br />
for the Board of Management in the year under review on<br />
the basis of revised legal and regulatory requirements for<br />
management remuneration and adjusted its structure with<br />
a special eye to sustainability considerations. In this context,<br />
the criteria for measurement of the profi t- and performancebased<br />
variable remuneration and their weighting were also<br />
redefi ned. The revised remuneration structure applies with<br />
eff ect from the 2011 fi nancial year onwards to all active members<br />
of the Board of Management.<br />
The remuneration of the Board of Management is geared<br />
to the size and activities of the company, its economic and<br />
fi nancial position, its success and future prospects as well as<br />
the customariness of the remuneration, making reference to<br />
the benchmark environment (horizontal) and the remuneration<br />
level applicable to the company’s employees. It is also<br />
guided by the tasks of the specifi c member of the Board of<br />
Management, his or her individual performance and the performance<br />
of the full Board of Management.<br />
Overall, the remuneration is structured in such a way that it<br />
refl ects both positive and negative developments, is measured<br />
competitively and in line with market standards and takes into<br />
account the sustainable development of the company.<br />
As before, the remuneration is split into annual fi xed remuneration<br />
– which to some extent for the fi rst time does not<br />
constitute the basis for calculating the amount of the fi nal<br />
salary pension – and variable remuneration; in this respect,<br />
the variable remuneration consists of a performance-based<br />
annual cash payment, a so-called “bonus bank” with disbursement<br />
aft er three years and share-based remuneration<br />
(share awards). By exercising due discretion the Supervisory
Board determines at regular intervals and in exceptional situations<br />
whether adjustments need to be made to the variable<br />
remuneration or restrictions placed upon its disbursement.<br />
The proportion of the total remuneration attributable to variable<br />
remuneration varies individually and is within a range<br />
of 45% to 65%.<br />
Measurement of the variable remuneration<br />
The amount of variable remuneration depends on certain<br />
defi ned events and on the accomplishment of certain set<br />
targets. The set targets vary according to the function of<br />
the Board member in question. The variable remuneration<br />
is comprised of a so-called “Group bonus” and an “individual<br />
bonus” as well as – in the case of Board members with<br />
responsibility for a particular division – a so-called “divisional<br />
bonus”. The weighting of the various components is determined<br />
individually for each member of the Board of Management<br />
in light of the function that he or she performs.<br />
An individually determined amount is paid as the Group<br />
bonus for each 0.1 percentage point by which the average<br />
return on equity (RoE) of the last three fi nancial years exceeds<br />
the risk-free interest rate. If the average return on equity of the<br />
last three fi nancial years is below the risk-free interest rate or<br />
if it is negative, this results in a corresponding penalty amount<br />
for each 0.1 percentage point of undershoot. The maximum<br />
amount of the Group bonus and the maximum penalty<br />
amount are agreed individually. The arrangements governing<br />
the Group bonus may be adjusted if the risk-free interest rate<br />
changes to such an extent that an (absolute) deviation arises<br />
of at least 1 percentage point. The risk-free interest rate is the<br />
average market rate over the last fi ve years for 10-year German<br />
government bonds, with the average being calculated annually<br />
at year-end on the basis of the relevant interest rate.<br />
The divisional bonus is to be geared to the average “Intrinsic<br />
Value Created” (“IVC”) over the three-year period just-ended<br />
for the division for which the Board member in question<br />
bears responsibility. A generally applicable concept for measurement<br />
of the IVC has still to be fi nalized. The provision<br />
governing calculation of the divisional performance on the<br />
basis of the divisional IVC is to be applied for the fi rst time<br />
to the 2013 fi nancial year. Until such a provision has been<br />
drawn up, the divisional bonus will be established by the<br />
Supervisory Board according to its due discretion. In this context,<br />
the Supervisory Board shall pay particular attention to<br />
Management report Remuneration report<br />
the following criteria: relative change in the IVC in the remuneration<br />
year, absolute amount of the IVC in the remuneration<br />
year, IVC in the remuneration year relative to the target<br />
value, distribution ratio or profi t transfer ratio of the division<br />
relative to the target value, general market environment. The<br />
individually defi ned amount for 100% criteria fulfi llment is<br />
attained if the criteria are achieved in full. Over- or underfulfi<br />
llment of the criteria results in additions or deductions.<br />
The minimum divisional bonus amounts to EUR 0, while the<br />
maximum is double the bonus payable on complete fulfi llment<br />
of the criteria.<br />
In addition, individual qualitative and, as appropriate,<br />
quantitative personal goals that are to be attained in the<br />
subsequent year are defi ned annually for the Board member<br />
in question. The criteria applied in this regard may, in particular,<br />
be the Board member’s individual contribution to<br />
the overall result, their leadership skills, power of innovation<br />
and entrepreneurial abilities as well as other quantitative<br />
or qualitative personal goals, especially making allowance<br />
for the special features associated with their area of Board<br />
responsibility. The degree of goal attainment is determined<br />
by the Supervisory Board at its due discretion in the Supervisory<br />
Board meeting at which the consolidated fi nancial statements<br />
for the fi nancial year in question are approved. The<br />
amount for 100% goal attainment is established on an individual<br />
basis. Over- or underfulfi llment results in additions<br />
or deductions. The minimum individual bonus amounts to<br />
EUR 0, while the maximum is double the bonus payable on<br />
complete attainment of the goals.<br />
The total amount of the variable remuneration is arrived at<br />
by adding the amounts for the individual remuneration components.<br />
If addition of the individual amounts gives rise to a<br />
negative amount, the variable remuneration amounts to zero<br />
(in other words, there is no negative variable remuneration).<br />
A negative amount is, however, taken into consideration<br />
when calculating the bonus bank.<br />
Payment of the variable remuneration<br />
Of the total amount of defi ned variable remuneration, a partial<br />
amount of 60% is paid out in the month following the<br />
Supervisory Board meeting that approves the consolidated<br />
fi nancial statements. The remaining amount – i.e. 40% of the<br />
total amount of variable remuneration – is initially withheld.<br />
Half of the withheld portion is allocated to a bonus bank,<br />
while the other half is granted in the form of share awards.<br />
81
82 <strong>Talanx</strong> Group Financial report 2010<br />
Each year 20% of the mathematically determined variable<br />
remuneration is allocated to the bonus bank and withheld<br />
interest-free for a period of three years. If the mathematically<br />
calculated amount of the variable remuneration is negative,<br />
100% of this negative amount is allocated to the bonus<br />
bank. The balance in the bonus bank is reduced accordingly.<br />
A positive balance in the bonus bank is carried forward to<br />
the next year aft er deduction of any amount paid out, while<br />
a negative balance is not carried forward to the following<br />
year. The amount allocated to the bonus bank in each case is<br />
paid out aft er three years to the extent that it is covered by<br />
the balance existing at that time – allowing for credits/debits<br />
up to and including those for the most recent fi nancial year<br />
just-ended. Any portion of the variable remuneration due for<br />
disbursement that is not covered by the balance in the bonus<br />
bank is forfeited.<br />
The other partial amount of 20% of the total defi ned variable<br />
remuneration is granted as share-based remuneration in<br />
the form of share awards. The total number of share awards<br />
granted is to be determined – following an initial public<br />
off ering of <strong>Talanx</strong> AG – by the value per share of <strong>Talanx</strong> AG<br />
at the time when the award is made. The value per share of<br />
<strong>Talanx</strong> AG is established according to the unweighted arithmetic<br />
mean of the XETRA closing prices of the <strong>Talanx</strong> share in a<br />
period of fi ve trading days before to fi ve trading aft er the meeting<br />
of the Supervisory Board that approves the consolidated<br />
fi nancial statements. As long as the shares of <strong>Talanx</strong> have not<br />
been listed, the value per share of <strong>Talanx</strong> AG shall be deemed<br />
to be the book value of the shareholders’ equity obtained<br />
from the consolidated fi nancial statement for the fi nancial<br />
year just-ended drawn up in accordance with international<br />
fi nancial reporting standards as defi ned by § 315a of the Commercial<br />
Code (HGB). The total number of share awards granted<br />
is arrived at by dividing the credit amount by the value per<br />
share, rounded up to the next full share. For each share award<br />
the value of a <strong>Talanx</strong> share calculated on the disbursement<br />
date is paid out aft er expiry of a vesting period of four years.<br />
Remuneration of the Supervisory Board<br />
The remuneration of the Supervisory Board is guided by § 13<br />
of the Articles of Association of <strong>Talanx</strong> AG. It is set by the<br />
General Meeting of <strong>Talanx</strong> AG and was adjusted and restructured<br />
at the 2010 General Meeting.<br />
In addition to reimbursement of their expenses, the members<br />
of the Supervisory Board annually receive fi xed remuneration<br />
(basic remuneration) and performance-based variable remuneration,<br />
which also refl ects the company’s long-term success.<br />
In order to make allowance for their considerable additional<br />
workload, the Chairman receives 2.5 times and his Deputy 1.5<br />
times these remuneration amounts.<br />
For the 2010 fi nancial year the annual basic remuneration set<br />
by the General Meeting amounts to EUR 50,000 per member<br />
of the Supervisory Board. The basic remuneration of the<br />
Chairman amounts to EUR 125,000, while that of the Deputy<br />
Chairman amounts to EUR 75,000.<br />
In addition, commencing with the 2010 fi nancial year, each<br />
member of the Supervisory Board receives variable remuneration<br />
of EUR 55 for each full EUR million by which the<br />
average Group net income aft er minority interests of the last<br />
three fi nancial years exceeds the minimum return pursuant<br />
to § 113 Para. 3 Stock Corporation Act (AktG) (4% of the contributions<br />
paid on the lowest issue price of the shares) (benchmark).<br />
The factor for the Chairman amounts to EUR 138, and<br />
for his Deputy EUR 83. The variable remuneration of the<br />
members of the Supervisory Board is capped at a maximum<br />
of EUR 50,000, for the Chairman at EUR 125,000 and for his<br />
Deputy at EUR 75,000. If the average Group net income aft er<br />
minority interests of the last three fi nancial years falls short<br />
of the minimum return pursuant to § 113 Para. 3 Stock Corporation<br />
Act (AktG), the variable remuneration is forfeited.<br />
Further remuneration of EUR 25,000 per member has been<br />
specifi ed for the 2010 fi nancial year for the members of the<br />
Finance and Audit Committee and the Personnel Committee<br />
of the Supervisory Board. The Chairman of the Committee<br />
receives twice this amount.<br />
In addition to reimbursement of their expenses, the members<br />
of the Supervisory Board receive an attendance allowance<br />
of EUR 1,000 for their participation in each meeting<br />
of the Supervisory Board as well as for their participation in<br />
each meeting of Committees of the Supervisory Board.<br />
The upper limit of the annual total remuneration that can be<br />
received by a Supervisory Board member is three times the<br />
applicable basic remuneration.<br />
With regard to the amount of remuneration received by the<br />
Supervisory Board, please see the information contained in<br />
the present Annual Report on pages 253 et seq.
Remuneration received by managing<br />
directors and managers below the Group<br />
Board of Management<br />
The remuneration strategy of the <strong>Talanx</strong> Group is geared<br />
to the goal of a sustainable increase in the value of the<br />
Group. The remuneration structure described for members<br />
of the Group Board of Management therefore applies in<br />
principle to managing directors and managers outside the<br />
Group Board of Management who are equally able to exert<br />
a material infl uence on the overall risk profi le (so-called risk<br />
carriers).<br />
Separate remuneration systems exist in the individual divisions<br />
within the <strong>Talanx</strong> Group for the group of persons composed<br />
of managing directors and managers below the rank of<br />
managing director who are not included among the risk carriers;<br />
these systems refl ect the remuneration strategy of the<br />
Group. Structuring diff erences are designed to take account<br />
of the specifi c framework factors in the divisions as well as<br />
to promote their competitiveness.<br />
It is also the case with this group of persons that the remuneration<br />
is composed of a fi xed and variable component.<br />
The fi xed part of the remuneration amounts to between<br />
50 and 85% of the total remuneration and is paid out in<br />
twelve equal monthly installments. Certain fringe benefi ts,<br />
in particular the use of a company car and insurance protection<br />
(liability, accident and luggage insurance), as well<br />
as employer-funded commitments to occupational retirement<br />
benefi ts are also granted. Furthermore, it is possible to<br />
build up additional employee-funded retirement provision<br />
through deferred compensation. Hannover Rückversicherung<br />
AG also off ers a virtual stock option plan that provides<br />
for the award of stock appreciation rights.<br />
The measurement of the variable part of the remuneration<br />
takes into account the sustainable success of the company,<br />
the sustainable success of the organizational unit and the<br />
personal success of the member of staff . Individual goals<br />
must be in harmony with the strategy of the <strong>Talanx</strong> Group<br />
and must be conducive to enhancing the performance of<br />
the <strong>Talanx</strong> Group. The remuneration schemes and management-by-objectives<br />
systems used within the Group will<br />
be further standardized in 2011 in those areas where such a<br />
move is expedient – without losing sight of the diff erences<br />
between the divisions.<br />
Management report Remuneration report. Opportunity and risk report<br />
Opportunity and risk report<br />
Risk report<br />
Risk strategy<br />
The risk strategy derived from the company strategy constitutes<br />
the basis for our handling of risks and opportunities.<br />
The parameters and decisions of the Board of Management<br />
with respect to the Group’s risk appetite are fundamental to<br />
the acceptance of risks. The risk strategy – as a self-contained<br />
set of rules – serves as the foundation for Group-wide risk<br />
management. It thus forms an integral component of entrepreneurial<br />
actions and is refl ected in the detailed strategies of<br />
the various divisions.<br />
As an internationally operating insurance and fi nancial services<br />
group we are confronted with a broad diversity of risks<br />
that are indivisibly bound up with our entrepreneurial activities<br />
and which manifest themselves diff erently in the individual<br />
divisions and geographical regions. Both the company<br />
strategy and the risk strategy are therefore subject to regular<br />
review. Through this regular scrutiny of our assumptions<br />
and any resulting adjustments, we ensure that our strategic<br />
principles and hence also our actions are guided by the latest<br />
insights.<br />
The overriding goal of our risk management is to adhere<br />
to our strategically defi ned risk positions. As far as capital<br />
resources are concerned, we strive for a capital adequacy<br />
ratio in our internal risk capital model that gives us a sizeable<br />
safety cushion. As a collateral condition to the regulatory target<br />
of overfulfi llment of capital adequacy, <strong>Talanx</strong> pursues a<br />
target rating corresponding to the Standard & Poor’s category<br />
of “AA”.<br />
Functions within the risk management systems<br />
The interplay of the individual functions and bodies within<br />
the overall system is vital to an effi cient risk management<br />
system. <strong>Talanx</strong> has clearly defi ned the roles and responsibilities<br />
in order to ensure smooth interaction.<br />
83
84 <strong>Talanx</strong> Group Financial report 2010<br />
Controlling elements Key risk management tasks<br />
Supervisory Board<br />
■ Advising and monitoring the Board of Management in its management of the company, inter alia<br />
with respect to risk strategy and risk management<br />
Board of Management<br />
■ Overall responsibility for risk management<br />
■ Definition of the risk strategy<br />
■ Responsible for the proper functioning of risk management<br />
Risk Committee<br />
■ Risk-monitoring and coordinating body, charged especially with the following tasks:<br />
■ Critical observation and analysis of the risk position of the Group as a whole, with particular<br />
attention paid to the risk budget approved by the Board of Management and the risk strategy<br />
■ Monitoring of steering measures within the Group with an eye to risks that could threaten the<br />
Group’s continued existence<br />
Chief Risk Officer<br />
■ Responsible for holistic risk monitoring across divisions (systematic identification and assessment,<br />
control/monitoring and reporting of risks) of all material risks from the Group perspective<br />
Central Risk Management<br />
■ Group-wide risk monitoring function<br />
■ Methodological competence, inter alia for<br />
■ Development of processes/methods for risk assessment, management and analysis,<br />
■ Risk limitation and reporting,<br />
■ Risk monitoring and determination of the required risk capital across the Group<br />
Local Risk Management<br />
■ Risk monitoring function in the divisions<br />
■ Observance of centrally defined guidelines, methods and processes as well as systems of limits<br />
and thresholds that serve as a framework for local implementation, monitoring and reporting.<br />
Internal Auditing<br />
■ Process-independent review of the functional areas of the Group<br />
Independent Auditor<br />
■ Systematic annual review of the risk early-warning system<br />
Risk management process<br />
The <strong>Talanx</strong> Group covers an extensive range of products<br />
with its Group segments – from insurance to fi nancial and<br />
other services. <strong>Talanx</strong> AG and its subsidiaries therefore use<br />
a diverse range of methods and tools to monitor and manage<br />
risks. In accordance with an approach geared to ensuring<br />
comparatively extensive individual responsibility and<br />
decentralization, the subsidiaries each maintain their own<br />
risk management systems; for they are best able to assess<br />
and quantify their risks and implement timely risk controlling<br />
measures. Group Risk Management nevertheless defi nes<br />
guidelines for the structuring of local risk management<br />
systems, thereby assuring a consistent minimum standard<br />
across the Group that can be aggregated.<br />
The risk management process encompasses the identifi cation,<br />
measurement, analysis, evaluation, limitation and<br />
monitoring of risks as well as risk reporting.<br />
We identify risks with the aid of appropriate indicators and<br />
using various risk surveys, in which experts and selected<br />
managers comment on the risk position. Group Risk Management<br />
holds quarterly meetings with local risk managers in<br />
order to remain constantly updated on the risk situation in<br />
the divisions. The risk managers in the divisions report material<br />
changes in the risk position to Group Risk Management<br />
on an ad hoc basis.<br />
In order to measure, analyze and evaluate risks Group<br />
Risk Management derives the risk situation of the <strong>Talanx</strong><br />
Group from the local risks with the aid of an internal risk<br />
capital model. This internal risk capital model enables us to<br />
adequately assess the risks. Still based during the reporting<br />
period in key respects on a refi ned so-called GDV (German<br />
Insurance Association) standard model, it is used for the<br />
analysis and measurement of individual risks as well as of<br />
the Group’s overall risk position. The purpose of risk quantifi<br />
cation is to calculate the risk-based capital on the basis of a<br />
99.97% Value at Risk. The time horizon considered under the<br />
model is a calendar year. The risk model makes allowance for<br />
the eff ects of correlations between Group companies and risk<br />
categories. A stochastic, Solvency II-oriented risk-based capital<br />
model is currently under development that will facilitate<br />
the <strong>Talanx</strong>-wide use of internal models. The Federal Financial<br />
Supervisory Authority (BaFin) began to examine this model<br />
in 2008, and we are seeking to obtain regulatory approval for<br />
its future adoption.
With respect to risk limitation, key indicators have been<br />
specifi ed for steering and monitoring the Group’s material<br />
risks within our central system of limits and thresholds.<br />
Risk steering and monitoring is operationalized through the<br />
specifi cation of suitable limits and thresholds for quantitatively<br />
measurable material risks. Material risks that cannot<br />
be quantifi ed or are diffi cult to quantify (such as operational<br />
risks) are primarily steered and monitored using appropriate<br />
processes and practices.<br />
In the area of risk monitoring we make a distinction, in particular,<br />
between process-integrated independent monitoring<br />
and process-independent monitoring. Process-integrated<br />
independent monitoring is primarily the responsibility of the<br />
Risk Committee, the Chief Risk Offi cer and the organizational<br />
units supporting the CRO. Process-independent monitoring<br />
falls above all to Internal Auditing and the Supervisory Board.<br />
The purpose of our risk reporting is to provide systematic and<br />
timely information about risks and their potential implications<br />
as well as to safeguard adequate internal communication<br />
within the company about all material risks as a basis<br />
for decision-making. Regular reporting on both current business<br />
developments and on risk management ensures that<br />
the Board of Management of <strong>Talanx</strong> AG is kept continuously<br />
informed of risks and can intervene as necessary to take controlling<br />
action; the Supervisory Board is also regularly advised<br />
of the risk situation. Material changes in the risk position are<br />
reported to the Board of Management of <strong>Talanx</strong> AG on an ad<br />
hoc basis.<br />
The potential implications of risks are not only documented<br />
but are also incorporated into the annual planning of the<br />
Group companies, thereby making it possible to allow for<br />
the risks of future development and consider appropriate<br />
countermeasures in a timely manner. The plans drawn up by<br />
all Group companies and the Group as a whole are discussed<br />
and approved by the Board of Management and Supervisory<br />
Board of <strong>Talanx</strong> AG.<br />
Our decision and monitoring processes not only satisfy the<br />
extensive requirements placed on reporting by the Insurance<br />
Supervision Act (VAG), they also extend to the preparation<br />
and examination of the annual and consolidated fi nancial<br />
statements, the internal control system and the use of powerful<br />
planning and controlling tools.<br />
In the year under review our risk management activities in<br />
the area of primary insurance were assessed as “adequate<br />
with positive trend” by Standard & Poor’s. The primary insurance<br />
sector thus achieved the highest rating that can be<br />
attained by insurers without a stochastic internal model. The<br />
risk management of Hannover Re was assessed by S&P as<br />
“strong”, the second-best S&P rating. These ratings testify to<br />
the quality of our holistic risk management approach.<br />
Following SAS 70 Type 1 auditing and certifi cation of Ampega-<br />
Gerling’s control activities in 2009 as evidence of the<br />
adequate structuring of its control system, the Type 2 audit<br />
examination relating to eff ective implementation of the<br />
material controls was successfully passed in 2010.<br />
Accounting-related internal control and<br />
risk management system<br />
The hallmark of risk management within the <strong>Talanx</strong> Group is<br />
its decentralized organizational structure. Responsibilities are<br />
split between local risk management on the level of the divisions<br />
and central risk management on the Group level.<br />
The salient features of the internal control system (ICS) and<br />
risk management system implemented at <strong>Talanx</strong> AG with<br />
regard to the Group accounting process can be described as<br />
follows:<br />
■<br />
■<br />
■<br />
■<br />
■<br />
Management report Opportunity and risk report<br />
There is a clear management and corporate structure. Key<br />
functions that span multiple areas are managed centrally.<br />
The functions of the major relevant areas of Finance and<br />
Accounting, on the one hand, and Controlling, on the<br />
other, are clearly separated with respect to the accounting<br />
process. Areas of responsibility are unambiguously<br />
assigned (separation of functions).<br />
The financial systems used are protected against unau-<br />
thorized access by appropriate measures on the IT side.<br />
Where possible, the relevant systems run standard software.<br />
An adequate system of guidelines (e.g. guidelines on recog-<br />
nition and measurement, working instructions) has been<br />
set up and is constantly updated.<br />
The departments and units involved in the accounting<br />
process have the appropriate quantitative and qualitative<br />
resources at their disposal.<br />
85
86 <strong>Talanx</strong> Group Financial report 2010<br />
■<br />
Controls have been implemented in the accounting-<br />
related process steps: bookkeeping data that is received<br />
or forwarded is checked for completeness and correctness<br />
by the responsible members of staff. The principle of dual<br />
control is consistently applied in this regard. In addition,<br />
programmed plausibility checks are run using databasesupported<br />
software.<br />
With regard to the Group accounting process, integrated controls<br />
ensure that the consolidated fi nancial statement is correct<br />
and complete. The processes relating to the organization<br />
and execution of the consolidation tasks as well as the preparation<br />
of the consolidated fi nancial statement of <strong>Talanx</strong> AG<br />
together with the accompanying controls are documented<br />
in comprehensive ICS documentation. Major components of<br />
the documentation are the Consolidated Financial Statement<br />
Guideline and the Organizational Manual; these are regularly<br />
reviewed and optimized in light of compliance considerations.<br />
Group-internal recognition and measurement rules are<br />
collected in an accounting manual which is available to all<br />
Group companies in IT-supported form and provided to all<br />
employees indirectly or directly involved in the preparation<br />
of individual or consolidated fi nancial statements. The manual<br />
is intended to ensure consistent and correct application<br />
of International Accounting Standards on a Group-wide basis.<br />
It is regularly updated and modifi ed as standards evolve.<br />
Supervision of the local accounting units at the subsidiaries<br />
by staff in Group Accounting safeguards compliance with the<br />
rules contained in the manual.<br />
The consolidated fi nancial statement of <strong>Talanx</strong> AG is drawn<br />
up on the basis of IFRS packages from the included subsidiaries.<br />
To this extent, the risk management measures taken<br />
on the level of the subsidiaries also have implications for<br />
<strong>Talanx</strong> AG.<br />
Reporting by the companies included in the consolidated<br />
fi nancial statement is carried out using an Internet-based<br />
IT application. The items of the balance sheet, statement of<br />
income, statement of comprehensive income, cash fl ow statement,<br />
statement of changes in equity, segment report and<br />
notes as well as data with a bearing on consolidation that are<br />
stored in a database are uploaded to the consolidation system<br />
via interfaces and processed in this system. Internal transactions<br />
within the Group are verifi ed through prior reconciliation<br />
processes and consolidated where necessary. Written<br />
instructions exist in this regard to ensure that an appropriate<br />
procedure is followed. Manual bookings in the consolidation<br />
system are to be released by the responsible members of staff<br />
in the context of a step-by-step process according to set value<br />
limits. Working instructions are also available to support this<br />
process as well as for exceptional and infrequent business<br />
transactions.<br />
The consolidated fi nancial statements of <strong>Talanx</strong> AG are<br />
examined by the independent auditor of the annual accounts<br />
as at the balance sheet date; a review report is drawn up by<br />
the independent auditor on the quarterly interim fi nancial<br />
statements of the Group as well as the IFRS packages of the<br />
companies included therein.<br />
Risks of future development<br />
No specifi c risks can as yet be discerned that could jeopardize<br />
the continued existence of the <strong>Talanx</strong> Group or signifi cantly<br />
impair its assets, fi nancial position or net income. Particularly<br />
with an eye to the further unfolding of the banking crisis,<br />
however, there is a considerable abstract degree of uncertainty.<br />
The same is true of ongoing developments in the legal<br />
framework governing our entrepreneurial activities. Substantial<br />
capital, reserves and underwriting provisions have been<br />
built up in order to cover for the fi nancial consequences of<br />
conceivable risks.<br />
The risk situation of the <strong>Talanx</strong> Group can be broken down<br />
into the risk categories described below. They are based on<br />
German Accounting Standard DRS 5-20:<br />
■<br />
■<br />
■<br />
■<br />
■<br />
underwriting risks<br />
default risks in insurance business<br />
risks associated with financial instruments<br />
operational risks<br />
other risks<br />
The risks described below refer to the next two fi nancial<br />
years.<br />
Eff ects of the banking crisis<br />
The <strong>Talanx</strong> Group, in common with other industry players,<br />
was unable to escape the repercus-sions of the banking crisis<br />
entirely unscathed. Compared to 2008, in which extensive<br />
write-downs were taken on securities owing to the adverse<br />
capital market climate, the situation in 2010 – as in the
previous year – was considerably more relaxed. Having initially<br />
scaled back equity holdings substantially in 2008 and<br />
early 2009, the fi rst moves back into this asset class were<br />
made from the summer of 2009 onwards. On the Group level<br />
the volume of equities held was almost the same as at the<br />
end of 2009, although the portfolio is extensively hedged<br />
against price losses through stop loss mechanisms.<br />
<strong>Talanx</strong>’s exposure is limited by the investment guidelines,<br />
and dependencies on individual debtors that could jeopardize<br />
the Group’s survival are thereby ruled out. In the context<br />
of the advancing banking crisis on capital markets, the <strong>Talanx</strong><br />
Group tightened up its previously applicable risk limits in key<br />
respects so as to further minimize risks.<br />
Should the current low interest rate level be sustained or<br />
indeed should further interest rate cuts ensue, this would<br />
give rise to a considerable reinvestment risk for the life insurance<br />
companies off ering traditional guarantee products<br />
since it would become increasingly diffi cult to generate the<br />
guaranteed return. The Group reduces this interest guarantee<br />
risk primarily by means of interest rate hedges (see under<br />
“Material underwriting risks”). What is more, especially in<br />
the context of further declines in interest rates and higher<br />
volatilities, decreases may be seen in the Market Consistent<br />
Embedded Value (MCEV) of the life insurers. The MCEV for<br />
2010 will be calculated in the fi rst half of 2011.<br />
The contraction in bank lending that has been observed in<br />
the market as part of the banking crisis and the associated<br />
potential diffi culties raising cash are of only minor signifi -<br />
cance to the <strong>Talanx</strong> Group (compared to the banking industry)<br />
for reasons connected with the business model; this is<br />
because <strong>Talanx</strong> inherently has suffi cient cash due to the regular<br />
premium payments and interest income from invested<br />
assets as well as its liquidity-conscious investment <strong>policy</strong>.<br />
Extensive unused lines of credit are also available. Liquidity<br />
risks may, however, arise in particular as a consequence of<br />
illiquid capital markets and – in the life insurance sector –<br />
due to increased cancellations by <strong>policy</strong>holders, if this necessitates<br />
the liquidation of a large volume of additional investments<br />
at short notice.<br />
Furthermore, the uncertainties triggered by the banking<br />
crisis among private and institutional investors may have<br />
implications for the business models of the <strong>Talanx</strong> Group’s<br />
individual divisions, e.g. in the form of a possible soft ening of<br />
demand for insurance coverage.<br />
Management report Opportunity and risk report<br />
Material underwriting risks<br />
In addition to the information provided below, the Notes<br />
contain a detailed and quantitative description of the risks<br />
associated with insurance contracts and fi nancial instruments.<br />
The underwriting risks in property and casualty insurance are<br />
considered separately from those in life insurance because of<br />
the considerable diff erences between them.<br />
Underwriting risks in property/casualty business (primary<br />
insurance and reinsurance) derive principally from the premium/loss<br />
risk and the reserving risk. The premium/loss<br />
risk is the risk that previously defi ned insurance premiums<br />
are used to pay subsequent indemnifi cation, although the<br />
amount of such payments is initially unknown. The actual<br />
claims experience may therefore diverge from the expected<br />
claims experience. This can be attributable to two reasons:<br />
the risk of random fl uctuation and the risk of error.<br />
The risk of random fl uctuation refers to the fact that both the<br />
number and amount of claims are subject to random factors<br />
and the expected claims level may therefore be exceeded. This<br />
risk cannot be excluded even if the claims spread is known.<br />
The risk of error describes the risk of the actual claims spread<br />
diverging from the assumed claims spread. A distinction<br />
is made here between the diagnostic risk and the forecasting<br />
risk. The diagnostic risk refers to the possibility that the<br />
current situation may be misinterpreted on the basis of<br />
the available data. This is particularly likely to occur if only<br />
incomplete data is available regarding claims from previous<br />
insurance periods. The forecasting risk refers to the risk that<br />
the probability distribution of the total claims may change<br />
unexpectedly aft er the estimation is made, for example due<br />
to higher infl ation.<br />
The <strong>Talanx</strong> Group manages and reduces all components of<br />
the premium/loss risk fi rst and foremost through claims<br />
analyses, actuarial modeling, selective underwriting, specialist<br />
audits and regular review of the claims experience as well<br />
as through the use of appropriate reinsurance protection.<br />
87
88 <strong>Talanx</strong> Group Financial report 2010<br />
The second underwriting risk in property/casualty business,<br />
namely the reserving risk, refers to the possibility that the<br />
underwriting reserves may not suffi ce to pay in full claims<br />
that have not yet been settled or reported. This may then<br />
give rise to a need to establish additional reserves. In order<br />
to manage this risk the companies belonging to the <strong>Talanx</strong><br />
Group measure their reserves prudently. They not only<br />
take into account the claims information provided by their<br />
customers but also the insights of their own claims investigations<br />
and experiences. Furthermore, a so-called IBN(E)R<br />
(incurred but not (enough) reported) reserve is constituted<br />
for claims that have probably already occurred but have not<br />
yet been (adequately) reported. What is more, the level of<br />
reserves is regularly reviewed – not only internally but also by<br />
external actuaries – and an external expert assessment of the<br />
reserves is commissioned in order to minimize the reserving<br />
risk. With regard to the run-off results of the loss reserves we<br />
would refer the reader to our comments in the Notes under<br />
“Loss and loss adjustment expense reserve”, pages 219 et<br />
seqq.<br />
The following paragraphs describe the risks associated with<br />
individual lines of property and casualty insurance and subsequently<br />
discuss the risks in life primary insurance and life/<br />
health reinsurance.<br />
Under liability insurance policies we grant the <strong>policy</strong>holder<br />
and any other persons included in the coverage protection<br />
against claims for damages asserted by third parties.<br />
Indemnifi cation is normally provided for bodily injuries and<br />
property damage, although pure fi nancial losses are also<br />
insurable. This also includes motor third party liability insurance.<br />
The agreed sums insured constitute the <strong>policy</strong> limits.<br />
The frequency and amount of claims can be infl uenced by a<br />
number of factors, including for example a change in legislation.<br />
As a result, the number of cases in which claims are<br />
brought before the courts could rise, with corresponding<br />
implications for indemnifi cation payments. Risks may also<br />
be associated with infl ation, since some claims are settled<br />
over a very long period of time. On account of infl ation, for<br />
example, the reserves constituted may not suffi ce to meet<br />
subsequent claim payments. Under liability insurance policies<br />
the (re)insurer is liable for all insured events that occur<br />
during the <strong>policy</strong> period, even if a claim is not discovered<br />
until aft er the <strong>policy</strong> period has ended. We therefore establish<br />
loss reserves not only for claims that have already been<br />
notifi ed, but also for those that have been incurred but not<br />
yet reported (IBNR). The actuarial methods that are used to<br />
calculate these reserves may involve a risk of error due to the<br />
underlying assumptions.<br />
Accident insurance policies provide insurance protection<br />
against the economic repercussions of accidents. Depending<br />
on the consequences of the accident and the <strong>policy</strong><br />
concerned, the Group companies normally pay a daily allowance,<br />
a lump-sum disability benefi t or disability pension or a<br />
death benefi t. The reserves are calculated on the basis of life<br />
actuarial models.<br />
The Group (re)insurance companies calculate their premiums<br />
for liability and personal accident policies using empirical<br />
values and actuarial calculations. They also manage these<br />
risks through their underwriting <strong>policy</strong>. Underwriting guidelines,<br />
which set out inter alia underwriting exclusions and<br />
limits, defi ne criteria for risk selection. These underwriting<br />
guidelines are binding on the underwriters; they are<br />
reviewed annually and modifi ed as necessary. The risk of peak<br />
exposures is also reduced with the aid of reinsurance coverage.<br />
Furthermore, the adequacy of the reserves is regularly<br />
reviewed.<br />
Property insurance policies are taken out in order to obtain<br />
an insurance benefi t for damaged or destroyed property in<br />
the event of a claim. The amount and extent of the losses<br />
covered by such policies are determined in particular by the<br />
costs of rebuilding and restoration or the compensation payable<br />
for contents; in industrial and commercial insurance the<br />
losses resulting from business interruption are also covered.<br />
The benefi ts are, however, limited by the sum insured. Claims<br />
under motor insurance policies may arise out of the replacement<br />
or repair of a destroyed or damaged vehicle.<br />
Underwriting risks are of special importance under these<br />
policies. As a consequence of incorrect pricing assumptions,<br />
inadequate accumulation control or erroneous estimations<br />
of the claims experience, key cash fl ows may diverge from<br />
the expectations underlying the calculation of the premium.<br />
Climate change, in particular, can lead to frequent and severe
weather events (e.g. fl oods or windstorm events) and correspondingly<br />
heavy losses. Considerable claims may arise<br />
under industrial property insurance policies as a consequence<br />
of large individual loss events. In order to limit these<br />
risks we continually monitor possible divergences between<br />
the actual and expected claims experience and, as appropriate,<br />
we revisit the pricing calculations. For example, the<br />
Group companies have an opportunity to adjust prices to<br />
the actual risk situation when policies are renewed. They also<br />
manage these risks through their underwriting <strong>policy</strong>: here<br />
too there are underwriting exclusions and limits that serve<br />
as a criterion for risk selection. Deductibles also apply in<br />
some lines. Substantial individual and accumulation risks are<br />
minimized through the use of carefully selected reinsurance<br />
coverage which protects against peak losses.<br />
For the Hannover Re Group, scenario calculations are performed<br />
in order to identify natural hazards accumulation<br />
risks – particularly for net account – at an early stage. In this<br />
context, for example, simulation models are used to analyze<br />
the worldwide implications of natural disasters due to climate<br />
changes. On the basis of these analyses it is possible to<br />
determine the maximum exposure that Hannover Re should<br />
run for such risks as well as the corresponding retrocession<br />
requirement. Retrocession – i.e. the passing on of risks to<br />
carefully selected reinsurers of long-standing fi nancial quality<br />
– is another vital tool for limiting underwriting risks.<br />
In life primary insurance the insurance <strong>policy</strong> commits the<br />
insurer to either a single or regularly recurring benefi t payment.<br />
The premium calculation in this case is based on an<br />
actuarial interest rate and biometric bases that depend inter<br />
alia on the age of the insured at <strong>policy</strong> inception, the <strong>policy</strong><br />
period and the amount of the sum insured. The main insured<br />
events are the death of the insured person or maturity of the<br />
<strong>policy</strong> (survival).<br />
Typical risks in life insurance are associated with the fact<br />
that policies grant long-term benefi t guarantees: while the<br />
premiums for a given benefi t are fi xed at the inception<br />
of the <strong>policy</strong> for the entire <strong>policy</strong> period, the underlying<br />
parameters (interest rate level, biometric assumptions) may<br />
change. This is also true – to an increasing extent – of the<br />
general legal framework underlying the contractual relationship;<br />
risk-entailing changes in this regard are discussed<br />
further under “Material operational risks”.<br />
Management report Opportunity and risk report<br />
Biometric actuarial bases such as mortality, longevity and<br />
morbidity are established at the inception of a contract in<br />
order to calculate premiums and reserves. Over time, however,<br />
these assumptions may prove to be no longer accurate<br />
and may therefore necessitate additional expenditures to<br />
increase the benefi t reserve. The adequacy of the biometric<br />
actuarial bases is therefore regularly reviewed.<br />
Epidemics, a pandemic or a worldwide shift in lifestyle habits<br />
may pose special risks to contracts under which death is<br />
the insured risk. Under annuity policies the risk derives fi rst<br />
and foremost from the continuous improvement in medical<br />
care and social conditions, thereby increasing longevity –<br />
with the result that insureds draw benefi ts for a longer time<br />
than calculated.<br />
Reserves calculated on the basis of assumptions regarding<br />
the development of biometric data such as mortality or disability<br />
serve to ensure that the commitments under these<br />
policies can always be met. Specially trained life actuaries<br />
use safety loadings to make sure that the actuarial bases<br />
also make suffi cient allowance for risks of change.<br />
In addition, life insurance policies entail lapse risks. In<br />
the event of an unusual accumulation of cancellations it<br />
is possible, for example, that suffi cient liquid assets may<br />
not be available to cover insurance benefi ts. This can give<br />
rise to the unplanned realization of losses on the disposal<br />
of assets. For this reason, the Group’s life insurers invest<br />
a suffi ciently large asset portfolio in short-term holdings.<br />
They also regularly match and control the duration of their<br />
assets and liabilities. What is more, receivables due from<br />
insurance agents may be lost in the event of cancellation<br />
if the accounts receivable from intermediaries cannot be<br />
collected. Insurance intermediaries are therefore carefully<br />
selected. Cancellation may also create a cost risk if new<br />
business collapses and the fi xed costs – unlike the variable<br />
costs – cannot be directly reduced. Cost controlling and a<br />
focus on variable sales costs through distribution channels<br />
such as brokers limit this risk.<br />
89
90 <strong>Talanx</strong> Group Financial report 2010<br />
An interest guarantee risk exists under life insurance policies<br />
with guaranteed interest payments. This risk arises<br />
if, upon inception of a life insurance <strong>policy</strong>, a guaranteed<br />
interest rate is agreed on the savings element of the premium.<br />
The interest guarantee risk has been exacerbated<br />
by the reform of the Insurance Contract Act inasmuch as<br />
<strong>policy</strong>holders are entitled to participate in the unrealized<br />
reserves upon <strong>policy</strong> termination. The insurance premiums<br />
must be invested at appropriate terms on the capital<br />
market in order to generate this guaranteed return. Yet the<br />
capital market fl uctuates over time; future investments are<br />
thus subject to the risk of poorer conditions. What is more,<br />
the duration of the investments is generally shorter than<br />
the duration of the insurance contracts, hence creating a<br />
reinvestment risk. An interest rate risk also exists in connection<br />
with guaranteed surrender values. A rapidly rising<br />
interest rate level, for example, may give rise to hidden<br />
obligations. If contracts were to be terminated prematurely<br />
the <strong>policy</strong>holders would be entitled to the guaranteed surrender<br />
values and would not share in any incurred hidden<br />
losses. Upon disposal of the corresponding investments the<br />
hidden losses would have to be borne by the life insurers,<br />
and in theory it is possible that the fair market value of the<br />
investments would not suffi ce to cover the guaranteed surrender<br />
values. As a further factor, the change in the distribution<br />
of acquisition costs brought about by amendment<br />
of the Insurance Contract Act will lead to higher surrender<br />
values in the initial phase. The Group reduces the interest<br />
guarantee risk primarily by constantly monitoring the asset<br />
portfolios and capital markets and taking appropriate countermeasures.<br />
To some extent interest rate hedging instruments,<br />
known as swaptions and book yield notes, are used.<br />
For a large part of our life insurance portfolio the interest<br />
guarantee risk is reduced through contractual provisions<br />
The surplus distributions paid in addition to the guaranteed<br />
interest rate can be adjusted according to the state of the<br />
capital market. Under unit-linked life insurance policies<br />
the investment risks and opportunities are borne by <strong>policy</strong>holders.<br />
The investment risks could, however, be shift ed<br />
back onto the life insurers as a consequence of adverse legal<br />
developments.<br />
Particularly for the entire German life insurance industry<br />
and hence also for the Group’s life insurers, the protracted<br />
low level of interest rates poses the risk that successive<br />
strengthening of the interest provisions may be needed. With<br />
this in mind, the Federal Ministry of Finance forwarded a<br />
draft ordinance amending the Mathematical Provisions Act<br />
(Deckungsrückstellungsverordnung) to the German Insurance<br />
Association (GDV) and other associations in December<br />
2010 with a request for comments. The aim is to facilitate<br />
the early, gradual establishment of an additional interest<br />
provision.<br />
In life and health reinsurance the previously described<br />
biometric risks are of special importance. The reserves in<br />
life and health reinsurance are based principally upon the<br />
information provided by ceding companies. The plausibility<br />
of the fi gures is checked using reliable biometric actuarial<br />
bases. Through our quality assurance measures we<br />
ensure that the reserves established by ceding companies<br />
in accordance with local accounting principles satisfy all<br />
requirements with respect to the calculation methods used<br />
and assumptions made (e.g. use of mortality and morbidity<br />
tables, assumptions regarding the lapse rate). The Group<br />
writes new business in all regions in compliance with<br />
globally applicable underwriting guidelines which set out<br />
detailed rules governing the type, quality, level and origin of<br />
risks and are revised annually. Special underwriting guidelines<br />
give due consideration to the particular features of<br />
individual markets. By monitoring compliance with these<br />
underwriting guidelines the Group minimizes the potential<br />
credit risk stemming from an inability to pay or deterioration<br />
in the fi nancial status of cedants. Regular reviews and<br />
holistic analyses (e.g. with an eye to lapse risks) are carried<br />
out with respect to new business activities and the assumption<br />
of international portfolios. The interest rate risk, which<br />
in the primary sector is important in life business owing to<br />
the guarantees that are given, is of only minimal relevance<br />
in life and health reinsurance owing to the structure of the<br />
contracts.
A key risk management tool in the areas of life insurance<br />
and life/health reinsurance is systematic monitoring of<br />
the Market Consistent Embedded Value (MCEV). Sensitivity<br />
analyses highlight the areas where the Group is exposed<br />
and provide pointers as to which areas to focus on from the<br />
risk management perspective.<br />
Default risks under insurance business<br />
Bad debts may arise on receivables due under insurance business.<br />
This applies, in particular, to receivables due from reinsurers,<br />
retrocessionaires, <strong>policy</strong>holders and insurance agents.<br />
Value adjustments or write-downs on receivables would be<br />
the result.<br />
The Group counteracts the default risk at reinsurers and<br />
retrocessionaires by carefully selecting them with the aid of<br />
expertly staff ed Credit Committees, constantly monitoring<br />
their credit status and – where necessary – taking appropriate<br />
measures to secure receivables. Depending upon the type<br />
and expected run-off period of the reinsured business as well<br />
as a required minimum capital adequacy, the selection of<br />
reinsurers and retrocessionaires is guided by our own credit<br />
assessments as well as the minimum ratings of the rating<br />
agencies Standard & Poor’s and A. M. Best.<br />
The default risk at <strong>policy</strong>holders is countered fi rst and foremost<br />
by means of an eff ective collection procedure and<br />
the reduction of outstandings. Agents are subject to credit<br />
checks. In addition, adequate general bad debt provisions are<br />
established to allow for the default risk.<br />
Material risks associated with fi nancial instruments<br />
Risks associated with fi nancial instruments should be considered<br />
in particular in the context of the investment <strong>policy</strong>.<br />
Based on a Group investment guideline, the investment <strong>policy</strong><br />
at the individual companies is regulated within the <strong>Talanx</strong><br />
Group by the supervisory framework applicable to each particular<br />
company and by internal investment guidelines.<br />
Particularly in the interests of <strong>policy</strong>holders as well as with a<br />
view to accommodating the future requirements of the capital<br />
market, the investment <strong>policy</strong> is essentially guided by the<br />
following maxims:<br />
■<br />
■<br />
■<br />
optimizing the return on investments while at the same<br />
time preserving a high level of security<br />
ensuring liquidity requirements are satisfied at all times<br />
(solvency)<br />
risk diversification (mix and spread)<br />
An essential component of risk management is the principle<br />
of separation of functions – i.e. keeping a distinction between<br />
Portfolio Management, Settlement and Risk Controlling.<br />
Risk Controlling – which is organizationally and functionally<br />
separate from Portfolio Management – bears respon-sibility<br />
above all for monitoring all risk limits and evaluating fi nancial<br />
products. In this respect the management and control<br />
mechanisms are geared particularly closely to the standards<br />
adopted by the Federal Financial Supervisory Authority<br />
(BaFin) and the respective local regulators.<br />
Within the scope of the Group guidelines, detailed investment<br />
guidelines are in force for individual companies,<br />
compliance with which is constantly monitored. These investment<br />
guidelines serve to defi ne the framework of the investment<br />
strategy and are therefore guided by the principles<br />
set out in § 54 of the Insurance Supervision Act (VAG), which<br />
envisages the greatest possible level of security and profi tability<br />
while ensuring liquidity at all times and preserving<br />
an appropriate mix and spread of the portfolio. Monitoring<br />
of the quotas and limits set out in these guidelines is the<br />
responsibility of Group Risk Management and local risk managers<br />
as well as the Chief Financial Offi cer of each company.<br />
Any signifi cant modifi cation of the investment guidelines<br />
and/or investment <strong>policy</strong> must be approved by the Board of<br />
Management of the company concerned and brought to the<br />
attention of its Supervisory Board.<br />
Risks associated with fi nancial instruments consist most<br />
notably of market price, credit and liquidity risks. With<br />
regard to the scope and extent of these risks please see<br />
our comments in the Notes under “Nature of risks associated<br />
with insurance contracts and fi nancial instruments”,<br />
pages 166 et seqq.<br />
Management report Opportunity and risk report<br />
91
92 <strong>Talanx</strong> Group Financial report 2010<br />
Market price risks<br />
Market price risks derive from the potential loss due to<br />
adverse changes in market prices and may be attributable to<br />
changes in interest rates, equity prices and exchange rates.<br />
These can lead to impairments or result in realized losses<br />
upon disposal of fi nancial assets.<br />
The portfolio of fi xed-income securities is exposed to the<br />
interest rate risk. Declining market yields lead to increases<br />
and rising market yields to decreases in the fair value of the<br />
fi xed-income securities portfolio. The credit spread risk should<br />
also be mentioned. The credit spread refers to the interest rate<br />
diff erential between a risk-entailing bond and risk-free bond<br />
of the same quality. Changes in these risk premiums, which<br />
are observable on the market, result – analogously to changes<br />
in pure market yields – in changes in the fair values of the corresponding<br />
securities. A fall in the level of interest rates can<br />
also lead to lower investment income. The Group reduces the<br />
resulting interest guarantee risk primarily by means of interest<br />
rate hedges (see under “Material underwriting risks”).<br />
Share price risks derive from unfavorable changes in the value<br />
of equities, equity derivatives or equity index derivatives held<br />
in the portfolio. We spread these risks through systematic<br />
diversifi cation in various sectors and regions. The equity portfolio<br />
is also extensively hedged against price losses through<br />
stop loss mechanisms.<br />
Currency risks result from exchange rate fl uctuations – especially<br />
if there is a currency imbalance between the technical<br />
liabilities and the assets. When it comes to managing the currency<br />
risk, we check that matching currency cover is maintained<br />
at all times. The risk is limited by investing capital<br />
wherever possible in those currencies where obligations are<br />
to be fulfi lled under insurance contracts.<br />
Investments in alternative asset classes such as private equity<br />
and hedge funds are limited and regularly monitored using a<br />
conservative control mechanism. The hedge funds are entirely<br />
transparent for the individual companies and are reviewed<br />
daily with an eye to liquidity, leverage and exposure.<br />
Real estate risks may result from unfavorable changes in the<br />
value of real estate held either directly or through fund units.<br />
They may be caused by a deterioration in the particular qualities<br />
of a property or by a general downslide in market values<br />
(such as a real estate crash). In the case of direct investments<br />
in real estate, the yield and other key performance indicators<br />
(e.g. vacancies and arrears) are measured on the level of individual<br />
properties and the portfolio as a whole. Risk controlling<br />
for indirect real estate investments, as with private equity<br />
funds, is based on regular monitoring of the development and<br />
performance of the funds.<br />
The <strong>Talanx</strong> Group enters into derivative transactions in particular<br />
to hedge against price risks or interest rate risks aff ecting<br />
existing assets, to prepare the subsequent purchase of securities<br />
or to generate additional earnings on existing securities.<br />
The use of derivative products is regulated by internal guidelines<br />
in order to ensure the most effi cient and risk-free possible<br />
use of forward purchases, derivative fi nancial instruments<br />
and structured products and to satisfy regulatory requirements.<br />
The use of such instruments is thus subject to very<br />
strict limits. The parameters of the investment guidelines and<br />
the legal parameters for derivative fi nancial instruments and<br />
structured products are updated and constantly monitored in<br />
the system of limits. Derivative positions and transactions are<br />
specifi ed in detail in the reporting.<br />
We reduce potential market price risks through a variety of<br />
risk-controlling mechanisms. One important measure for<br />
monitoring and steering market price risks is constant analysis<br />
of the Value at Risk (VaR), which is increasingly evolving<br />
from as assets-side measurement approach to an asset/liability<br />
concept. The VaR is determined on the basis of historical<br />
data, e.g. the volatility of the fair values and the correlation<br />
between risks. As part of these calculations the decline in the<br />
fair value of our portfolio is simulated with a given probability<br />
and within a certain period. Stress tests are further vital<br />
risk controlling tools. The experts at AmpegaGerling Asset<br />
Management GmbH simulate possible market changes that<br />
can result in considerable price and interest rate losses for<br />
the bulk of the securities. In addition, market price risks are<br />
established using enterprise-specifi c stress tests and those<br />
required by regulators with the corresponding fi xed stress test<br />
parameters.
Credit risks<br />
Credit risks refer to the possible fall in the value of assets due<br />
to the failure of a debtor or a change in their ability to pay. As<br />
a consequence, fi nancial assets may become non-performing<br />
with a corresponding need to take a value adjustment or<br />
write-down. Particularly in the area of profi t-participating<br />
loans, there is a risk of default on interest payments. The<br />
rating classes assigned by rating agencies such as S&P and<br />
Moody’s are a key pointer for investment decisions taken by<br />
Portfolio Management. If a rating cannot be ascertained in<br />
this way, an internal rating is determined. This is done by<br />
way of mark-ups and mark-downs on existing ratings of the<br />
issuer or of instruments with diff erent features from the<br />
same issuer. The credit risks to be monitored consist of counterparty<br />
risks and issuer’s risks. Risks of counterparty default<br />
are controlled using specifi ed counterparty lists and by monitoring<br />
the limits defi ned for each rating class. Adherence to<br />
defi ned issuer limits (Group limits and/or company limits)<br />
is monitored by Risk Controlling. In the event of mergers<br />
among issuers that increase accumulations, we examine the<br />
legal scope for requiring collateral to be furnished as security.<br />
Liquidity risks<br />
We take liquidity risks to mean the risk of being unable to<br />
convert investments and other assets into cash in a timely<br />
manner in order to meet our fi nancial obligations when they<br />
become due. Thus, for example, it may not be possible to<br />
sell holdings (or to do so only with delays) or to close open<br />
positions (or to do so only with price markdowns) due to the<br />
illiquidity of the markets. In general terms, the Group continuously<br />
generates signifi cant liquidity positions because<br />
premium income normally accrues well before claim payments<br />
and other benefi ts need to be rendered. We counteract<br />
liquidity risks through regular liquidity planning as well as<br />
continuous reconciliation of the maturities of investments<br />
with the fi nancial obligations. A liquid asset structure ensures<br />
that the Group is able to make the necessary payments at all<br />
times. The expected due dates – among other considerations<br />
– are taken as a basis for the payment obligations, making<br />
allowance for the run-off pattern of the reserves.<br />
In order to monitor liquidity risks each type of security is<br />
assigned a liquidity code that indicates how quickly a security<br />
can be sold. These codes are regularly reviewed by Portfolio<br />
Management. The plausibility of changes is checked by<br />
Risk Controlling and, where appropriate, the codes are modifi<br />
ed. The data is subsequently included in the standardized<br />
portfolio reporting provided to the Chief Financial Offi cers.<br />
Compliance with the defi ned minimum and maximum limits<br />
for liquidity is observed. Overstepping of any risk limits<br />
is immediately reported to the Chief Financial Offi cers and<br />
Portfolio Management.<br />
The Group also optimizes the availability of liquid funds<br />
using cash pools within the various Group companies which<br />
facilitate management of their cash infl ows and outfl ows.<br />
Material operational risks<br />
Management report Opportunity and risk report<br />
In our understanding, this category encompasses the risk of<br />
losses occurring because of the inadequacy or failure of internal<br />
processes or as a result of events triggered by employeerelated,<br />
system-induced or external factors. The operational<br />
risk also extends to legal risks.<br />
Multifaceted, cause-based risk management and an effi cient<br />
internal control system minimize such risks, which may be<br />
associated with business activities of all types, members of<br />
staff or technical systems. In addition to Internal Auditing,<br />
the Compliance function also bears responsibility for overseeing<br />
compliance with applicable laws as well as with external<br />
and internal guidelines.<br />
Legal risks may arise in connection with contractual agreements<br />
and the general legal environment, especially with<br />
respect to business-specifi c imponderables of commercial<br />
and tax law as they relate to an internationally operating life<br />
and property/casualty insurer as well as a life/health and<br />
non-life reinsurer. Insurers and reinsurers are also dependent<br />
on the political and economic framework conditions prevailing<br />
on their respective markets. These external risks are subject<br />
to intense monitoring by the <strong>Talanx</strong> Board of Management<br />
on behalf of the entire Group and as part of an ongoing<br />
exchange of information with local management.<br />
93
94 <strong>Talanx</strong> Group Financial report 2010<br />
We view with some concern the extensions of government<br />
powers to intervene in banks if there is a danger of them<br />
falling below the ratios set by regulators. Particularly with<br />
respect to profi t participation certifi cates (Genussscheine)<br />
and silent partners’ contributions (stille Einlagen), the Bank<br />
Restructuring Act has exacerbated the risk of state intervention<br />
to the detriment of institutional investors as well as<br />
the investing insurance industry and hence also insurance<br />
customers. What is more, a fi nancial tax (fi nancial transaction<br />
tax and fi nancial activity tax) is envisaged or has already<br />
been implemented in various countries in order to at least<br />
partially fund the costs of the banking crisis. There is a risk<br />
that such a levy could also impact the Group.<br />
In addition, against the backdrop of the banking crisis, the<br />
G20 nations discussed the adoption of surcharges on capital<br />
for insurers similar to those for systemically-relevant banks.<br />
It apparently remains to be seen just what form such a capital<br />
surcharge is supposed to take at the insurers under consideration.<br />
If, however, the general thrust of the bank plans is<br />
carried over to the insurance industry, large insurance undertakings<br />
– and hence potentially also the <strong>Talanx</strong> Group – could<br />
fi nd themselves faced with exacting new capital requirements.<br />
It should, though, be mentioned in this context that<br />
Frankfurt Administrative Court already expressed serious<br />
doubts as to the possible systemic relevance of the <strong>Talanx</strong><br />
Group during the fi nal closure of other legal proceedings.<br />
There are also proceedings pending before the courts, especially<br />
with respect to life insurance, that could have implications<br />
for the entire German insurance industry and hence<br />
also for the <strong>Talanx</strong> Group once their outcome is legally fi nal.<br />
This includes, for example, the question of how to deal with<br />
a monthly, quarterly or half-yearly method of payment in<br />
insurance contracts.<br />
The <strong>Talanx</strong> Group – in common with the entire insurance<br />
industry – is also facing far-reaching changes against the<br />
backdrop of the impending and in some cases already implemented<br />
reform of regulatory standards, especially in the context<br />
of IFRS, Solvency II and the Minimum requirements for<br />
Risk Management in Insurance Undertakings (MaRisk VA). We<br />
are tracking the accounting and regulatory changes closely;<br />
we have identifi ed the associated more exacting requirements<br />
and initiated measures to refi ne our risk management<br />
accordingly and hence enable us to satisfy the more complex<br />
and extensive standards going forward.<br />
Along with legal risks, the other operational risks include<br />
the failure of data processing systems and data security.<br />
Ensuring the availability of applications and protecting the<br />
confi dentiality and integrity of data are of vital importance<br />
to the <strong>Talanx</strong> Group. Since the global sharing of information<br />
increasingly takes place via electronic data transfer, this<br />
also creates a vulnerability to computer viruses. Systematic<br />
investment in the security and availability of information<br />
technology preserves and enhances the existing high level<br />
of security.<br />
Operating risks may also arise in the area of human resources,<br />
for example due to a lack of the skilled experts and managers<br />
necessitated by an increasingly complex business with a<br />
strong customer orientation. The Group therefore attaches<br />
great importance to further and advanced training activities.<br />
With the aid of individual development plans and appropriate<br />
skills enhancement opportunities members of staff are<br />
thus able to respond to the latest market requirements. What<br />
is more, state-of-the-art management tools and appropriate<br />
incentive schemes – both monetary and non-monetary –<br />
foster strong employee motivation. <strong>Talanx</strong> counters the risk<br />
of personnel committing fraudulent acts to the detriment<br />
of the company with internal guidelines governing areas of<br />
competence and processing workfl ows as well as with regular<br />
specialist checks and audits.<br />
On the marketing side the <strong>Talanx</strong> Group works together with<br />
external agents, brokers and a number of cooperation partners.<br />
In this respect there is, of course, an immanent risk that<br />
marketing agreements can be impacted by external infl uences<br />
– with a corresponding potential for the loss of new<br />
business and erosion of the in-force portfolios.<br />
Other material risks<br />
Of material importance to our company in the category of<br />
other risks are primarily emerging risks, strategic risks and<br />
reputational risks. Other risks also include participation risks<br />
of <strong>Talanx</strong> AG.<br />
The hallmark of emerging risks (such as in the fi eld of nanotechnology<br />
or in connection with climate change) is that the<br />
content of such risks cannot as yet be reliably assessed – especially<br />
with respect to our in-force portfolio. Such risks evolve
gradually from weak signals to unmistakable tendencies. It is<br />
therefore vital to detect these risks at an early stage and then<br />
determine their relevance. For the purpose of early detection<br />
we have developed an effi cient process that spans divisions<br />
and ensures the linkage to risk management, thereby making<br />
it possible to pinpoint any necessary measures (e.g. ongoing<br />
observation and evaluation, the implementation of contractual<br />
exclusions or the development of new (re)insurance<br />
products).<br />
Strategic risks derive from the risk of an imbalance between<br />
the corporate strategy and the constantly changing general<br />
business environment. Such an imbalance might be caused,<br />
for example, by incorrect strategic <strong>policy</strong> decisions or a<br />
failure to consistently implement the defi ned strategies. We<br />
therefore review our corporate strategy and risk strategy<br />
annually and adjust our processes and structures as required.<br />
With Project Fokus, for example, <strong>Talanx</strong> is seeking to implement<br />
the restructuring of the Group that has been decided<br />
upon to improve its market positioning. The core of the new<br />
structure is a reconfi guration of the Group segments in primary<br />
insurance business with a view to being able to operate<br />
more successfully in the market. It is geared to customer segments<br />
– specifi cally, to industrial lines transacted worldwide<br />
as well as to German and international retail business, in<br />
both cases spanning the various insurance lines. Operational<br />
risks, in particular, could arise during the project in connection<br />
with the simplifi cation of processes within the central<br />
functions. We counter the operational risks most notably<br />
with a multi-site concept that serves to reduce the potential<br />
for staff turnover.<br />
The reputational risk is the risk associated with possible damage<br />
to the company’s name as a consequence of an unfavorable<br />
public perception (e.g. among customers, business partners,<br />
government agencies). Management of this risk is made<br />
possible by our set communication channels, a professional<br />
approach to corporate communications, tried and tested processes<br />
for defi ned crisis scenarios as well as our established<br />
Code of Conduct.<br />
Other risks also encompass the participation risks of <strong>Talanx</strong><br />
AG, especially those associated with the performance of<br />
subsidiaries, the stability of results in the portfolio of participating<br />
interests and a potentially inadequate balance in the<br />
business. Through profi t transfer agreements and dividend<br />
payments <strong>Talanx</strong> AG participates directly in the business<br />
development and risks of the subsidiaries. What is more,<br />
negative results trends at the subsidiaries can prompt a need<br />
to write down the book values of participating interests at<br />
<strong>Talanx</strong> AG.<br />
The Group uses appropriate tools in the areas of controlling,<br />
internal auditing and risk management to counter risks<br />
arising out of the development of results at subsidiaries. A<br />
standardized reporting system regularly provides decisionmakers<br />
with the latest information not only about the Group<br />
but also about the business development at all major subsidiaries.<br />
They are thus able to intervene at all times in order<br />
to control risks. Risks associated with a lack of stability in the<br />
results of the portfolio of participating interests or with an<br />
inadequate business balance are reduced for the various risk<br />
sources primarily by means of segmental and regional diversifi<br />
cation, appropriate strategies for risk minimization and<br />
risk shift ing as well as by investing systematically in growth<br />
markets and in product and portfolio segments that stabilize<br />
results.<br />
The risk of asset erosion on acquisitions or their inadequate<br />
profi tability is kept as low as possible through intensive due<br />
diligence checks conducted in cooperation with independent<br />
professional consultants and auditors as well as close monitoring<br />
of the business development. Furthermore, <strong>Talanx</strong><br />
pays close attention to risks deriving from the fi nancing of<br />
acquisitions and those associated with the capital needs of<br />
subsidiaries as well as their anticipated profi tability. It counters<br />
the fi nancing risk by compiling regularly updated cash<br />
fl ow statements and forecasts and by defi ning priorities for<br />
the application of funds.<br />
Opportunities<br />
Management report Opportunity and risk report<br />
This subsection describes signifi cant opportunities open<br />
to the Group. The ability to act on opportunities is a major<br />
entrepreneurial challenge. The opportunities discussed here<br />
refer to the next two fi nancial years.<br />
95
96 <strong>Talanx</strong> Group Financial report 2010<br />
Opportunities associated with the development of the<br />
business environment<br />
The emergence of two markets off ering considerable growth<br />
potential can currently be observed in connection with demographic<br />
change: in the fi rst place, the “market for senior citizens”,<br />
and, secondly, the “market for young customers”, who<br />
need to take out additional provision at their own responsibility<br />
in response to the diminishing benefi ts aff orded by<br />
social welfare systems. In 2010 around 33 million Germans<br />
will be over the age of 50. It is already apparent that seniors<br />
today cannot be equated with the traditional pensioner of<br />
the past. This is clear not only from their growing use of services,<br />
for which there is a considerable willingness and ability<br />
to pay; the shift is also and more signifi cantly illustrated<br />
by the fact that this customer group is increasingly active<br />
and hence exposed more than previous generations to risks<br />
against which they need protection. For providers, then, it<br />
is not simply a matter of supplementing existing products<br />
with assistance benefi ts; rather, innovatively designed products<br />
must be off ered to cover these newly emerging needs.<br />
By way of example, we may cite here products for secondary<br />
residences, extensive foreign travel, sporting pursuits<br />
conducted well into advancing years or the handing down of<br />
assets to children. At the same time, young customers, too,<br />
are becoming increasingly aware of the issue of fi nancial<br />
security in old age. This potential can be tapped into through<br />
a broad range of (state-subsidized) individual provision products<br />
and attractive employer off erings for occupational retirement<br />
provision. For this customer group we currently expect<br />
a stronger demand trend for retirement provision products<br />
with fl exible saving and dissaving phases. Based on their<br />
comprehensive range of products with innovative solutions<br />
and their sales positioning across a broad front, the life insurance<br />
companies within the Group are well placed to profi t<br />
disproportionately strongly from the “seniors’ market” and<br />
the “young customers’ market”.<br />
Trust in banks and bank-related products (including unitlinked<br />
life insurance) took a battering from the fi nancial<br />
crisis. Although equity markets have rallied of late, a considerable<br />
degree of uncertainty and fear regarding stock market<br />
volatility still prevails among <strong>policy</strong>holders in light of the<br />
experience of the banking and economic crisis. In Europe,<br />
the United States and Asia (life) insurers had increasingly<br />
concentrated on the sale of “modern”, fl exible products tied<br />
to movements on stock markets. Some voices in the industry<br />
are now predicting an ever more likely renaissance of prod-<br />
ucts with guarantees. The life insurers within the Group may<br />
profi t disproportionately strongly from this turn of events<br />
thanks to their innovative products.<br />
We expect general growth stimuli for non-life reinsurance to<br />
come from the more exacting requirements placed on companies’<br />
risk-based capital resources; for them, the transfer of<br />
risk to reinsurers with good ratings off ers an economically<br />
attractive alternative. The general framework conditions in<br />
international life and health reinsurance can in principle<br />
be described as favorable for the next two years. In mature<br />
insurance markets such as the United States, Japan, United<br />
Kingdom and Germany this assessment is colored by the<br />
demographic trend, which is refl ected in heightened awareness<br />
of the need for individual provision. This is especially<br />
advantageous for annuity and health insurance products.<br />
Increasing urbanization in leading emerging markets such as<br />
China, India and Brazil is fostering a rapidly growing middle<br />
class, which to a greater extent than before is clamoring for<br />
insurance solutions designed to protect surviving dependents<br />
and aff ord individual retirement provision for <strong>policy</strong>holders.<br />
Opportunities created by the company<br />
The previously described restructuring of the Group is<br />
designed to improve its market positioning. The modifi ed<br />
confi guration of the Group segments in primary insurance<br />
business will enable us to operate more successfully in the<br />
market. In addition, the project opens up cost-cutting potential<br />
over the medium term.<br />
The capital participation and cooperation entered into with<br />
Meiji Yasuda Life in November 2010 will open up further<br />
international business opportunities for the foreign expansion<br />
of the <strong>Talanx</strong> Group.<br />
Promising sales channels: bancassurance, brokers, Internet<br />
The proportion of life insurance business in Germany deriving<br />
from bancassurance is expected to rise to 31% in 2012<br />
(currently 26%). This growth in the life insurance sector is<br />
supported by the demographic shift as well as trends on<br />
insurance and banking markets. Looked at across all European<br />
countries, bancassurance sales of non-life products currently<br />
account for only around 10% of the total sales capacity.
Following the changes of ownership aff ecting the existing<br />
cooperation partners in the bancassurance sector, the new<br />
owners have in each case decided to maintain the cooperation<br />
arrangements. Firstly, the former Citibank Privatkunden<br />
AG & Co. KGaA was renamed TARGOBANK eff ective 22. February<br />
2010 and with a fresh orientation is now in a position to<br />
reaffi rm the confi dence of its customers. The CiV insurers<br />
changed their name to Targo so as to continue to underscore<br />
the exclusive nature of the partnership. As anticipated, sales<br />
again fared well following the roll-out of the “Enhanced Banking<br />
System” and the new sales system VERS at TARGOBANK.<br />
Secondly, Postbank was taken over by Deutsche Bank: the<br />
integration of DWS products into the unit-linked tariff s of PBV<br />
Lebensversicherung AG is intended to bring about a situation<br />
which satisfi es the interests of all contracting parties.<br />
With a view to jointly developing credit life business in Europe,<br />
<strong>Talanx</strong> and Rheinland Versicherungsgruppe together established<br />
an agency company, Credit Life International Services.<br />
In addition, two insurance companies based in Hilden were<br />
established under the Credit Life brand. Following completion<br />
of the currently ongoing licensing procedure of the Federal<br />
Financial Supervisory (BaFin), they will trade as Credit<br />
Life International Lebensversicherung AG and – for non-life<br />
business – Credit Life International Versicherung AG. This will<br />
further promote diversifi cation in the markets served by the<br />
segment.<br />
<strong>Talanx</strong> AG has agreed upon a partnership with Swiss Life and<br />
acquired a long-term equity stake of almost 10% in order<br />
to cement this cooperation. As part of the cooperation it is<br />
envisaged that the <strong>Talanx</strong> companies will become a major<br />
product partner of AWD. In addition, <strong>Talanx</strong> has acquired<br />
an interest of just under 10% in MLP. Both MLP and the AWD<br />
Group, which has belonged to Swiss Life since last year, are<br />
signifi cant sales partners in life insurance business. At this<br />
moment in time it is not possible to defi nitively assess what<br />
eff ects the <strong>Talanx</strong> stake in MLP/Swiss Life will have on new<br />
business. The extension of the involvement in Swiss Life<br />
presents an opportunity not only to maintain the business<br />
relationships with the brokers in question on a stable level<br />
but also to further expand them.<br />
We see opportunities through the refi nement of Internet<br />
tariff s inter alia with respect to HDI Direkt Versicherung,<br />
for example through their extension to other lines such as<br />
householders’ insurance.<br />
Management report Opportunity and risk report. Events of special signifi cance after the balance sheet date<br />
Events of special significance<br />
after the balance sheet date<br />
Events that could have an infl uence on our fi nancial position,<br />
net income or assets are described in the following forecast<br />
and in the subsection of the Notes entitled “Events aft er the<br />
balance sheet date”, pages 254 et seq.<br />
97
98 <strong>Talanx</strong> Group Financial report 2010<br />
Forecast<br />
The following remarks about the expected development of<br />
the <strong>Talanx</strong> Group and its business environment are subjective<br />
assessments. They are based on well-founded expert<br />
assessments as well as plans and forecasts that we consider<br />
coherent but the materialization of which is uncertain.<br />
Although we arrived at the underlying assumptions with<br />
great diligence and to the best of our knowledge, the possibility<br />
cannot be ruled out – in view of the fundamental uncertainties<br />
applicable to statements regarding the future – that<br />
actual developments may diverge from the developments<br />
anticipated here. Forecasting reliability has been made even<br />
more diffi cult by the global interlinking of economic relations<br />
and capital markets. Even though signs of an upturn<br />
are currently emerging in large areas of the global economy,<br />
the danger of fresh setbacks cannot be underestimated. What<br />
is more, it should be borne in mind that there is a time lag<br />
before the relevant macroeconomic infl uencing factors make<br />
themselves felt on the insurance markets. For this reason, too,<br />
some aft er-eff ects of the recent fi nancial and economic crisis<br />
will probably continue to reverberate in the insurance industry<br />
in the years ahead.<br />
Economic environment<br />
We expect the economic recovery to be sustained in 2011.<br />
Developments will, however, continue to be very mixed. The<br />
most vigorous growth will be generated in emerging markets,<br />
which are benefi ting from a rebound in domestic consumption<br />
and comparatively low levels of indebtedness. Many<br />
developed nations, on the other hand, will struggle under<br />
heavy debt burdens. These structural imbalances will have<br />
adverse implications for potential growth in the aff ected<br />
countries. This is especially true of countries on the Eurozone<br />
periphery, where the indispensable government austerity<br />
packages to reduce debt are putting the brakes on public<br />
and private consumption expenditure and hence curtailing<br />
growth. Germany, on the other hand, will profi t more heavily<br />
from the favorable development of emerging markets<br />
through its export-oriented growth model and should again<br />
outpace Eurozone growth in the coming year. For the United<br />
States, too, we anticipate continued recovery and growth in<br />
excess of the Eurozone. Given the large proportion of gross<br />
domestic product attributable to domestic consumption, the<br />
development of the US economy depends in large measure<br />
on the state of the labor market. We expect the gradual easing<br />
here to be sustained, although minor setbacks from time to<br />
time must be anticipated.<br />
The state of the real economy will again prevent any signifi -<br />
cant pressure on prices in 2011 since underutilized capacities<br />
and high unemployment leave little room to pass on price<br />
increases. Cautious lending practices show that the monetary<br />
holdings of central banks are scarcely fi nding their way into<br />
the real economy and that this transmission channel – as it<br />
is envisaged by monetary <strong>policy</strong> – continues to be disrupted.<br />
We do not expect to see any signifi cant change in 2011, with<br />
infl ation rates likely to pick up slightly – albeit without any<br />
real infl ationary pressure. In some emerging markets, on the<br />
other hand, there is already appreciable price pressure and<br />
this will make itself felt – albeit in milder form – in developed<br />
countries too through imported infl ation. The appetite<br />
of emerging economies for commodities shows no signs of<br />
easing and to some extent could again fi nd its way into the<br />
shopping baskets of developed markets in 2011 through rising<br />
energy prices. The modestly positive economic trend overall<br />
will give central banks little incentive in 2011, as in the previous<br />
year, to bring about a swift end to their highly expansionary<br />
monetary <strong>policy</strong>. To this extent, we do not expect any<br />
signifi cant departure from the prevailing expansionary monetary<br />
<strong>policy</strong> in the current year.<br />
A tightening of monetary <strong>policy</strong> is more likely in 2012. Sustained<br />
growth, falling unemployment and rising capacity utilization<br />
will lead to somewhat greater pricing pressures. The<br />
continued dynamic growth of emerging markets will exacerbate<br />
this situation through rising commodity prices. A cyclical<br />
soft ening in the pace of growth is probable in 2012. There<br />
are currently no grounds to fear a fresh downturn, although<br />
structural problems such as the high indebtedness of private<br />
households and national budgets in developed countries continue<br />
to pose substantial risks.<br />
Capital markets<br />
Bonds<br />
As far as the monetary <strong>policy</strong> that can be expected from<br />
central banks in 2011 is concerned, we anticipate increased<br />
vigilance. In our assessment, central banks will be ready for a<br />
tightening of monetary <strong>policy</strong> in order to be able to respond<br />
at short notice as needed and set in motion steps to reduce<br />
the surplus liquidity. Interest rate increases at the short end<br />
of the curve are, however, not expected from the Fed or the
ECB for the time being. The question of how long central<br />
banks will keep interest rates on the current low level and<br />
continue to pursue their expansionary monetary <strong>policy</strong> cannot,<br />
as things presently stand, be answered. Decision-makers<br />
must, however, be made aware that a continuation of this<br />
monetary <strong>policy</strong> – which has undoubtedly played its part<br />
in helping to cope with the consequences of the worldwide<br />
fi nancial and economic crisis – entails considerable interest<br />
rate losses on new investments made by the insurance<br />
industry and makes it increasingly diffi cult for insurance<br />
enterprises to generate sustainable surpluses. Infl ation<br />
expectations in the Eurozone are likely to remain moderate,<br />
although they are the subject of heated discussion – including<br />
within the ECB. The infl ation risks for the United States<br />
and United Kingdom are assessed as slightly higher than for<br />
the Eurozone.<br />
In 2011 the focus will continue to be on the sovereign debt<br />
crisis aff ecting countries on the Eurozone periphery. Since<br />
the funding requirements of these countries are high, further<br />
volatility can be expected – depending on the latest news to<br />
emerge. Overall, the picture remains very mixed. In the banking<br />
sector, too, there is a considerable need for refi nancing.<br />
When possible, banks will likely switch to issuing covered<br />
bonds. The more exacting capital requirements of Basel III<br />
will also keep the banks busy in 2011. The quest for returns,<br />
combined with the large issue volume of government bonds<br />
anticipated for 2011, will cause ten-year yields on government<br />
bonds to rise. In this climate the interest curve should<br />
initially become even steeper, before discussions about hiking<br />
key interest rates can bring about fl attening as this year<br />
progresses. We continue to anticipate a stable development<br />
overall on the corporate bond markets, allowing for shortterm<br />
news-driven volatility. For 2012, too, we expect interest<br />
rates to move higher on the back of the anticipated steps in<br />
monetary <strong>policy</strong>.<br />
Equities<br />
Boosted by the ongoing economic upturn, it is our belief that<br />
equity markets will again deliver positive returns in 2011.<br />
The fundamental valuation is below the long-term average<br />
yields, making equities still appear a favorable proposition.<br />
Dividend yields are also relatively high and will sup-port the<br />
performance of equities accordingly. An intact profi t trend<br />
among companies is adding to the positive mood. In our<br />
assessment, the M&A cycle is only in its initial phase and will<br />
have positive eff ects in 2011. Companies have suffi cient cash<br />
at their disposal and can obtain refi nancing on reasonable<br />
terms in the present low interest rate environment. The considerable<br />
supply of liquidity that central banks continue to<br />
provide points to increased cash infl ows into equity mar-kets.<br />
Companies which are heavily exposed in growth regions are<br />
likely to fare especially well in 2011. Analysts’ earnings estimates<br />
for 2011 are, however, already very positive and higher<br />
than the pre-crisis level. These high expectations are increasingly<br />
opening up a certain potential for disappointment. As<br />
a consequence of the slowing pace of economic growth the<br />
increase in corporate profi ts forecast for 2012 will not be as<br />
vigorous as that anticipated in 2011. Based on diminishing<br />
earnings growth, we expect an average return by the standards<br />
of this asset class.<br />
Future state of the industry<br />
Management report Forecast<br />
Assisted by the broadly positive prospects for the economy<br />
as a whole as well as for capital markets, and given the robust<br />
state of the insurance industry, the underlying mood driving<br />
expectations for the development of business in 2011/2012 is<br />
currently one of optimism. This should not, however, obscure<br />
the uncertainties that still exist or the risk of setbacks associated<br />
with the global imbalances and the failure as yet to<br />
restore fi nancial stability to the Eurozone on account of the<br />
budget situation of certain member states. These factors pose<br />
a latent threat to international fi nancial markets. Any turmoil<br />
occurring there could spill over again relatively quickly to the<br />
real economy and ultimately also to the insurance sector.<br />
Germany<br />
Looking at the German insurance industry, we see a broadly<br />
stable business development in the crisis years that has<br />
been further energized by the dynamic cyclical recovery of<br />
the German economy. Overall, then, we anticipate a modest<br />
increase in premium income in 2011 and 2012, the amount<br />
of which will ultimately depend on several factors. In addition,<br />
we are looking to a steady increase in concentration on<br />
the German insurance market, which will be fostered by the<br />
approaching implementation of Solvency II and the associated<br />
demands placed on capitalization and the installation<br />
of complex control and monitoring tools. Smaller insurance<br />
companies, in particular, could come up against their limits<br />
here. What is more, the trend towards industrialization of<br />
insurance production – especially in retail business – and the<br />
99
100 <strong>Talanx</strong> Group Financial report 2010<br />
progressive internationalization of the insurance industry<br />
are likely to advance the anticipated consolidation process.<br />
There are indications of further diff erentiation in the sales<br />
landscape, with an emphasis on the intensity of consulting<br />
required by the various products. On the one hand, the<br />
Internet is playing an ever greater role here inasmuch as it is<br />
increasingly used not only as a source of product and price<br />
information but also as a means of closing contracts and<br />
accessing extensive service functions. Further potential for<br />
expansion can also be discerned in bancassurance.<br />
The current hallmark of German life insurance is vigorous,<br />
albeit of late slightly slowing growth in single-premium business<br />
and soft ness in new business with a regular premium<br />
payment. The interest rate environment will be crucial to further<br />
developments within the forecasting horizon to the end<br />
of 2012. The dilemma facing German life insurers – one that<br />
will only become more acute going forward – is that the high<br />
minimum guaranteed interest rates entered into (especially<br />
in the existing portfolios from prior years) cannot be earned<br />
in the prevailing low interest rate climate; looking to the<br />
future, then, it will become increasingly diffi cult to operate<br />
successfully with low interest rate levels. In our assessment,<br />
given its solid capitalization and reserves as well as its longterm<br />
investment horizon, the German life insurance sector<br />
should be able to survive a few more years with interest on<br />
investments of around 3%, but aft er that things could quickly<br />
become very challenging.<br />
The decisive parameters for the development of the life<br />
insurance sector over the coming two years will continue<br />
to be new business and the lapse rate. Having been severely<br />
impacted by spillover eff ects of the fi nancial crisis, we also<br />
see fresh demand impetus for unit-linked life insurance products<br />
as trust in the fi nancial industry rebounds. In general<br />
terms, however, it is our belief that the industry’s core task<br />
lies in enhancing the fl exibility of the business models in life<br />
insurance through innovative products. In our assessment,<br />
the future belongs to life insurance products that can be fl exibly<br />
attuned to the individual needs of customers in various<br />
phases of life. We are convinced that on this basis life insurance<br />
off erings can once again become the key product for<br />
individual retirement provision. A growing lapse risk can be<br />
assumed in a scenario characterized by a sustained economic<br />
downturn and a sudden sharp rise in interest rates. This<br />
could prompt a sizeable portion of life insurance customers<br />
to cancel their existing long-term retirement provision<br />
policies early. In order to pay the surrender values associated<br />
with these unexpectedly high lapse rates insurers would<br />
have to liquidate investments, leading to a decline in investment<br />
income, a lower return and an even greater lapse risk.<br />
While we do not rule out the possibility of such a scenario,<br />
we consider it highly improbable. In our basic scenario we are<br />
looking at stable economic growth without any sudden shock<br />
increase in interest rates. Over the next two years the German<br />
life insurance market will also be shaped, in our view, by<br />
increasing competition for sales capacities as well as by the<br />
regulatory requirements for solvency and risk capital anticipated<br />
under Solvency II. Against the backdrop of changing<br />
capital requirements, we may see a far-reaching reorientation<br />
in the market and competitive situation.<br />
For German property and casualty insurance we expect fundamentally<br />
positive infl uences from the friendly economic<br />
climate that is likely to be sustained in Germany over the<br />
next two years. Nevertheless, the already attained level of<br />
market saturation puts relatively tight limits on further<br />
growth in the quantity structure. We believe that tariff s and<br />
premiums have room to move higher in a variety of lines.<br />
The scope for premium increases could be extended still<br />
further by positive economic eff ects, since rising production<br />
numbers normally go hand-in-hand with rising claims<br />
expenditure, which in turn lead to higher minimum required<br />
premiums. All in all, it is our expectation that the pressure<br />
on underwriting profi ts will also continue to grow as the net<br />
return on investments keeps falling.<br />
In motor insurance, which in the German insurance industry<br />
traditionally serves as a gateway for generating new business,<br />
we anticipate sustained fi erce competition over the coming<br />
two years – which could, however, shift from a pure price<br />
war to other competitive factors. This view is supported by
the fact that the asset base of numerous providers has been<br />
heavily eroded by the years of price warfare. The current level<br />
of average premiums in motor insurance is not adequate<br />
and must rise over the short or long term. One reason for the<br />
recurrent annual fl are-up in price competition is the prevailing<br />
market-wide renewal date of 1 January. It is our expectation<br />
that greater fl exibility in the renewal date will also result<br />
in motor insurance premiums that are more commensurate<br />
with requirements.<br />
International markets<br />
Although there is no mistaking the risks to the global economy,<br />
our assessment of the economic growth prospects for<br />
2011 and 2012 in the most likely basic scenario is broadly<br />
favorable. In this context, the pace of growth is expected<br />
to be particularly dynamic in the emerging markets, which<br />
over the longer term will show growth rates roughly double<br />
those of the industrialized nations. Established insurance<br />
groups with a keen interest in opening up new growth potentials<br />
– and which are also equipped with the fi nancial means<br />
for further expansion – have increasingly come to focus on<br />
emerging markets in recent years as desirable target markets;<br />
the market share of these countries is thus steadily increasing<br />
on the back of disproportionately strong growth relative<br />
to the industrialized nations. The vigorous rise in demand for<br />
insurance protection is driven by brisk, dynamic economic<br />
growth and growing affl uence in these countries. Along with<br />
the up-and-coming economic giants of Asia – such as China,<br />
India, South Africa and Malaysia – Latin America also ranks<br />
among the preferred growth markets of internationally operating<br />
insurance groups. It is our assumption that the appeal<br />
of Latin America – including Mexico – will continue to grow,<br />
especially in the area of retail business, because the comparatively<br />
well-off middle class in this region is rapidly expanding<br />
and its insurance needs are hence also on the rise. Considerable<br />
demand stimuli can also be expected from the major<br />
sporting events recently awarded to Brazil – namely the 2014<br />
Football World Cup and the 2016 Olympic Games.<br />
On this basis the growth prospects in international property/<br />
casualty insurance can be assessed as favorable, especially<br />
in emerging markets. The profi tability of property/casualty<br />
insurers will, however, initially continue to decline in 2011<br />
Management report Forecast<br />
and 2012. Even if wide-ranging premium increases were to<br />
be implemented in the course of 2011 – fi rst and foremost<br />
in motor insurance –, these will not be refl ected in the<br />
results posted by insurers until aft er a time lag. This means<br />
that technical results cannot be expected to show gradual<br />
improvement across a broad front before 2012 at the earliest,<br />
although the margins generated prior to the fi nancial crisis<br />
will not be attainable for the foreseeable future.<br />
On the international life insurance markets, too, a healthy<br />
growth outlook can be anticipated because demand for<br />
funded retirement provision products in the context of individual<br />
old-age provision as well as provision for surviving<br />
dependants remains strong. It is, however, also the case in<br />
life insurance that a strong diff erence in the pace of growth<br />
is likely to be evident between the industrialized nations and<br />
emerging markets – with the latter spurred on by favorable<br />
demographic and economic framework conditions. A special<br />
challenge facing life insurers is the need to generate suffi -<br />
cient investment income to off er their customers an attractive<br />
return without overextending their own risk position. On<br />
the other hand, it must be anticipated that European insurers,<br />
in particular, will have to cope with a rising cost of capital<br />
under Solvency II since capital requirements in certain<br />
subsegments – such as for riskier asset classes or for products<br />
with high guarantees – will become more exacting.<br />
Conditions in non-life reinsurance are broadly satisfactory,<br />
even though rates declined sometimes substantially on<br />
account of the healthy capital resources enjoyed by primary<br />
insurers and the absence of market-changing major losses in<br />
the developed markets. As a direct consequence of the heavy<br />
loss expenditure associated with the sinking of the “Deepwater<br />
Horizon” drilling rig we are seeing appreciable price<br />
increases on covers for off shore oil exploration. We anticipate<br />
further price increases in the April and July treaty renewals,<br />
especially for Australia in the aft ermath of the severe fl ooding<br />
of December 2010 and January 2011.<br />
101
102 <strong>Talanx</strong> Group Financial report 2010<br />
In the coming years, as in the past, we expect to see a positive<br />
basic direction and further dynamic growth in international<br />
life and health reinsurance business. On a global level the<br />
growth recorded in life and health reinsurance should continue<br />
to outpace the comparable growth on primary markets.<br />
In this context we are seeing a shift in demand for new business<br />
away from developed markets such as the United States,<br />
United Kingdom and Germany towards emerging markets<br />
such as China, India, Brazil and Latin America. The preparations<br />
for Solvency II, and in particular the stress tests performed<br />
by the EU, have led to a greater risk awareness among<br />
European insurers and highlighted the important role of<br />
reinsurance as a means of risk and capital optimization. This<br />
is especially true of small and mid-sized insurers, specialty<br />
providers and mutual insurance companies.<br />
Orientation of the Group over the next<br />
two fi nancial years<br />
In the 2011 and 2012 fi nancial years the orientation of the<br />
Group will continue to be shaped by the Group restructuring<br />
set in motion in 2009 and by the consolidation of the<br />
new Group structure put in place at the beginning of 2011.<br />
Through its concentration of central functions the Group will<br />
be able to leverage the fi rst synergistic eff ects by the end of<br />
2012. This is to be achieved primarily by way of natural fl uctuation.<br />
Orientation towards the market<br />
■ Holistic view of the customer<br />
■<br />
Strengthening of retail business in Germany and abroad<br />
Effi ciency enhancement within the organization<br />
■<br />
■<br />
Reduction of complexity in the Group structure<br />
Leverage of synergistic potentials<br />
Strategic orientation of our Group segments at a glance:<br />
Group segment Our mission and strategic tasks<br />
Retail Germany ■ Profitable enlargement of market share<br />
■ Elimination of cost disadvantages<br />
■ Establishment of clear, simple organizational structures<br />
■ Putting in place of a closer focus on the customer<br />
Retail International<br />
■ Growth in strategic target markets<br />
■ Optimization of activities in existing markets<br />
Industrial Lines<br />
■ Growth in foreign markets<br />
■ Development into a Global Player<br />
Non-Life Reinsurance<br />
■ Not one of the largest, but rather one of the most profitable non-life reinsurers in the world<br />
■ Special focus on the correct assessment of risks<br />
■ Technically oriented setting of prices and conditions as well as an adequate level of reserving<br />
Life/Health Reinsurance<br />
■ In 5 years one of the 3 major, globally operating life/health reinsurers of above-average<br />
profitability<br />
■ Annual double-digit growth in volume and profitability indicators<br />
■ Special focus on the regional and biometric balance of the portfolio
A key focus of further measures relating to the Group restructuring<br />
in 2011 will be on the Retail Germany division. Intensive<br />
preparations are underway here to make this division fi t<br />
for the future. The goal is to align the business processes and<br />
organization with the needs of customers and sales partners.<br />
Combined with the elaboration of product, sales and service<br />
strategies that span the various lines of business, the aim is<br />
to become one of the most effi cient and customer-oriented<br />
insurers serving this segment of clientele.<br />
Probable development of the Group<br />
In our preview of the period until 2012, we expect to see an<br />
increase in gross premium to around EUR 25 billion as well as<br />
a net return on premium of around 7% for the <strong>Talanx</strong> Group<br />
on a consolidated basis. The return on equity aft er tax and<br />
minority interests should be at least 10.8%. This is equivalent<br />
to 750 basis points above the risk-free interest rate, which we<br />
have defi ned as the 5-year average on 10-year German government<br />
bonds. We have set ourselves the goal of a return on<br />
equity of 12.5% as a strategic target. We are standing by our<br />
objective of going public with a minority interest in <strong>Talanx</strong><br />
AG, albeit without yet specifying the precise timing of such a<br />
move. We shall therefore continue to make systematic preparations<br />
in order to be absolutely ready to act at the decisive<br />
moment.<br />
Industrial Lines<br />
In the 2011 fi nancial year our business in Industrial Lines is<br />
to be further expanded in Europe as well as Latin America,<br />
(South-)East Asia and the Arabian Peninsula. There are also<br />
plans to establish a branch offi ce in Canada. Given the economic<br />
recovery both domestically and in the export market,<br />
the company is looking to boost its premium income – especially<br />
from turnover-based policies. The gross premium volume<br />
of EUR 2.6 billion expected for 2011 is thus marginally<br />
higher than the level recorded as at 31 December 2010. The<br />
industrial insurance market remains fi ercely competitive in<br />
light of the unchanged predatory competition over prices<br />
and conditions. At the time of going to press it was still too<br />
early to foresee with any certainty the implications of the<br />
Japanese earthquake in March 2011. The Industrial Lines segment<br />
must anticipate appreciable claims expenditure. On<br />
the other hand, parallel to this, we are looking to a trend<br />
reversal on the pricing side – which should make itself felt<br />
Management report Forecast<br />
partially in 2011 but above all in 2012. Rising claims expenditure<br />
must also be anticipated as a consequence of the widespread<br />
economic upturn. Despite the cautious assumptions<br />
with respect to investment returns, the company expects<br />
to achieve again in 2011 the satisfactory investment income<br />
generated in 2010.<br />
Retail Germany<br />
The comprehensive product range off ered by HDI-Gerling<br />
Lebensversicherung is particularly well suited to meeting the<br />
challenges posed by demographic change. With this in mind,<br />
we expect the company’s favorable development to continue.<br />
At the start of 2011 HDI-Gerling Firmen und Privat Versicherung<br />
AG geared its range of off erings in retail property/casualty<br />
insurance to a modular product architecture, bundling<br />
contract administration across all lines for operational purposes.<br />
Not only does this generate value-added for <strong>policy</strong>holders,<br />
including for example greater fl exibility and transparency,<br />
it also opens up cost-cutting potential for the insurance<br />
carrier and on the sales side.<br />
In the sector comprised of commercial customers and freelance<br />
professions, HDI-Gerling Firmen und Privat Versicherung<br />
AG will continue to focus on professional indemnity<br />
and directors’ and offi cers’ (D&O) business – lines in which<br />
the tariff s are to be revised. Not only that, the product range<br />
will be enlarged to include a new IT insurance product. In the<br />
area of medical malpractice, modernization of the terms and<br />
conditions as well as expansion of the portfolio – always with<br />
a close eye to keeping the risks in check – are planned. The<br />
portfolio of existing business in the “Compact” product line<br />
is to be signifi cantly boosted through a high-volume cooperation<br />
and an additional component – “Receivables management”<br />
– will be added to the product range.<br />
The turn of the year 2010/2011 raised hopes that the motor<br />
market is slowly stabilizing. The average premium level was<br />
around 3% higher than in the previous year. In the current<br />
fi nancial year HDI Direkt Versicherung AG will continue to<br />
position itself as a value-for-money provider in this market.<br />
Special emphasis will again be placed on expanding sales<br />
over the Internet and through cooperation partners; marketing<br />
eff orts in employee affi nity business will also be further<br />
stepped up. All in all, the company expects to increase its<br />
premium income by roughly 3%.<br />
103
104 <strong>Talanx</strong> Group Financial report 2010<br />
For the companies transacting bancassurance business the<br />
bar continues to be set high: Neue Leben Lebensversicherung<br />
AG intends to further extend its role as a provision<br />
specialist and strategic partner for Sparkasse savings institutions<br />
and will seek to cement its position in the market<br />
through innovative products and its proven performance<br />
standard. For the current 2011 fi nancial year Neue Leben<br />
Holding AG anticipates a healthy profi t. At Targo Lebensversicherung<br />
AG the focus is on cementing profi table growth<br />
for the long term, superb cost effi ciency, the excellent quality<br />
of its products and services and the acquisition of new customer<br />
groups. In the interests of value-based management<br />
PBV Lebensversicherung AG will maintain its orientation<br />
towards enhancing effi ciency through further improvements<br />
in the cost situation and investment income. On this basis<br />
we see opportunities to gain market advantages and further<br />
strengthen the competitive position of PBV Lebensversicherung<br />
AG as a specialist provider of products for individual<br />
retirement provision.<br />
Retail International<br />
In the 2011 fi nancial year we shall continue to pursue a clear<br />
expansionary strategy in international retail business, always<br />
emphasizing growth with adequate profi tability. The strategic<br />
orientation will concentrate on the establishment and<br />
further extension of business in the target regions of Latin<br />
America as well as Central and Eastern Europe and Turkey –<br />
with both organic and inorganic growth considered desirable<br />
– as well as on the optimization of activities in existing markets.<br />
Opportunities outside the target regions are acted upon<br />
if a clear value-added can be generated above and beyond the<br />
set parameters.<br />
Gross premium in the Group segment is expected to grow to<br />
around 10% of the Group’s total volume by 2012. Our Brazilian<br />
company is the principal driver of growth. It is our expectation<br />
that the Brazilian economy will continue to fl ourish<br />
over the next two years – a development which will be particularly<br />
benefi cial to our company, which writes predominantly<br />
motor business. HDI Seguros S. A., Brazil, anticipates<br />
premium growth of almost 50% in 2011. Growth in the other<br />
markets is likely to be in the high single digits or even the<br />
double-digit percentage range.<br />
In the Polish market, where we largely transact motor liability<br />
business, the rates that can be obtained are still scarcely suffi<br />
cient. In 2011 we shall take the opportunity to adjust rates<br />
and further optimize workfl ows so as to generate adequate<br />
profi tability. In light of our favorable assessment of the development<br />
of the Polish life insurance market, we shall realign<br />
our company accordingly so as to share fully in its growth.<br />
Growth in life insurance could come in higher overall relative<br />
to the 2010 level, were it not for the fact that the cessation of<br />
new business in Liechtenstein and Luxembourg as well as the<br />
reduced demand for single-premium products off ered by the<br />
Italian company will likely cause the premium volume to fl atten<br />
out by the end of 2012.<br />
In cooperation with our new strategic partners of the Meiji<br />
Yasuda Life Group we shall make the most of opportunities to<br />
grow together in foreign markets when the occasion presents<br />
itself. Investments in Central and Eastern Europe as well as<br />
Turkey and Latin America feature particularly prominently in<br />
the target corridor. With the Polish company HDI Asekuracja<br />
closing the fi nancial year just-ended in negative territory and<br />
owing to the growth recorded by the Italian company HDI<br />
Assicurazioni, only the Brazilian company HDI Seguros is<br />
expected to pay a dividend in 2011. For 2012 we are looking to<br />
generate dividend income from Poland, Brazil and Italy.<br />
Non-Life Reinsurance<br />
In Non-Life Reinsurance we expect broadly good conditions<br />
for the current fi nancial year and beyond. The renewals as at<br />
1 January 2011 passed off better for us than the market players<br />
had anticipated.<br />
In our target market of Germany we are looking ahead optimistically<br />
to the current fi nancial year. With premium volume<br />
stable overall, prices for loss-impacted programs rose<br />
while rates declined under programs that had been spared<br />
losses. In motor business the primary insurance market<br />
bottomed out in 2010. This development, combined with<br />
improved conditions, will have favorable implications for our<br />
result in proportional motor business and also – indirectly –<br />
for our non-proportional motor liability portfolio.<br />
Lively competition is once again shaping business conditions<br />
in North America in the current fi nancial year. In terms of<br />
premium volume, we expect to see a modest increase (+1%)<br />
in 2011. Growth will be driven by Canadian business. Given
our very good market position and the excellent relations<br />
that we enjoy with our clients, we continue to see good business<br />
prospects going forward in our target market of North<br />
America.<br />
We are thoroughly satisfi ed with the treaty renewals in specialty<br />
lines. Rate movements were particularly favorable in<br />
off shore energy business. In view of the heavy losses, prices<br />
here rose sharply in both the property and casualty lines,<br />
and we therefore expect to enlarge our premium volume<br />
for 2011 by 16%. In aviation reinsurance we expect growth of<br />
around 12% in our gross premium volume. Business should<br />
also develop well in credit and surety reinsurance; given our<br />
selective underwriting <strong>policy</strong>, however, the premium volume<br />
here is expected to contract by 8% in 2011. In the area<br />
of structured reinsurance products we are seeing sustained<br />
demand overall for contracts with a greater risk transfer and<br />
we are looking forward to further pleasing development of<br />
our business in the current fi nancial year. We shall continue<br />
to expand activities in the area of insurance-linked securities<br />
in 2011.<br />
We shall grow by around 2% in global treaty reinsurance<br />
in 2011, even though the treaty renewals as at 1 January<br />
2011 presented a mixed picture in the individual markets.<br />
Owing to the absence of major loss events in zones with<br />
peak exposures, such as in the United States, the overall tendency<br />
towards declining rates in catastrophe business was<br />
sustained. Altogether, the gross premium from our global<br />
catastrophe business is likely to contract by around 10% in<br />
the current fi nancial year. The price situation in facultative<br />
reinsurance, i.e. the underwriting of individual risks, remains<br />
tense. At this point in time it is our expectation that rates<br />
will for the most part decline. Nevertheless, given the varied<br />
nature of demand and the diversifi cation of the markets, our<br />
facultative portfolio should again generate profi table growth<br />
in 2011. We anticipate that the rate erosion in conventional<br />
property and casualty business will be off set by the writing of<br />
niche segments.<br />
Management report Forecast<br />
Life/Health Reinsurance<br />
In Life/Health Reinsurance we have set ourselves an annual<br />
growth target of 10% to 12% for gross premium income.<br />
Along with our organic growth we anticipate further portfolio<br />
acquisitions in mature insurance markets. We are targeting<br />
an EBIT margin of at least 6%. For Hannover Life Re, the evolution<br />
of its tried and tested “Five Pillar” model continues to<br />
shape the development of business; new markets will remain<br />
the principal engines of growth over the coming two to three<br />
years. We also see good potential in the bancassurance sector,<br />
especially in emerging markets. Our expansionary eff orts are<br />
concentrated on the United States, Arab countries and the<br />
key emerging markets of Asia and Latin America.<br />
Corporate Operations<br />
AmpegaGerling Asset Management: As a result of updated<br />
arm’s length comparisons, revenues are expected to contract<br />
by EUR 12 million on account of lower fee agreements with<br />
affi liated Group companies. If operating expenses are maintained<br />
on the level of 2010, the operating profi t will decrease<br />
as planned to EUR 21 million (excluding income from profi t<br />
transfer agreements).<br />
AmpegaGerling Investment GmbH: Along with portfolio<br />
management of public and special funds, the company’s<br />
activities in 2011 will be concentrated on refi ning its business<br />
processes with a view to attaining UCITS IV compliance (management<br />
of foreign funds) as well as on further expansion of<br />
technical expertise for the administration of investments. All<br />
in all, the operating profi t for 2011 is expected to be on the<br />
level of the previous year.<br />
AmpegaGerling Immobilien Management GmbH: In view<br />
of the transfer of the mortgage lending business (and hence<br />
the loss of the associated revenues), it is anticipated that<br />
revenues will contract by around EUR 1 million despite the<br />
reorganization of commission structures and, among other<br />
things, the associated increase in portfolio margins. Driven by<br />
special project costs, a negative operating result of –EUR 0.7<br />
mil lion is planned for 2011. From 2012 onwards, following<br />
complete implementation of the new production structures<br />
and elimination of special project expenses, it is envisaged<br />
that an operating profi t will be generated.<br />
As things currently stand, it is to be anticipated that the<br />
profi t generated by Protection Re in 2011 will surpass the level<br />
of the 2010 fi nancial year.<br />
105
106 <strong>Talanx</strong> Group Financial report 2010
Consolidated fi nancial statements. Contents<br />
108 Consolidated balance sheet<br />
110 Consolidated statement of income<br />
111 Consolidated statement of comprehensive income<br />
112 Consolidated statement of changes in equity<br />
113 Cash fl ow statement<br />
114 Notes on the cash fl ow statement<br />
Notes<br />
115 General information<br />
116 General accounting principles and application of IFRS<br />
121 Accounting policies<br />
144 Segment reporting<br />
154 Consolidation<br />
163 Business combinations in the reporting period<br />
164 Non-current assets held for sale and disposal groups<br />
166 Nature of risks associated with insurance contracts and<br />
fi nancial instruments<br />
Notes on the consolidated balance sheet – assets<br />
187 (1) Goodwill<br />
192 (2) Other intangible assets<br />
194 (3) Investment property<br />
195 (4) Investments in affi liated companies and<br />
participating interests<br />
195 (5) Investments in associated companies<br />
196 (6) Loans and receivables<br />
197 (7) Financial assets held to maturity<br />
299 (8) Financial assets available for sale<br />
201 (9) Financial assets at fair value through profi t or loss<br />
203 (10) Other invested assets<br />
203 (11) Fair value hierarchy<br />
207 (12) Derivative fi nancial instruments and hedge accounting<br />
211 (13) Accounts receivable on insurance business<br />
211 (14) Deferred acquisition costs<br />
212 (15) Other assets<br />
214<br />
Notes on the consolidated balance sheet – liabilities<br />
(16) Shareholders' equity<br />
216 (17) Subordinated liabilities<br />
218 (18) Unearned premium reserve<br />
218 (19) Benefi t reserve<br />
219 (20) Loss and loss adjustment expense reserve<br />
222 (21) Provision for premium refunds<br />
223 (22) Provision for pensions and other post-employment<br />
benefi t obligations<br />
226 (23) Provisions for taxes<br />
227 (24) Sundry provisions<br />
228 (25) Notes payable and loans<br />
229 (26) Other liabilities<br />
230 (27) Deferred taxes<br />
231<br />
Notes on the consolidated statement of income<br />
(28) Net premium earned<br />
232 (29) Net investment income<br />
236 (30) Claims and claims expenses<br />
238 (31) Acquisition costs and administrative expenses<br />
240 (32) Other income/expenses<br />
241 (33) Goodwill impairments<br />
241 (34) Financing costs<br />
242 (35) Taxes on income<br />
Other information<br />
244 Staff<br />
245 Related party disclosures<br />
246 Share-based payment<br />
250 Lawsuits<br />
251 Contingent liabilities and other fi nancial commitments<br />
253 Rents and leases<br />
253 Remuneration of the management boards<br />
of the parent company<br />
254 Fee paid to the auditor<br />
254 Declaration of conformity pursuant to § 161<br />
German Stock Corporation Act (AktG)<br />
254 Events after the balance sheet date<br />
256 List of shareholdings<br />
Consolidated fi nancial statements Index<br />
107
108<br />
<strong>Talanx</strong> Group Financial report 2010<br />
Consolidated balance sheet of <strong>Talanx</strong> AG<br />
as at 31 December 2010<br />
Assets Note 31.12.2010 31.12.2009 1)<br />
Figures in EUR million<br />
A. Intangible assets<br />
a. Goodwill 1 589 593<br />
b. Other intangible assets 2 1,851 2,154<br />
2,440 2,747<br />
B. Investments<br />
a. Investment property<br />
b. Investments in affi liated companies and<br />
3 860 726<br />
participating interests 4 74 61<br />
c. Investments in associated companies 5 144 134<br />
d. Loans and receivables<br />
e. Other fi nancial instruments<br />
6 32,343 31,548<br />
i. Held to maturity 7 2,999 2,858<br />
ii. Available for sale 8/11 30,635 26,477<br />
iii. At fair value through profi t or loss 9/11/12 1,221 1,099<br />
f. Other invested assets 10/11 4,185 4,133<br />
Investments under own management 72,461 67,036<br />
g. Funds held by ceding companies 10,961 9,349<br />
Total investments 83,422 76,385<br />
C. Investments for the account and risk of<br />
holders of life insurance policies 6,414 4,975<br />
D. Reinsurance recoverables on<br />
technical provisions 5,523 5,962<br />
E. Accounts receivable on insurance business 13 5,011 4,342<br />
F. Deferred acquisition costs 14 3,715 3,544<br />
G. Cash 1,265 1,685<br />
H. Deferred tax assets 27 268 235<br />
I. Other assets 15 1,781 1,655<br />
J. Non-current assets and assets of disposal<br />
groups classifi ed as held for sale 1,529 35<br />
Total assets 111,368 101,565<br />
1) Figures for the previous year adjusted on the basis of IAS 8 and IFRS 8; see explanatory remarks in the section<br />
“Summary of major accounting policies”
Consolidated fi nancial statements Consolidated balance sheet<br />
Liabilities Note 31.12.2010 31.12.2009 1)<br />
Figures in EUR million<br />
A. Shareholders’ equity 16<br />
a. Common shares 260 260<br />
b. Reserves<br />
Total shareholders’ equity<br />
4,696 4,314<br />
excluding minorities 4,956 4,574<br />
c. Minority interests 3,035 2,579<br />
Total shareholders’ equity 7,991 7,153<br />
B. Subordinated liabilities 17 2,791 2,003<br />
C. Technical provisions<br />
a. Unearned premium reserve 18 5,411 5,026<br />
b. Benefi t reserve 19 42,466 39,754<br />
c. Loss and loss adjustment expense reserve 20 28,538 27,256<br />
d. Provision for premium refunds 21 1,113 1,274<br />
e. Other technical provisions 250 221<br />
77,778 73,531<br />
D. Technical provisions in the area of life<br />
insurance insofar as the investment risk is<br />
borne by <strong>policy</strong>holders 6,414 4,975<br />
E. Other provisions<br />
a. Provision for pensions 22 1,316 1,298<br />
b. Provision for taxes 23 743 771<br />
c. Sundry provisions 24 692 575<br />
2,751 2,644<br />
F. Liabilities<br />
a. Notes payable and loans 25 747 675<br />
b. Funds held under reinsurance treaties 5,224 4,514<br />
c. Other liabilities 11/12/26 4,858 4,561<br />
10,829 9,750<br />
G. Deferred tax liabilities 27 1,433 1,509<br />
Total liabilities/provisions 101,996 94,412<br />
H. Liabilities of disposal groups classifi ed<br />
as held for sale 1,381 —<br />
Total liabilities 111,368 101,565<br />
1) Figures for the previous year adjusted on the basis of IAS 8 and IFRS 8; see explanatory remarks in the section<br />
“Summary of major accounting policies”<br />
The following Group Notes form an integral part of the consolidated fi nancial statement.<br />
109
110 <strong>Talanx</strong> Group Financial report 2010<br />
Consolidated statement of income<br />
of <strong>Talanx</strong> AG for the 2010 fi nancial year<br />
Note 2010 2009 1)<br />
Figures in EUR million<br />
1. Gross written premium including premium from<br />
unit-linked life and annuity insurance<br />
2. Savings elements of premium from unit-linked<br />
22,869 20,923<br />
life and annuity insurance 1,139 979<br />
3. Ceded written premium 2,767 2,530<br />
4. Change in gross unearned premium –185 –67<br />
5. Change in ceded unearned premium 25 24<br />
Net premium earned 28 18,753 17,323<br />
6. Claims and claims expenses (gross) 30 17,810 15,101<br />
Reinsurers’ share 1,712 1,043<br />
Claims and claims expenses (net) 16,098 14,058<br />
7. Acquisition costs and administrative expenses<br />
(gross) 31 4,887 4,754<br />
Reinsurers’ share 515 710<br />
Acquisition costs and administrative expenses (net) 4,372 4,044<br />
8. Other technical income 71 43<br />
Other technical expenses 390 295<br />
Other technical result –319 –252<br />
Net technical result –2,036 –1,031<br />
9. a. Income from investments 29 3,383 3,321<br />
b. Expenses for investments<br />
Net income from investments under own<br />
29 486 903<br />
management<br />
Income/expense on funds withheld and<br />
2,897 2,418<br />
contract deposits 29 280 240<br />
Net investment income<br />
thereof profi t/loss from investments<br />
3,177 2,658<br />
in associated companies 2 –6<br />
10. a. Other non-technical income 32 947 967<br />
b. Other non-technical expenses 32 1,039 1,005<br />
Other income/expenses –92 –38<br />
Profi t before goodwill impairments 1,049 1,589<br />
11. Goodwill impairments 33 17 92<br />
Operating profi t/loss (EBIT) 1,032 1,497<br />
12. Financing costs 34 134 133<br />
13. Taxes on income 35 228 471<br />
Net income 670 893<br />
thereof minority interest in profi t or loss 450 408<br />
thereof Group net income 220 485<br />
1) Figures for the previous year adjusted on the basis of IAS 8 and IFRS 8; see explanatory remarks in the section<br />
“Summary of major accounting policies”<br />
The following Group Notes form an integral part of the consolidated fi nancial statement.
Consolidated fi nancial statements Consolidated statement of income. Consolidated statement of comprehensive income<br />
Consolidated statement of<br />
comprehensive income of <strong>Talanx</strong> AG<br />
for the 2010 fi nancial year<br />
2010 2009 1)<br />
Figures in EUR million<br />
Net income 670 893<br />
1. Unrealized gains and losses on investments<br />
Gains (losses) recognized directly in equity during the period 108 908<br />
Reclassifi cation of net realized gain (loss) –224 102<br />
Tax income (expense) –3 –116<br />
2. Currency translation<br />
–119 894<br />
Gains (losses) recognized directly in equity during the period 250 87<br />
Reclassifi cation of net realized gain (loss) 2 –4<br />
Tax income (expense) –12 1<br />
3. Changes from cash fl ow hedges<br />
240 84<br />
Gains (losses) recognized directly in equity during the period –103 –7<br />
Reclassifi cation of net realized gain (loss) — —<br />
Tax income (expense) 3 2<br />
4. Changes in <strong>policy</strong>holder participation/shadow accounting<br />
–100 –5<br />
Gains (losses) recognized directly in equity during the period 324 –462<br />
Tax income (expense) –7 20<br />
5. Changes from the measurement of associated companies<br />
317 –442<br />
Gains (losses) recognized directly in equity during the period –2 —<br />
Reclassifi cation of net realized gain (loss) — —<br />
Tax income (expense) — —<br />
6. Other changes<br />
–2 —<br />
Gains (losses) recognized directly in equity during the period 4 8<br />
Reclassifi cation of net realized gain (loss) — —<br />
Tax income (expense) –1 –3<br />
3 5<br />
Taxes on income and expense recognized in equity via<br />
other income/expenses<br />
Income and expense recognized during the period in equity<br />
–20 –96<br />
via other income/expenses after taxes 339 536<br />
Total recognized income and expense during the period 1,009 1,429<br />
thereof attributable to minority interests 615 491<br />
thereof attributable to the Group 394 938<br />
1) Adjusted on the basis of IAS 8<br />
The following Group Notes form an integral part of the consolidated fi nancial statement.<br />
111
112 <strong>Talanx</strong> Group Financial report 2010<br />
Consolidated statement of changes in equity<br />
Common<br />
shares<br />
Additional<br />
paid-in<br />
capital<br />
Retained<br />
earnings<br />
Cumulative other comprehensive income (other reserves)<br />
Unrealized<br />
gains/<br />
losses on<br />
investments<br />
Gains/<br />
losses from<br />
currency<br />
translation<br />
Other<br />
changes in<br />
shareholders’<br />
equity<br />
Measurement<br />
gains<br />
and losses<br />
from cash<br />
fl ow hedges<br />
Minority<br />
interests<br />
Shareholders’<br />
equity<br />
Figures in EUR million<br />
Balance at 31.12.2008<br />
Adjustments pursuant<br />
260 630 2,977 –123 –211 111 –18 2,092 5,718<br />
to IAS 8<br />
Adjusted balance at<br />
— — 12 –8 — 7 — 1 12<br />
01.01.2009<br />
Total recognized income<br />
260 630 2,989 –131 –211 118 –18 2,093 5,730<br />
and expense<br />
therein adjustments<br />
— — 485 799 71 –412 –5 491 1,429<br />
pursuant to IAS 8<br />
thereof currency<br />
— — –41 — — — — 1 –40<br />
translation<br />
thereof unrealized<br />
gains and losses on<br />
— — — — 71 — — 13 84<br />
investments<br />
thereof change from<br />
— — — 799 — — — 95 894<br />
equity measurement<br />
thereof change from<br />
— — — — — — — — —<br />
cash fl ow hedges — — — — — — –5 — –5<br />
thereof sundry changes 1) — — — — — –412 — –25 –437<br />
Dividends paid to<br />
shareholders — — — — — — — –18 –18<br />
Capital increase — — — — — — — 12 12<br />
Other changes — — — — — — — 1 1<br />
Balance at 31.12.2009 2) 260 630 3,474 667 –140 –294 –23 2,579 7,153<br />
Adjustments pursuant to<br />
IAS 8<br />
Adjusted balance at<br />
— — –15 29 — –26 — — –12<br />
01.01.2010<br />
Changes in ownership<br />
260 630 3,459 696 –140 –320 –23 2,579 7,141<br />
interest 3) Total recognized income<br />
— — — — — — — 7 7<br />
and expense<br />
thereof currency<br />
— — 219 –174 144 305 –100 615 1,009<br />
translation<br />
thereof unrealized<br />
gains and losses on<br />
— — — — 144 — — 96 240<br />
investments<br />
thereof change from<br />
— — — –174 — — — 55 –119<br />
equity measurement<br />
thereof change from<br />
— — — — — –1 — –1 –2<br />
cash fl ow hedges — — — — — — –100 — –100<br />
thereof sundry changes 1) — — — — — 306 — 13 319<br />
Dividends paid to<br />
shareholders — — — — — — — –162 –162<br />
Capital reduction — — — — — — — –4 –4<br />
Balance at 31.12.2010 260 630 3,678 522 4 –15 –123 3,035 7,991<br />
1) The sundry changes consist of the <strong>policy</strong>holder participation/shadow accounting as well as other changes<br />
2) Adjusted on the basis of IAS 8<br />
3) Changes in ownership interest with no change of control status<br />
The following Group Notes form an integral part of the consolidated fi nancial statement.
Consolidated fi nancial statements Consolidated statement of changes in equity. Cash fl ow statement<br />
Cash fl ow statement of <strong>Talanx</strong> AG<br />
for the 2010 fi nancial year<br />
2010 2009 1)<br />
Figures in EUR million<br />
I. 1. Net income 670 893<br />
I. 2. Changes in technical provisions 3,879 3,339<br />
I. 3. Changes in deferred acquisition costs –38 5<br />
I. 4. Changes in funds held and in accounts receivable and payable 441 –930<br />
I. 5. Net changes in contract deposits –1,230 71<br />
I. 6. Changes in other receivables and liabilities 71 117<br />
I. 7. Changes in fi nancial assets held for trading 36 226<br />
I. 8. Net gains and losses on investments –385 –237<br />
I. 9. Changes in other balance sheet items<br />
I. 10. Other non-cash expenses and income as well as adjustments<br />
–86 –70<br />
to net income 1,226 2,058<br />
I. Cash fl ows from operating activities 4,584 5,472<br />
II. 1. Cash infl ow/outfl ow from the sale of consolidated companies 47 —<br />
II. 2. Cash infl ow/outfl ow from the purchase of consolidated companies — 79<br />
II. 3. Cash infl ow from the sale of real estate 38 43<br />
II. 4. Cash outfl ow from the purchase of real estate –205 –225<br />
II. 5. Cash infl ow from the sale and maturity of fi nancial instruments 16,552 18,622<br />
II. 6. Cash outfl ow from the purchase of fi nancial instruments<br />
II. 7. Changes in investments for the account and risk of holders of life<br />
–20,754 –21,329<br />
insurance policies –1,394 –1,603<br />
II. 8. Changes in other invested assets 130 –659<br />
II. Cash fl ows from investing activities –5,586 –5,072<br />
III. 1. Cash infl ow from capital increases — 12<br />
III. 2. Cash outfl ow from capital reductions –4 —<br />
III. 3. Dividends paid –162 –18<br />
III. 4. Net changes from other fi nancing activities 719 –123<br />
III. Cash fl ows from fi nancing activities 553 –129<br />
Change in cash and cash equivalents (I.+II.+III.) –449 271<br />
Cash and cash equivalents at the beginning of the fi nancial year 1,685 1,408<br />
Cash and cash equivalents – exchange rate diff erences on cash 54 6<br />
Cash and cash equivalents at the end of the fi nancial year 1,290 1,685<br />
Cash and cash equivalents of disposal groups<br />
Cash and cash equivalents at the end of the fi nancial year<br />
25 —<br />
excluding disposal groups 1,265 1,685<br />
Additional information<br />
Taxes paid 294 –3<br />
Interest paid 255 260<br />
1) Adjusted on the basis of IAS 8<br />
The following Group Notes form an integral part of the consolidated fi nancial statement.<br />
113
114 <strong>Talanx</strong> Group Financial report 2010<br />
Notes on the cash fl ow statement<br />
The cash fl ow statement shows how the cash and cash equivalents of the Group changed in the<br />
course of the year under review due to infl ows and outfl ows. In this context a distinction is made<br />
between cash fl ow movements from operating activities and those from investing and fi nancing<br />
activities.<br />
The cash fl ows are presented in accordance with IAS 7 “Statement of Cash Flows” and the principles<br />
set out in German Accounting Standard (DRS) No. 2 regarding the preparation of cash fl ow statements,<br />
which were supplemented and specifi ed more closely by DRS 2-20 for insurance enterprises.<br />
The cash fl ow statement was drawn up using the indirect method. The liquid funds are limited to<br />
cash and cash equivalents and correspond to the balance sheet item “Cash”.<br />
The cash fl ow movements of the Group are infl uenced principally by the business model of an<br />
insurance and reinsurance enterprise. Normally, we fi rst receive premiums for risk assumption and<br />
subsequently make payments for claims. The eff ects of exchange rate diff erences and the infl uences<br />
of changes in the consolidated group are eliminated in the cash fl ow statement. The acquisition of<br />
new companies is shown in the line “Cash infl ow/outfl ow from the purchase of consolidated companies”;<br />
the sum total of purchase prices paid less acquired cash and cash equivalents is recognized<br />
here.<br />
The informational value of the cash fl ow statement for the Group is to be considered minimal. For<br />
us, it is not a substitute for liquidity and fi nancial planning, nor is it used as a management tool.<br />
The purchase price for HDI Strakhovanie totaled EUR 1 million; cash assets accrued in the same<br />
amount (see subsection of the Notes entitled “Business combinations in the reporting period”,<br />
page 163).
Notes<br />
General information<br />
Notes on the cash fl ow statement. Notes General information<br />
Based in Hannover/Germany, <strong>Talanx</strong> AG heads Germany’s third-largest insurance group – with premium<br />
income of EUR 22.9 (20.9) billion in 2010 – as a fi nancial and management holding company.<br />
It does not, however, itself transact insurance business. The Group, which is active in more than 150<br />
countries worldwide through cooperation arrangements, off ers high-quality insurance services in<br />
non-life and life insurance as well as reinsurance and also conducts business in the asset management<br />
sector.<br />
The Group operates as a multi-brand provider in the divisions of Industrial Lines, Retail Germany,<br />
Retail International, Non-Life Reinsurance and Life/Health Reinsurance as well as Corporate Operations.<br />
Its brands include HDI and HDI-Gerling, off ering insurance solutions for retail and commercial<br />
customers as well as industrial clients, Hannover Re – one of the world’s leading reinsurers –, the<br />
bancassurance specialists Neue Leben, PB and Targo Versicherungen as well as the investment fund<br />
provider and asset manager AmpegaGerling. At the end of 2010 the companies belonging to the<br />
<strong>Talanx</strong> Group employed a total global workforce* of 16,874 (16,921).<br />
<strong>Talanx</strong> AG is a wholly-owned subsidiary of HDI Haft pfl ichtverband der Deutschen Industrie Ver si cherungsverein<br />
auf Gegenseitigkeit (ultimate parent company), Hannover (HDI V. a. G.), and the parent<br />
company for all Group companies belonging to HDI V. a. G. It is entered in the commercial register<br />
of Hannover County Court under the number HR Hannover B 52546 with the address “Riethorst 2,<br />
30659 Hannover”. In accordance with §§ 341 et seq. of the German Commercial Code (HGB) HDI V. a. G.<br />
is obliged to prepare consolidated annual accounts that include the annual fi nancial statements of<br />
<strong>Talanx</strong> AG and its subsidiaries. The consolidated annual accounts of the parent company are published<br />
in the electronic federal gazette.<br />
* Full-time equivalents as at 31 December<br />
115
116 <strong>Talanx</strong> Group Financial report 2010<br />
General accounting principles and application of<br />
International Financial Reporting Standards (IFRS)<br />
As the parent company of the <strong>Talanx</strong> Group, <strong>Talanx</strong> AG has drawn up a consolidated fi nancial statement<br />
pursuant to § 290 of the German Commercial Code (HGB). The consolidated fi nancial statement<br />
was prepared voluntarily on the basis of § 315 a Para. 3 of the German Commercial Code (HGB)<br />
pursuant to Article 4 of Regulation (EC) No. 1606/2002 in accordance with International Financial<br />
Reporting Standards (IFRS) in the form adopted for use in the European Union. The standards and<br />
rules specifi ed in § 315 a Para. 1 of the German Commercial Code (HGB) were observed in full.<br />
Since 2002 the standards adopted by the International Accounting Standards Board (IASB) have<br />
been referred to as IFRS (International Financial Reporting Standards); the standards approved<br />
in earlier years still bear the name IAS (International Accounting Standards). Standards are cited<br />
in our Notes accordingly; in cases where the Notes do not make explicit reference to a particular<br />
standard, the term IFRS is used. Insurance-specifi c transactions for which IFRS do not contain any<br />
separate standards are recognized in compliance with IFRS 4 “Insurance Contracts” according to the<br />
pertinent provisions of United States Generally Accepted Accounting Principles (US GAAP).<br />
The consolidated fi nancial statement refl ects all IFRS in force as at 31 December 2010 as well as all<br />
interpretations issued by the International Financial Reporting Interpretations Committee (IFRIC)<br />
and the previous Standing Interpretations Committee (SIC), application of which was mandatory<br />
for the 2010 fi nancial year and which were adopted by the EU. In addition, the German Accounting<br />
Standards (DRS) adopted by the German Accounting Standards Committee (DRSC) have been<br />
observed insofar as they do not confl ict with currently applicable IFRS standards.<br />
The consolidated fi nancial statement was drawn up in euros (EUR). The amounts shown have been<br />
rounded to EUR millions (EUR million), unless fi gures are required in EUR thousands (EUR thousand)<br />
for reasons of transparency. This may give rise to rounding diff erences in the tables presented in<br />
this report. Figures indicated in brackets refer to the previous year.<br />
Newly applicable standards/interpretations and changes in standards<br />
IFRS 3 (revised 2008) “Business Combinations” and resulting changes to IAS 27 “Consolidated and<br />
Separate Financial Statements”, IAS 28 “Investments in Associates” and IAS 31 “Interests in Joint<br />
Ventures” are applicable to acquisitions in fi nancial years beginning on or aft er 1 July 2009.<br />
The revised standard (IFRS 3), which was ratifi ed on 3 June 2009 by the EU, continues to require recognition<br />
of business combinations, albeit with some signifi cant changes. For example, all considerations<br />
paid for corporate acquisitions are to be measured at fair value at the time of acquisition.<br />
In this context, contingent considerations are carried as a liability and changes are recognized in<br />
profi t or loss upon remeasurement. An option is available on a transaction-by-transaction basis to<br />
recognize the non-controlling interest either at fair value or with the pro rata remeasured equity.<br />
All acquisition-related costs are expensed.
Notes General accounting principles and application of IFRS<br />
The standard was applied within the Group inter alia to the acquisition of the controlling interest in<br />
HDI Strakhovanie on 7 July 2010. Further details of the acquisition in the fi nancial year are provided<br />
in the subsection of the Notes entitled “Business combinations in the reporting period”.<br />
The revised IAS 27 requires the recognition of all eff ects of transactions with non-controlling<br />
interests in equity, insofar as there is no change in control and this transaction does not result in<br />
goodwill or in gains and losses. In case of a loss of control the standard provides detailed guidance<br />
on balance sheet recognition. The remaining interest is to be measured at fair value and any gain or<br />
loss arising upon remeasurement is to be carried as such. The revised standard had an eff ect on the<br />
reporting period, since inter alia transactions took place with non-controlling interests which are<br />
discussed in the section of the Notes entitled “Consolidation”, subsection “Scope of consolidation”<br />
(pages 155 et seqq.).<br />
The “Improvements to IFRSs (2009)” contains various amendments aff ecting twelve existing IFRS<br />
(ten standards and two interpretations) and is the second such collective standard published in the<br />
context of the IASB annual improvement process, which has been ongoing since 2006. The amendments<br />
are for the most part applicable to fi nancial years beginning on or aft er 1 January 2010 and<br />
had no signifi cant implications for the Group.<br />
In addition to the accounting standards described above, the following amendments to standards<br />
and interpretations were observed as at 1 January 2010:<br />
■ IFRS 1 “First-time Adoption of International Financial Reporting Standards”: The new version of<br />
IFRS 1 contains the provisions of the previously applicable standard, but diff ers in its structure.<br />
In addition, the amendments to the standard “Additional Exemptions for First-time Adopters”<br />
introduce simplifi cations into IFRS 1, which relate inter alia to the oil and gas industry as well as<br />
the application of IFRIC 4 “Determining whether an Arrangement contains a Lease”. The revised<br />
standard had no eff ect on the consolidated fi nancial statement.<br />
■ IFRS 2 “Share-based Payment”: The changes relate to the scope of application of IFRS 2 and also<br />
clarify that the meaning of the term “group” in IFRS 2 is the same as in IAS 27.<br />
■ IAS 39 “Financial Instruments: Recognition and Measurement – Eligible Hedged Items”: The<br />
amendments to IAS 39 clarify circumstances in which the infl ation portion of fi nancial instruments<br />
can be hedged and explain how to treat options contracts used as hedging instruments.<br />
■ Amendments to IFRS 5 “Non-current Assets Held for Sale and Discontinued Operations” (through<br />
the “Annual Improvements to IFRSs 2008” project): The amendments principally consist of specifi<br />
cations of disclosure requirements.<br />
■ IFRIC 12 “Service Concession Arrangements”: IFRIC 12 clarifi es how underlying infrastructure<br />
assets are to be recognized by the operator of a service concession arrangement. This new provision<br />
had no infl uence on the consolidated fi nancial statement.<br />
117
118 <strong>Talanx</strong> Group Financial report 2010<br />
■ IFRIC 15 “Agreements for the Construction of Real Estate”: IFRIC 15 provides guidance as to the<br />
cases in which revenue from the construction of real estate is to be recognized in the fi nancial<br />
statement and whether a contract for the construction of real estate falls within the scope of<br />
IAS 11 “Construction Contracts” or IAS 18 “Revenue”. This new interpretation had no relevance to<br />
the consolidated fi nancial statement in the reporting period.<br />
■ IFRIC 16 “Hedges of a Net Investment in a Foreign Operation”: This interpretation, which had no<br />
eff ect on the consolidated fi nancial statement, clarifi es possible hedges of a net investment in a<br />
foreign operation and the recognition thereof.<br />
■ IFRIC 17 “Distributions of Non-cash Assets to Owners”: The interpretation provides guidance for<br />
the recognition of non-cash distributions to owners that were distributed either from reserves or<br />
as a dividend. The new interpretation had no eff ect on the consolidated fi nancial statement.<br />
■ IFRIC 18 “Transfer of Assets from Customers”: This interpretation, which is of no relevance to the<br />
Group, sets out how an entity shall recognize the transfer of items of property, plant and equipment<br />
from a customer. The scope of application of this interpretation includes, inter alia, contracts<br />
under which an entity receives an item of property, plant and equipment from a customer<br />
which it must then use to connect the customer to a network and/or provide the customer with<br />
ongoing access to a supply of goods or services (such as a supply of electricity, gas or water).<br />
Insofar as they were of any practical relevance to the consolidated fi nancial statement, the adoption<br />
of these amendments and interpretations had no material infl uence on the Group’s assets,<br />
fi nancial position or net income in the reporting period.<br />
Standards, interpretation and changes to published standards, application of which was not yet<br />
mandatory in 2010 and which were not applied early by the Group<br />
The Group’s assessment of the eff ects of these new standards, interpretations and amendments to<br />
existing standards is set out below.<br />
In November 2009 the IASB published the revised IAS 24 “Related Party Disclosures”, which replaces<br />
IAS 24 (2003). The new standard must be applied to fi nancial years beginning on or aft er 1 January<br />
2011. Among the major new features of IAS 24 (rev.) is the requirement for disclosures of, inter alia,<br />
guarantees, undertakings and other commitments which are dependent upon whether (or not) a<br />
particular event occurs in the future. The defi nition of a related entity or a related person is also<br />
clarifi ed. The standard, the implications of which for the Group are currently under review, was ratifi<br />
ed by the EU in July 2010.
Notes General accounting principles and application of IFRS<br />
In December 2009 the EU adopted the amendments to IAS 32 “Financial Instruments: Presentation<br />
– Classifi cation of Rights Issues” in European law. IAS 32 was amended such that subscription<br />
rights as well as options and warrants for a fi xed number of treasury shares against a fi xed amount<br />
of any currency are to be classifi ed as equity instruments as long as these are issued pro rata to all<br />
an entity’s existing shareholders of the same class. The amendments to IAS 32 must be applied to<br />
fi nancial years beginning on or aft er 1 February 2010. It is not expected to have any implications for<br />
the consolidated fi nancial statement.<br />
IAS 19 “Prepayments of a Minimum Funding Requirement” (Amendments to IFRIC 14): This amendment<br />
was ratifi ed by the EU in July 2010 and must be applied to fi nancial years beginning on or<br />
aft er 1 January 2011. The amendments are of relevance if a pension plan provides for minimum<br />
funding requirements and the entity makes an early payment of contributions to cover those<br />
requirements. No implications for the Group are currently anticipated.<br />
In November 2009 the IFRIC published IFRIC 19 “Extinguishing Financial Liabilities with Equity<br />
Instruments”. The interpretation addresses accounting by the debtor if renegotiated contractual<br />
conditions of a fi nancial liability enable it to extinguish all or part of a fi nancial liability through<br />
the issue of its own equity instruments (debt for equity swaps). The equity instruments are to be<br />
measured at fair value upon issuance. Diff erences between the fair value of the equity instrument<br />
and the carrying amount of the extinguished liability are recognized in profi t or loss. The interpretation<br />
was adopted by the EU in July 2010 and must be applied to fi nancial years beginning on or<br />
aft er 1 July 2010. We do not expect application of the new standard to have any eff ect on the Group.<br />
Also in November 2009 the IASB published a new standard on the classifi cation and measurement<br />
of fi nancial instruments, which was expanded in October 2010 to include rules governing<br />
the accounting of fi nancial liabilities and derecognition of fi nancial instruments. IFRS 9 is the fi rst<br />
step in a three-phase project intended to replace IAS 39 “Financial Instruments: Recognition and<br />
Measurement”. The new standard introduces a revised classifi cation of fi nancial assets. In future,<br />
the standard envisages only two categories of fi nancial assets: those measured at “fair value” and at<br />
“amortized costs”. Reclassifi cation will only be possible if the business model changes signifi cantly.<br />
Equity investments that fall within the scope of application of IFRS 9 are to be measured at fair<br />
value in the balance sheet, with value changes recognized in profi t or loss. An exception in this regard<br />
is an equity investment which an entity elects to measure at fair value through other comprehensive<br />
income (FVTOCI). The Group has still to analyze the full implications of IFRS 9. It is, however,<br />
already becoming clear that the revised rules will have an infl uence, inter alia, on the accounting of<br />
fi nancial assets within the Group. The standard does not apply until fi nancial years beginning on or<br />
aft er 1 January 2013; it has still to be adopted in European law.<br />
119
120 <strong>Talanx</strong> Group Financial report 2010<br />
On 7 October 2010 the IASB published amendments to IFRS 7 “Financial Instruments: Disclosures”<br />
which are applicable to fi nancial years beginning on or aft er 1 July 2011. The amendments concern<br />
disclosure requirements in connection with the transfer of fi nancial assets. A transfer of fi nancial<br />
assets exists, for example, where receivables are sold or in the case of asset-backed securities (ABS)<br />
transactions. The amendments have still to be ratifi ed by the EU. We are currently reviewing the<br />
implications for the consolidated fi nancial statement.<br />
In May 2010 the IASB published the third annual collection of minor amendments to IFRS –<br />
“Improve ments to IFRSs (2010)”. Most amendments must be applied to fi nancial years beginning<br />
on or aft er 1 January 2011; the EU ratifi ed the standard in February 2011. We are currently examining<br />
the implications of these amendments for the consolidated fi nancial statement.<br />
In December 2010 the IASB published amendments to IAS 12 “Income Taxes”, which has still to be<br />
adopted by the EU. These new rules include clarifi cation of the treatment of temporary tax diff erences<br />
in connection with measurement using the fair value model of IAS 40 “Investment Property”.<br />
The amendment enters into force for reporting years beginning on or aft er 1 January 2012. We do<br />
not expect the application of these amendments to have any eff ect on the consolidated fi nancial<br />
statement.
Accounting policies<br />
Notes General accounting principles and application of IFRS. Accounting policies<br />
The annual fi nancial statements of the subsidiaries, special funds and special purpose entities<br />
included in the Group are governed by uniform accounting policies, the application of which is<br />
based on the principle of consistency. The accounting policies as well as changes in the accounting<br />
principles and changes in the presentation of the consolidated fi nancial statement are explained<br />
below. Newly applicable accounting standards in the 2010 fi nancial year are described in the section<br />
“General accounting principles and application of IFRS”, while the consolidation principles are<br />
discussed in the section “Consolidation” (pages 154 et. seqq.).<br />
Change in segment reporting<br />
At the commencement of the 2010 fi nancial year the Group reorganized its insurance activities in<br />
primary insurance and adjusted the Group structure accordingly. Refl ecting this development, the<br />
management of the Group changed in line with the revised responsibilities on the Board of Management<br />
as did the internal reporting. The Reinsurance division is not aff ected by the restructuring;<br />
the two reporting segments of Non-Life Reinsurance and Life/Health Reinsurance therefore remain<br />
unchanged.<br />
In keeping with the requirements of IFRS 8 “Operating Segments” (management approach), this organizational<br />
reconfi guration led to a change in the segment report for all comparable periods. The<br />
number of reportable segments consequently increased. Based on the information reported to the<br />
Group’s chief operating decision-makers for the allocation of resources and performance of business,<br />
the reportable segments under IFRS 8 were identifi ed according to the structure of insurance<br />
activities geared to customer groups. The two existing primary insurance segments – Property/<br />
Casualty Primary Insurance and Life Primary Insurance – have therefore been converted into three<br />
reportable segments that span the various lines of business: “Industrial Lines”, “Retail Germany”<br />
and “Retail International”. The Corporate Operations segment was modifi ed, but continues to consist<br />
of companies that predominantly perform functional tasks within the Group. Since goodwill is<br />
allocated principally to groups of cash-generating units mostly on the segment level, the management<br />
was compelled to allocate portions of goodwill to the newly identifi ed operational segments<br />
(see explanatory remarks in the “Goodwill” subsection of the section “Notes on the consolidated<br />
balance sheet – assets”, pages 187 et seqq.).<br />
Consolidation bookings are shown in a pure consolidation column in which cross-segment transactions<br />
within the Group are off set. Refl ecting the internal management and the reporting, income<br />
from dividend payments and profi t/loss transfer agreements accruing to the Group holding<br />
company are eliminated in the Corporate Operations segment. The revised segmentation aff ects<br />
consolidation both within and between the segments. In individual cases this resulted in changes<br />
in disclosures in the segmental income statement and segmental balance sheet. For further<br />
information on the segment report see the remarks in the section of the Notes entitled “Segment<br />
reporting”.<br />
121
122 <strong>Talanx</strong> Group Financial report 2010<br />
Change in the presentation of the consolidated balance sheet and<br />
consolidated statement of income<br />
Analogously to the internal reporting and the modifi cation of segment reporting, we adjusted disclosures<br />
in the consolidated balance sheet and consolidated statement of income as shown below.<br />
These changes in presentation are made retrospectively and had no implications for the amounts<br />
recognized in previous years. The comparable amounts for reclassifi cation from the previous year<br />
are shown in brackets:<br />
■ The operating result (EBIT) is split into the partial profi t indicators of the technical and non-technical<br />
result. In this context, the “other technical result” is reclassifi ed from the non-technical account<br />
(previously part of the “other income/expenses”; 2009: –EUR 252 million) and recognized<br />
as a separate profi t indicator. The “other technical expenses” include, inter alia, the amortization<br />
of insurance-related intangible assets – to the extent that they relate to the shareholders’ portion<br />
(previously recognized in the profi t item “Amortization of insurance-related intangible assets<br />
and goodwill impairments”; 2009: EUR 79 million).<br />
■ The investment income includes not only the interest income on funds withheld and contract<br />
deposits but also the interest expense on funds withheld and contract deposits, which was previously<br />
recognized under “other expenses” (2009: EUR 207 million). Income from investments<br />
under own management, i.e. excluding interest income on funds withheld and contract deposits,<br />
is also shown. A corresponding separation is made in the consolidated balance sheet between<br />
investments under own management and total investments including funds held by ceding<br />
companies.<br />
■ Amortization from diff erences relating to our subordinated liabilities is recognized in the item<br />
“Financing costs” (previously under “other income/expenses”; 2009: –EUR 3 million).<br />
■ Goodwill impairments are now recognized separately (2009: EUR 92 million). Along with the<br />
insurance-related intangible assets (see above), we reclassifi ed the amortization on acquired<br />
insurance portfolios to other expenses (2009: EUR 98 million; previously also recognized in the<br />
item “Amortization of insurance-related intangible assets and goodwill impairments”).<br />
■ In the investments part of the consolidated balance sheet, the fi nancial instruments at fair value<br />
through profi t or loss (2009: EUR 861 million) are combined with the trading portfolio (2009:<br />
EUR 238 million) under a single item “Financial instruments at fair value through profi t or loss”;<br />
a breakdown is provided in the Notes. Derivative fi nancial instruments, insofar as they have<br />
positive fair values and do not constitute hedging instruments, are consistently allocated to the<br />
“fi nancial instruments held for trading” (2009: reclassifi cation of EUR 58 million from the item<br />
“Financial instruments at fair value through profi t or loss”; reclassifi cation in the opening balance<br />
sheet as at 1 January 2009: EUR 45 million). Individual fi nancial instruments belonging<br />
to the category “ Financial instruments available for sale” that were previously recognized<br />
under the “other invested assets” will in future also be shown under this item of the balance<br />
sheet (2009: EUR 475 million; reclassifi cation in the opening balance sheet as at 1 January 2009:<br />
EUR 422 million).
Changes in accounting policies and accounting errors<br />
Notes Accounting policies<br />
In the 2010 fi nancial year we adjusted the previous year’s fi gures with respect to the following<br />
circumstances retrospectively as at 31 December 2009 in accordance with the requirements of IAS 8<br />
“Accounting Policies, Changes in Accounting Estimates and Errors”:<br />
a) As a consequence of the Group-internal sale to a non-life insurer at book value of a life insurer<br />
required to pay surplus distributions – a sale which had been already been decided upon at the<br />
time when the 2009 annual fi nancial statement was drawn up (the transfer of ownership occurred<br />
in 2010) – the recoverability of the provision for deferred premium refunds capitalized<br />
as at 31 December 2009 no longer existed at this time. This gave rise to the need to adjust the<br />
disclosure of assets-side provisions for deferred premium refunds and deferred tax assets in an<br />
amount of EUR 33 million in the consolidated fi nancial statement as at 31 December 2009. The<br />
profi t reported in the Retail Germany segment that was increased by this amount was retroactively<br />
reduced in the income statement (aft er taxes) for the comparable 2009 period by writing<br />
down the excessively high disclosure of the assets-side items. The retained earnings recognized<br />
in the comparable period until 31 December 2009 decreased accordingly by this amount. The<br />
opening balance sheet as at 1 January 2009 was not aff ected since the decision on the sale was<br />
not taken until the fourth quarter of 2009.<br />
b) In addition, in the fi rst quarter of 2010 we adjusted a booking from the previous year that required<br />
correction in connection with the entry of a major claim in the Industrial Lines segment.<br />
The reinsurance relief was booked twice, necessitating adjustment of the item “Reinsurance<br />
recoverables on technical provisions” as well as the corresponding deferred taxes. The fi gures for<br />
the previous year as at 31 December 2009 were adjusted by EUR 8 million in the income statement<br />
(aft er taxes). This gave rise to a corresponding reduction in retained earnings in the same<br />
amount. The opening balance sheet as at 1 January 2009 was not aff ected by the adjustment<br />
since the incorrect entry of the claim was not made until the fourth quarter of 2009.<br />
c) In the second quarter of 2010 the currency translation of the PVFP resulting from the assumption<br />
of a US life reinsurance portfolio in the Life/Health Reinsurance segment was retroactively<br />
adjusted as at 31 December 2009 by an amount of EUR 2 million; of this amount, EUR 1 million<br />
was attributable to minority interests. The retained earnings and minority interest in shareholders’<br />
equity recognized in the comparable period each increased by EUR 1 million.<br />
d) In the 2010 fi nancial year the Group corrected the balance sheet recognition of certain life reinsurance<br />
contracts. In accordance with applicable US GAAP (FASB ASC 340–30), technical assets and<br />
liabilities relating to these contracts are to be off set in the balance sheet. These off setting rules<br />
were not applied consistently within the Group in previous reporting periods. In accordance with<br />
the requirements of IAS 8, we therefore adjusted the comparable fi gures in the present fi nancial<br />
statement. The adjustments had no implications for Group net income or shareholders’ equity in<br />
any of the previous reporting periods. Relative to the fi gures originally shown, the balance sheet<br />
items “funds withheld” (assets side) and “contract deposits” (liabilities side) are each reduced by<br />
EUR 1,429 million as at 31 December 2009. The decrease in these balance sheet items in the opening<br />
balance sheet as at 1 January 2009 amounted to EUR 1,852 million in each case.<br />
123
124 <strong>Talanx</strong> Group Financial report 2010<br />
The adjustments made in the 2010 fi nancial year pursuant to IAS 8 had the following eff ects on the<br />
consolidated balance sheet as at 31 December 2009. Refl ecting the explanatory remarks provided<br />
above, the specifi c circumstances are labeled with the letters a) to d):<br />
31.12.2009 Changes from adjustments pursuant<br />
Consolidated balance sheet<br />
as reported to IAS 8 having an eff ect on 2009 31.12.2009<br />
Figures in EUR million<br />
Assets<br />
Re a) Re b) Re c) Re d)<br />
A. b. Other intangible assets 2,152 — — 2 — 2,154<br />
B. g. Funds held by ceding companies 10,778 — — — –1,429 9,349<br />
D. Reinsurance recoverables on<br />
technical provisions 5,974 — –12 — — 5,962<br />
Liabilities<br />
A. b. Reserves 4,354 –33 –8 1 — 4,314<br />
A. c. Minority interests 2,578 — — 1 — 2,579<br />
C. d. Provision for premium refunds 1,242 32 — — — 1,274<br />
F. b. Funds held under reinsurance treaties 5,943 — — — –1,429 4,514<br />
G. Deferred tax liabilities 1,512 1 –4 — — 1,509<br />
The eff ects on the consolidated statement of income for the 2009 fi nancial year are as follows:<br />
31.12.2009<br />
Changes from adjustments<br />
pursuant to IAS 8 having an<br />
Consolidated statement of income<br />
as reported eff ect on 2009 31.12.2009<br />
Figures in EUR million Re a) Re b) Re c)<br />
6. Claims and claims expenses (gross) 15,069 32 — — 15,101<br />
6. Claims and claims expenses (gross)<br />
Reinsurers’ share 1,055 — –12 — 1,043<br />
10. b. Other non-technical expenses1) 1,007 — — –2 1,005<br />
13. Taxes on income 474 1 –4 — 471<br />
Net income<br />
– thereof minority interest in profi t or loss<br />
Net income<br />
407 — — 1 408<br />
– thereof Group net income 525 –33 –8 1 485<br />
1) Aft er adjusted presentation of the consolidated statement of income
Notes Accounting policies<br />
We corrected the following circumstances in the 2010 fi nancial year through adjustment of the<br />
opening balance sheet as at 1 January 2010; retrospective application to prior years was omitted,<br />
since in this regard determination of the period-related adjustments was not feasible or did not<br />
seem advisable aft er weighing up cost/benefi t considerations:<br />
a) Cessions to the reinsurer under a reinsurance treaty in the Industrial Lines segment, which were<br />
not entered correctly in the past, were rectifi ed in the current reporting period. This reduced the<br />
retained earnings (aft er taxes) by EUR 12 million.<br />
b) In connection with a changeover in data delivery for a certain investment portfolio, the measurement<br />
of fi nancial assets – in the performance of which <strong>policy</strong>holders also participate – was converted<br />
to uniform methods. This procedure served to reduce the retained earnings by EUR 3 million;<br />
the other reserves increased by the same amount.<br />
The adjustments had the following implications for the 2010 opening balance sheet:<br />
Consolidated balance sheet Adjustments 2010<br />
Figures in EUR million<br />
Assets<br />
Re a) Re b)<br />
D. Reinsurance recoverables on technical provisions –18 —<br />
Liabilities<br />
A. b. Reserves – retained earnings –12 –3<br />
A. b. Reserves – other reserves — 3<br />
G. Deferred tax liabilities –6 —<br />
Changes in estimates during the reporting period<br />
The Group has refi ned the calculation logic for the fair values of derivatives in connection with<br />
Modifi ed Coinsurance/Coinsurance Funds Withheld reinsurance treaties. This represents a change<br />
in an accounting estimate, which was performed in the year under review without adjustment of<br />
the comparative fi gures for previous years. Within the scope of the accounting of ModCo reinsurance<br />
treaties, under which securities deposits are held by the ceding companies and payments<br />
rendered on the basis of the income from certain securities of the ceding company, the interest-rate<br />
risk elements are clearly and closely related to the underlying reinsurance arrangements. Embedded<br />
derivatives consequently result solely from the credit risk of the underlying securities portfolio.<br />
We calculate the fair values of the embedded derivatives in ModCo treaties using the market information<br />
available on the valuation date on the basis of a “credit spread” method. Through refi nement<br />
of the calculation logic for these derivatives, the risks from the aforementioned contracts<br />
are established on a more market-oriented basis. The derivative (balance sheet item: “Financial<br />
instruments at fair value through profi t or loss”, subitem: “Financial instruments held for trading”)<br />
had a fair value of EUR 45 million as at the balance sheet date (31 December 2009: EUR 32 million).<br />
Retention of the parameters used until the fi rst quarter of 2010 to calculate the fair values would<br />
have produced a value of EUR 27 million. The eff ect of this refi nement of the calculation logic on the<br />
value of the derivative in future reporting periods could only have been determined with a disproportionately<br />
high eff ort.<br />
125
126 <strong>Talanx</strong> Group Financial report 2010<br />
Major discretionary decisions and estimates<br />
The preparation of the consolidated fi nancial statement to some extent necessitates discretionary<br />
decisions and estimates – in relation to the future – which aff ect the disclosure, recognition and<br />
measurement of some items in the balance sheet and statement of income as well as the information<br />
on contingent claims and liabilities as at the balance sheet date. The estimates and assumptions,<br />
which entail a signifi cant risk in the form of a material adjustment of the book values of<br />
assets and contingent claims and liabilities within the next fi nancial year, are discussed below or<br />
set out in the accounting policies or directly in the notes on individual items.<br />
Impairment test of goodwill: In accordance with the subsection entitled “Goodwill”, the Group tests<br />
for impairment of goodwill. Insofar as the recoverable amount is based on calculations of the value<br />
in use, appropriate assumptions are used as a basis (see item 1 of the Notes “Goodwill”, pages 187 et<br />
seqq.).<br />
Fair value of derivative and other fi nancial instruments: Fair values and impairments for fi nancial<br />
instruments not traded on an active market (e.g. derivatives in connection with Modifi ed Coinsurance/Coinsurance<br />
Funds Withheld treaties) are determined using appropriate measurement<br />
methods. In this regard please see our remarks on the determination of fair values as well as the<br />
applicability criteria for determination of the need to take impairments on certain fi nancial instruments<br />
in the subsection entitled “Investments including income and expenses”.<br />
Technical provisions: The loss and loss adjustment expense reserves, the amount and maturity<br />
of which are uncertain, are recognized according to “best estimate” principles in the amount that<br />
will probably be utilized. The actual amounts payable may prove to be higher or lower; any resulting<br />
run-off profi ts or losses are recognized in income. In the area of life insurance and life/health<br />
reinsurance the determination of provisions and assets is crucially dependent on actuarial projections<br />
of the business. In this context key input parameters are either predetermined by the tariff<br />
(e.g. costs included in the calculation, amount of premium, actuarial interest rate) or estimated<br />
(e.g. mortality, morbidity or lapse rates). These assumptions are heavily dependent, inter alia, on<br />
country-specifi c parameters, sales channel, quality of underwriting and type of reinsurance. For the<br />
purposes of US GAAP accounting these assumptions are reviewed as at each balance sheet date and<br />
subsequently adjusted in line with the actual projection. The resulting eff ects are refl ected inter alia<br />
as true-up adjustments in the balance sheet items “Other intangible assets”, “Deferred acquisition<br />
costs”, “Provision for premium refunds” (provision for deferred premium refunds) and, as appropriate,<br />
the “Benefi t reserve” (funding of maturity bonuses).
Notes Accounting policies<br />
Deferred acquisition costs: The actuarial bases for amortization of the deferred acquisition costs<br />
are continuously reviewed and, as necessary, adjusted. Impairment tests are carried out through<br />
regular checks on, inter alia, profi t developments, lapse assumptions and default probabilities.<br />
Present value of future profi ts (PVFP) on acquired insurance portfolios: The PVFP is the present<br />
value of the expected future net cash fl ows from existing life insurance contracts at the time of<br />
acquisition and is determined using actuarial methods. Uncertainties may arise, inter alia, with<br />
regard to the expected amount of these net cash fl ows.<br />
Realizability of deferred tax assets: Estimates are made in particular with respect to the utilization<br />
of tax loss carry-forwards, fi rst and foremost in connection with deferred tax liabilities recognized<br />
in the balance sheet and expected future earnings.<br />
Provisions for pensions and similar obligations: The present value of pension obligations is infl uenced<br />
by numerous factors based on actuarial assumptions. The assumptions used to calculate the<br />
net expenses (and income) for pensions include the discount rate. Further key assumptions used<br />
to establish the pension liabilities are provided in item 22 “Provisions for pensions and other postemployment<br />
benefi t obligations” of these Notes.<br />
The actual amounts may diverge from the estimated amounts.<br />
Summary of major accounting policies<br />
Recognition of insurance contracts<br />
In March 2004 the IASB published IFRS 4 “Insurance Contracts”. The fi rst standard governing the<br />
accounting of insurance contracts, it divides the “Insurance Contracts” project into two phases.<br />
IFRS 4 represents the outcome of Phase 1 and serves as a transitional arrangement until the IASB<br />
redefi nes the measurement of insurance contracts aft er completion of Phase 2. The exposure draft<br />
(ED/2010/8) “Insurance Contracts” has now been published; the fi nal standard is expected in the<br />
second quarter of 2011.<br />
IFRS 4 (Phase 1) – which also applies to reinsurance contracts – requires that all contracts written by<br />
insurance companies be classifi ed either as insurance contracts or investment contracts. An insurance<br />
contract exists if one party (the insurer) assumes a signifi cant insurance risk from another<br />
party (the <strong>policy</strong>holder) by agreeing to pay the <strong>policy</strong>holder compensation if a defi ned uncertain<br />
future event detrimentally impacts the <strong>policy</strong>holder. For the purposes of recognizing insurance<br />
contracts within the meaning of IFRS 4, insurance companies are permitted to retain their previously<br />
used accounting practice for insurance contracts for the duration of the currently applicable<br />
project stage (Phase 1). Underwriting items in the consolidated fi nancial statement are therefore<br />
recognized in accordance with US GAAP. All contracts without a signifi cant underwriting risk are<br />
treated as investment contracts pursuant to IFRS 4. Investment contracts that carry a discretionary<br />
surplus participation are also recognized in accordance with US GAAP. Investment contracts that<br />
do not have a discretionary surplus participation are treated as fi nancial instruments pursuant to<br />
IAS 39.<br />
127
128 <strong>Talanx</strong> Group Financial report 2010<br />
Assets<br />
Intangible assets<br />
Intangible assets – with the exception of goodwill and insurance-related intangible assets – are<br />
recognized at amortized costs less scheduled straight-line depreciation and, as appropriate, impairment<br />
losses. The following useful lives were taken as a basis for all intangible assets with the exception<br />
of goodwill.<br />
Software (self-developed or purchased) 3–10 years<br />
Insurance-related intangible assets (subject to the underlying insurance contracts) Until approx. 2056<br />
Goodwill<br />
The goodwill arising out of corporate acquisitions is the positive diff erence between the cost of<br />
acquisition and the pro-rata fair value of identifi ed assets, liabilities and contingent liabilities<br />
(fair value of the revalued net assets). Negative diff erences from initial consolidation are to be<br />
recognized immediately in income aft er fresh testing pursuant to IFRS 3 “Business Combinations”.<br />
Goodwill is an asset with an indefi nite useful life and hence scheduled depreciation is not taken;<br />
instead, in accordance with IFRS 3 “Business Combinations” in conjunction with IAS 36 “Impairment<br />
of Assets”, goodwill is tested for impairment at least annually according to the “impairment-only<br />
approach” and written down as necessary depending on the outcome of the test. An impairment<br />
loss established in this way is recognized in income.<br />
For the purposes of the impairment test pursuant to IAS 36.80 et seqq. “Impairment of Assets”,<br />
goodwill is allocated to “cash generating units” (CGUs) (see item 1 of these Notes “Goodwill”<br />
pages 187 et seqq.). In order to determine a possible impairment the recoverable amount – defi ned<br />
as the higher of the value in use or the fair value less costs to sell – of a CGU is established and<br />
compared with the carrying values of this CGU in the Group including goodwill. If the carrying values<br />
including goodwill exceed the recoverable amount, a goodwill impairment is recognized. The<br />
impairment loss on goodwill is recognized as a separate item in the statement of income.
Notes Accounting policies<br />
Insurance-related intangible assets<br />
The present value of future profi ts (PVFP) on acquired insurance portfolios refers to the present<br />
value of the expected future net cash fl ows from life insurance contracts existing at the time of<br />
acquisition. It consists of a shareholders’ and tax portion, on which deferred taxes are established,<br />
and a <strong>policy</strong>holders’ portion. Amortization is taken on the insurance portfolios according to the<br />
realization of the surpluses on which the calculation is based. Impairment and the measurement<br />
parameters used are tested at least once a year; as necessary, the amortization patterns are adjusted<br />
or an impairment loss is taken. Only the amortization of the shareholders’ portion is taken as a<br />
charge against future earnings. The portion of the PVFP in favor of <strong>policy</strong>holders is recognized as a<br />
liability by life insurance companies which are required to enable their <strong>policy</strong>holders to participate<br />
in all profi ts through the establishment of a provision for deferred premium refunds.<br />
Soft ware<br />
The other intangible assets also consist of acquired and self-developed soft ware. Intangible assets<br />
acquired for a consideration are recognized at amortized costs; self-developed soft ware is carried at<br />
production cost less straight-line depreciation. The other intangible assets are tested for impairment<br />
as at the balance sheet date and written down if necessary. These depreciation and impairment<br />
expenses are allocated to the functional units; insofar as allocation to functional units is not<br />
possible, they are recognized under other expenses. Write-ups on these assets are recognized in<br />
other income.<br />
Investments including income and expenses<br />
With respect to real estate, a distinction is made between investment property and own-use real<br />
estate based on the following criteria: investment and own-use real estate for mixed-use properties<br />
is classifi ed separately if the portions used by third parties and for own use could be sold separately.<br />
If this is not the case, properties are only classifi ed as investment property if less than 10% is used<br />
by Group companies.<br />
129
130 <strong>Talanx</strong> Group Financial report 2010<br />
Investment property is measured at acquisition or manufactoring costs less scheduled depreciation<br />
and impairment. Scheduled depreciation is taken on a straight-line basis over the expected useful<br />
life, at most 50 years. An impairment expense is taken if the market value (recoverable amount)<br />
determined using recognized valuation methods is less than the carrying amount. In the case of<br />
the directly held portfolio, a qualifi ed external opinion is drawn up for each object every fi ve years<br />
on the basis of the discounted cash fl ow method (calculation of the discounted cash fl ows from<br />
rents etc. that can be generated from an object). Expert opinions are obtained at shorter intervals if<br />
special facts or circumstances exist that may aff ect the value. In addition, internal assessments are<br />
drawn up per object on each balance sheet date, also based on the discounted cash fl ow method, in<br />
order to review the value. An external fair value opinion is obtained for real estate special funds every<br />
12 months – the key date is the date of fi rst appraisal. For properties that are not rented out, the<br />
fair value is established using the discounted cash fl ow method in light of the forecast vacancy rate.<br />
Maintenance costs and repairs are expensed in investment income; value-enhancing expenditures<br />
are capitalized using the equity method and can extend the useful life in individual cases.<br />
Investments in associated companies encompass solely the associated companies valued using the<br />
equity method on the basis of the proportionate shareholders’ equity attributable to the Group.<br />
The portion of an associated company’s year-end result relating to the Group is included in the<br />
net investment income. The shareholders’ equity and year-end result are taken from the associated<br />
company’s latest available annual fi nancial statement. In this context, allowance is made for<br />
specifi c extraordinary circumstances in the appropriate reporting period, if they are material to the<br />
associated company’s assets, fi nancial position or net income.<br />
Financial assets/liabilities including derivative fi nancial instruments in the directly held portfolio<br />
are recognized/derecognized upon acquisition or sale as at the settlement date in accordance with<br />
IAS 39 “Financial Instruments: Recognition and Measurement”. Upon addition to the portfolio,<br />
fi nancial assets are allocated to the four categories “loans and receivables”, “fi nancial instruments<br />
held to maturity”, “fi nancial instruments available for sale” and “fi nancial instruments at fair value<br />
through profi t or loss”. Financial liabilities are classifi ed either as “fi nancial instruments at fair<br />
value through profi t or loss” or “at amortized cost”. Depending on their categorization, the transaction<br />
costs directly connected with the acquisition may be recognized. Subsequent measurement of<br />
fi nancial instruments depends on the above categorization and is carried out either at amortized<br />
cost or at fair value. The amortized costs are determined from the historical costs aft er allowance<br />
for amounts repayable, premiums or discounts amortized within the statement of income using<br />
the eff ective interest rate method and any unscheduled impairment. Fair value is the amount for<br />
which an asset could be exchanged between knowledgeable, willing parties in an arm’s length transaction<br />
or for which a liability could be settled.
Notes Accounting policies<br />
Financial instruments due on demand are recognized at face value. Such instruments include inter<br />
alia cash in hand and funds held by ceding companies.<br />
The item Investments in affi liated companies and participating interests consists inter alia of investments<br />
in companies that are not consolidated because of their subordinate importance for the<br />
presentation of the assets, fi nancial position and net income of the Group. Associated companies<br />
not measured at equity on account of their subordinate importance are also carried in this item<br />
of the balance sheet. Recognition of investments in listed companies is at fair value on the balance<br />
sheet date; other investments are recognized at cost, less impairments where applicable.<br />
Loans and receivables are non-derivative fi nancial instruments with fi xed or determinable payments<br />
that are not listed on an active market and are not intended to be sold at short notice.<br />
They consist primarily of fi xed-income securities in the form of borrower’s note loans, registered<br />
debentures and mortgage loans. They are carried at amortized cost using the eff ective interest<br />
rate method. The individual receivables are tested for impairment as at the balance sheet date.<br />
Unscheduled depreciation is taken if full repayment of the loan or receivable is no longer expected.<br />
Reversals are recognized in earnings via the statement of income. The upper limit of the write-up is<br />
the amortized cost that would have arisen at the measurement date without impairment.<br />
Financial assets held to maturity are comprised of fi nancial assets that entail fi xed or determinable<br />
payments and have a defi ned due date, but which are not loans or receivables. The Group has<br />
the intention and ability to hold the securities recognized here until maturity. The procedure for<br />
measuring and testing impairment is the same as for the “loans and receivables”.<br />
Financial assets classifi ed as available for sale include fi xed-income or variable-yield fi nancial assets<br />
that the Group does not immediately intend to sell and that cannot be allocated to any other<br />
category. These securities are carried at fair value. Premiums and discounts are spread over the maturity<br />
period so as to achieve a constant eff ective interest rate. Unrealized gains and losses arising<br />
out of changes in fair value are recognized via the other income/expenses in equity (other reserves)<br />
aft er allowance for accrued interest, deferred taxes and premiums at life insurers due to <strong>policy</strong>holders<br />
upon realization (provision for deferred premium refunds).<br />
131
132 <strong>Talanx</strong> Group Financial report 2010<br />
Financial assets at fair value through profi t or loss consist of the trading portfolio and those fi nancial<br />
assets categorized upon acquisition as measured at fair value through profi t or loss. The trading<br />
portfolios (fi nancial instruments held for trading) contain all fi xed-income and variable-yield<br />
securities that the Group acquired for trading purposes and with the aim of generating short-term<br />
gains. In addition, all derivative fi nancial instruments with positive fair values including embedded<br />
derivatives in hybrid fi nancial instruments that must be separated as well as derivatives connected<br />
with insurance contracts that do not satisfy the requirements for recognition as a hedging relationship<br />
(hedge accounting as per IAS 39) are carried here. Derivatives with negative fair values are<br />
shown under other liabilities. We use derivative fi nancial instruments to a carefully judged extent<br />
in order to hedge parts of our portfolio against interest rate and market price risks, optimize returns<br />
or realize intentions to buy/sell. Financial assets held for trading are carried at their fair value<br />
on the balance sheet date. Financial assets at fair value through profi t or loss consist principally of<br />
unsecured debt instruments issued by corporate issuers. Structured products are also recognized in<br />
this category subject to application of the fair value option provided in IAS 39. Structured fi nancial<br />
instruments requiring separation from the host contract – the fair value of which can be reliably<br />
established – that would have had to have been broken down into their constituent components<br />
(host contract and one or more embedded derivatives) had they been allocated to the loans and<br />
receivables, held to maturity or available for sale categories are also recognized here. The Group<br />
utilizes the fair value option solely for selected parts of the investment portfolio.<br />
All securities measured at fair value through profi t or loss are carried at fair value on the balance<br />
sheet date. If market prices are not available as fair values, the carrying values are established using<br />
recognized measurement methods. All unrealized gains or losses from this valuation are – in common<br />
with the realized gains and losses – recognized in net investment income.<br />
Derivative fi nancial instruments designated as hedging instruments pursuant to IAS 39 (Hedge<br />
Accounting) are to be carried at fair value upon initial measurement. The method used to recognize<br />
gains and losses upon subsequent valuation is dependent upon the type of hedged risk. The Group<br />
designates some derivatives as hedges on the fair value of particular assets (fair value hedges) and<br />
others as hedges against specifi c risks of fl uctuating cash fl ows associated with a liability recognized<br />
in the balance sheet or a transaction that is expected and highly likely to materialize in the future<br />
(cash fl ow hedges); further information is provided in item 12 of the Notes “Derivative fi nancial instruments<br />
and hedge accounting”, pages 207 et seqq. These hedging instruments are carried under<br />
other assets or other liabilities.
Notes Accounting policies<br />
Establishment of fair values: The fair value of a fi nancial instrument corresponds to the amount<br />
that the Group would receive or pay if it were to sell or settle the said fi nancial instrument on the<br />
balance sheet date. The fair value of securities is thus determined on the basis of current, publically<br />
available, unadjusted market prices. Insofar as market prices are listed on markets for fi nancial instruments,<br />
their bid price is used; fi nancial liabilities are measured at the asked price. In the case of<br />
securities for which no current market price is available, a valuation price is normally determined<br />
using models of fi nancial mathematics on the basis of current and observable market data. Such<br />
models are used principally for the measurement of unlisted securities.<br />
The Group uses various valuation models for this purpose, the details of which are provided in the<br />
following table:<br />
Financial instrument<br />
Fixed-income securities<br />
Pricing method Parameter Pricing model<br />
Unlisted plain vanilla bonds Theoretical<br />
price<br />
Interest rate curve Present-value method<br />
Unlisted structured bonds Theoretical Interest rate curve, volatility surfaces, Hull-White, Blackprice<br />
correlations<br />
Karasinski, LIBOR<br />
market model etc.<br />
Unlisted bond funds Theoretical Audited Net Asset Values (NAV) Net Asset Value<br />
price<br />
method<br />
ABS/MBS for which no market Theoretical Prepayment speed, incurred losses, Future cash fl ow<br />
prices are available<br />
price<br />
default probabilities, recovery rates method, liquidation<br />
method<br />
CDOs/CLOs, profi t<br />
Theoretical Risk premiums, default rates,<br />
Present-value method<br />
participation certifi cates<br />
Equities<br />
price<br />
recovery rates, redemptions<br />
Unlisted equities Theoretical Acquisition cost, cash fl ows, EBIT Net Asset Value<br />
Other invested assets<br />
price<br />
multiples, as applicable book value method<br />
Private equity Theoretical Acquisition cost, cash fl ows, EBIT Net Asset Value<br />
Derivative fi nancial<br />
instruments<br />
price<br />
multiples, market prices<br />
method<br />
Plain vanilla interest rate Theoretical Interest rate curve Present-value method<br />
swaps<br />
price<br />
Currency forwards Theoretical Interest-rate curves, spot and<br />
Interest parity model<br />
price<br />
forward rates<br />
OTC stock options,<br />
Theoretical Listing of the underlying share,<br />
Black-Scholes<br />
OTC stock index options price<br />
implicit volatilities, money-market<br />
interest rate, dividend yield<br />
Interest rate futures Theoretical<br />
price<br />
Infl ation swaps Theoretical<br />
price<br />
Insurance derivatives Theoretical<br />
price<br />
Interest rate curve Present-value method<br />
Infl ation swap rates (Consumer Price<br />
Index), historical index fi xings, interest<br />
rate curve<br />
Market values of the cat. bonds,<br />
interest rate curve<br />
Present-value method<br />
with seasonality<br />
adjustment<br />
Present-value method<br />
133
134 <strong>Talanx</strong> Group Financial report 2010<br />
We have allocated all fi nancial instruments measured at fair value to a level of the fair value hierarchy<br />
in accordance with IFRS 7. For further explanation please see our remarks in item 11 of the Notes<br />
“Fair value hierarchy”.<br />
The value determined on the basis of valuation models at time of acquisition can, however, diverge<br />
from the actual cost of acquisition. The resulting measurement diff erence constitutes a theoretical<br />
“day-one profi t/loss”. As at the balance sheet date this produced only an insignifi cant loss.<br />
Impairment: At each balance sheet date we review our fi nancial assets – with the exception of<br />
fi nancial assets at fair value through profi t or loss (since impairments are implicitly included in the<br />
fair value) – with an eye to objective, substantial indications of impairment. Permanent impairments<br />
on all these fi nancial assets are charged to the statement of income. IAS 39.59 contains a list<br />
of objective indications for impairment of a fi nancial asset. IAS 39.61 sets out additional requirements<br />
with regard to indications of objective evidence for the impairment of equity instruments,<br />
according to which impairment exists if there is a signifi cant or prolonged decrease in the fair value<br />
below acquisition cost. For the Group, this means that a decrease in the fair value of equity instruments<br />
is deemed to be signifi cant if it falls by more than 20% below acquisition cost; a prolonged<br />
decrease exists if the fair value falls consistently below cost for a period of at least nine months. In<br />
the case of securities denominated in foreign currencies, assessment is made in the functional currency<br />
of the entity holding the equity instrument. In principle, we take as a basis for fi xed-income<br />
securities the same indicators as for equity instruments. Qualitative case-by-case analysis is also<br />
carried out. Reference is made, fi rst and foremost, to the rating of the instrument, the rating of the<br />
issuer/borrower as well as the individual market assessment in order to establish whether impairment<br />
exists. What is more, when instruments measured at amortized cost are tested for impairment,<br />
we examine whether material items – looked at on their own – are impaired.<br />
Impairments are taken on the fair value as at the balance sheet date in the event of a prolonged<br />
decrease in value – if available, on the publically listed market price. In this context, impairments<br />
on investments are recognized directly on the assets side – without using an adjustment account –<br />
separately from the relevant items. Reversals on debt instruments are recognized in income up to<br />
the level of the amortized costs. In the case of fi nancial assets available for sale, any further amount<br />
is recognized directly in equity with no eff ect on income. Reversals on equity instruments are recognized<br />
in equity via the other income/expenses outside the statement of income.<br />
Securities loaned in the context of securities lending continue to be carried in the balance sheet<br />
since the material opportunities and risks resulting from such securities remain within the Group.<br />
Other invested assets are recognized for the most part at fair value. Insofar as these fi nancial assets<br />
are not listed on public markets (e.g. participating interests in private equity fi rms), they are carried<br />
at the latest available “net asset value” as an approximation of fair value. Loans included in this<br />
item are recognized at amortized cost.
Notes Accounting policies<br />
Funds held and contracts without suffi cient technical risk<br />
Funds held by ceding companies are receivables due under reinsurance provided to our clients in<br />
the amount of the cash deposits contractually withheld by such clients; funds held under reinsurance<br />
treaties (shown under liabilities) represent the cash deposits furnished to us by our retrocessionaires.<br />
Neither of these types of deposit triggers any cash fl ows and the funds cannot be used<br />
without the consent of the other party. Funds held by ceding companies/funds held under reinsurance<br />
treaties are recognized at acquisition cost (nominal amount). Appropriate allowance is made<br />
for credit risks.<br />
Insurance contracts that satisfy the test of a signifi cant risk transfer to the reinsurer as required by<br />
IFRS 4 but fail to meet the risk transfer required by US GAAP are recognized using the “deposit accounting”<br />
method and eliminated from the technical account. The compensation elements for risk<br />
assumption booked to income under these contracts are shown under other income/expenses. The<br />
balances are shown as contract deposits on the assets and liabilities sides of the balance sheet, the<br />
fair values of which correspond approximately to their book values.<br />
Investments for the account and risk of holders of life insurance policies<br />
This item consists of <strong>policy</strong>holders’ investments under unit-linked life insurance policies. The<br />
insurance benefi ts under these insurance contracts are linked to the unit prices of investment<br />
funds or a portfolio of separate fi nancial assets. The assets are kept and invested separately from<br />
other invested assets. They are recognized at fair value. The unrealized gains or losses are opposed<br />
by changes in the technical provisions. Policyholders are entitled to the profi ts generated;<br />
they are likewise liable for the incurred losses.<br />
Reinsurance recoverables on technical provisions<br />
The reinsurers’ portions of the technical provisions are calculated according to the contractual<br />
conditions of the underlying reinsurance treaties using a simplifi ed method; the reader is referred<br />
to the explanatory notes on the corresponding liabilities-side items. Appropriate allowance is made<br />
for credit risks.<br />
Deferred acquisition costs<br />
Acquisition costs which are closely connected with the closing of insurance contracts and variable<br />
in relation to the acquired new business are capitalized in accordance with US GAAP as deferred<br />
acquisition costs (FASB ASC 944). Deferred acquisition costs are regularly tested for impairment<br />
using an adequacy test. The actuarial bases are also subject to ongoing review and adjustment as<br />
necessary.<br />
In the case of property/casualty insurance companies and non-life reinsurance, acquisition costs<br />
are normally deferred pro rata for the unearned portion of the premiums. They are amortized at<br />
a constant rate over the average contract period. In the case of life insurers and in life/health reinsurance,<br />
the deferred acquisition costs are determined in light of the period of the contracts, the<br />
expected surrenders, the lapse expectancies and the anticipated interest income. The amount of<br />
amortization depends on the gross margins of the contracts calculated for the corresponding year<br />
of the contract period. Depending on the type of contract, amortization is taken either in proportion<br />
to the premium income or in proportion to the expected profi t margins.<br />
135
136 <strong>Talanx</strong> Group Financial report 2010<br />
In the case of life reinsurance treaties classifi ed as “universal life-type contracts”, the deferred acquisition<br />
costs are amortized on the basis of the expected profi t margins from the reinsurance treaties,<br />
making allowance for the period of the insurance contracts. A discount rate based on the interest<br />
rate for medium-term government bonds was applied to such contracts. In the case of annuity<br />
policies with a single premium payment, these values refer to the expected <strong>policy</strong> period or period<br />
of annuity payment.<br />
Deferred tax assets<br />
IAS 12 “Income Taxes” requires that assets-side deferred taxes be established if asset items are to be<br />
recognized in a lower amount or debit items in a higher amount in the consolidated balance sheet<br />
than in the tax balance sheet of the relevant Group company and if these diff erences will lead to reduced<br />
tax burdens in the future. In principle, such valuation diff erences may arise between the tax<br />
balance sheets drawn up in accordance with national standards and the IFRS balance sheets of the<br />
companies included in the consolidated fi nancial statement drawn up in accordance with uniform<br />
group standards. Deferred tax assets are also recognized for tax credits and on tax loss carry-forwards.<br />
The assessment as to whether deferred tax claims from tax loss carry-forwards can be used,<br />
i.e. are not impaired, is guided by the results planning of the company and concretely realizable tax<br />
strategies. Value adjustments are taken on impaired deferred tax assets.<br />
Insofar as deferred taxes refer to items carried directly in shareholders’ equity via the other income/expenses,<br />
the resulting deferred taxes are also recognized outside the statement of income.<br />
Deferred taxes are based on the current country-specifi c tax rates. In the event of a change in the<br />
tax rates on which the calculation of the deferred taxes is based, appropriate allowance is made in<br />
the year in which the change in the tax rate is adopted in law. Deferred taxes at the Group level are<br />
booked using the Group tax rate of 31.6%, unless they can be allocated to specifi c companies.<br />
Other assets<br />
Other assets are carried at amortized cost. Derivatives recognized as hedging instruments in the<br />
context of hedge accounting which show a positive fair value are carried at fair value. Property,<br />
plant and equipment are recognized at acquisition or manufacturing costs less straight-line depreciation.<br />
The useful life for own-use real estate is at most 50 years; the useful life for fi xtures and<br />
fi ttings is normally between 2 and 10 years. Impairment expenses are spread across the technical<br />
functional areas or recognized under other income/expenses.
Notes Accounting policies<br />
Disposal groups pursuant to IFRS 5<br />
Long-lived assets held for sale (or groups of assets and liabilities held for sale) are classifi ed as held<br />
for sale pursuant to IFRS 5 if their carrying amount is realized largely through sale rather than<br />
through continued operational use. Sale must be highly probable. The assets or disposal group held<br />
for sale are measured at the lower of carrying amount and fair value less costs to sell and recognized<br />
separately in the balance sheet as assets or liabilities. Scheduled depreciation is recognized<br />
until the date of classifi cation as held for sale. Impairment losses on fair value less costs to sell<br />
are recognized in profi t or loss; any subsequent increase in fair value less costs to sell leads to the<br />
realization of gains up to the amount of the cumulative impairment loss. If the impairment loss to<br />
be taken on a disposal group exceeds the carrying amount of the corresponding non-current assets,<br />
the need to establish a provision within the meaning of IAS 37 “Provisions, Contingent Liabilities<br />
and Contingent Assets” is examined. More detailed information on the non-current assets held for<br />
sale and disposal groups is contained in the subsection of the same name.<br />
Liabilities<br />
Shareholders’ equity<br />
The common shares, reserves (additional paid-in capital, retained earnings) and cumulative other<br />
comprehensive income are recognized in equity. The common shares and additional paid-in<br />
capital are comprised of the amounts paid in by the shareholder of <strong>Talanx</strong> AG on its shares. The<br />
retained earnings consist of profi ts generated and reinvested by Group companies and special<br />
investment funds since they have belonged to the Group as well as income and expenses from<br />
changes in the consolidated group. In addition, in the event of a retrospective change of accounting<br />
policies, the adjustment for previous periods not included in the fi nancial statement is recognized<br />
in the opening balance sheet value of the retained earnings and comparable items of the earliest<br />
reported period. Unrealized gains and losses from changes in the fair value of fi nancial assets held<br />
as available for sale are carried in cumulative other comprehensive income; translation diff erences<br />
resulting from the currency translation of foreign subsidiaries as well as unrealized gains/losses<br />
from the valuation of associated companies at equity are also recognized under the other reserves.<br />
In addition, write-ups on available-for-sale variable-yield securities are recognized under this item<br />
of shareholders’ equity. In the year under review various derivatives were used as hedging instruments<br />
in the context of cash fl ow hedges. The fl uctuations in value are recognized in a separate<br />
reserve item in equity.<br />
Minority interests are shown in the consolidated statement of income following the net income.<br />
Minority interests in shareholders’ equity are consequently recognized as a component of shareholders’<br />
equity. They refer to the shares held by companies outside the Group in the shareholders’<br />
equity of subsidiaries.<br />
Technical provisions (gross)<br />
The technical provisions are shown for gross account in the balance sheet, i.e. before deduction of<br />
the portion attributable to reinsurers; the reader is referred here to the explanatory notes on the<br />
corresponding asset items. The reinsurers’ portions of the technical provisions are calculated and<br />
recognized on the basis of the individual reinsurance treaties.<br />
137
138 <strong>Talanx</strong> Group Financial report 2010<br />
Unearned premiums correspond to already collected premiums that are apportionable to future<br />
risk periods. These premiums are normally deferred by specifi c dates for insurance contracts (predominantly<br />
in primary insurance); in reinsurance business global methods are sometimes used if<br />
the accounting data required from prior insurers for a calculation pro rata temporis is unavailable.<br />
Benefi t reserves are calculated and recognized in life insurance business using actuarial methods<br />
for commitments arising out of guaranteed claims of <strong>policy</strong>holders in life insurance and of ceding<br />
companies in life/health reinsurance. They are calculated as the diff erence between the present<br />
value of future expected payments to <strong>policy</strong>holders/cedants and the present value of future<br />
expected net premium still to be collected from <strong>policy</strong>holders/cedants. The calculation includes<br />
assumptions relating to mortality, morbidity, lapse rates and the future interest rate development.<br />
The actuarial bases used in this context allow an adequate safety margin for the risks of change,<br />
error and random fl uctuation.<br />
In the case of life insurance contracts without a surplus participation, the method draws on<br />
assumptions as to the best estimate of investment income, life expectancy and morbidity risk,<br />
allow ing for a risk margin. These assumptions are based on customer and industry data. In the case<br />
of life insurance contracts with a surplus participation, reference is made to assumptions that are<br />
contractually guaranteed or used to establish the surplus participation.<br />
Life insurance products must be divided into the following categories pursuant to FASB Accounting<br />
Standards Codifi cation (ASC) 944–40 for the measurement of the benefi t reserve:<br />
In the case of life insurance contracts with a “natural” surplus distribution (previously included in<br />
FAS 120 in conjunction with SOP 95-1 (Statement of Principles)), the benefi t reserve is composed of<br />
the net level premium reserve and a reserve for maturity bonuses. The net level premium reserve<br />
is arrived at from the present value of future insurance benefi ts (including earned bonuses, but<br />
excluding loss adjustment expenses) less the present value of the future premium reserve. The net<br />
level premium reserve is calculated as the net premium less the portion of premium earmarked to<br />
cover loss adjustment expenses. The reserve for maturity bonuses is generally constituted from a<br />
fi xed portion of the gross profi t generated in the fi nancial year from the insurance portfolio.<br />
For contracts in life insurance with no surplus distribution (previously included in FAS 60), the<br />
benefi t reserve is calculated as the diff erence between the present value of future benefi ts and the<br />
present value of the future net level premium reserve. The net level premium reserve corresponds<br />
to the portion of the gross premium used to fund future insurance benefi ts.<br />
In the case of primary life insurance contracts classifi ed according to the “universal life” model,<br />
unit-linked life insurances or similar life/health reinsurance treaties (previously included in FAS 97),<br />
a separate account is kept to which the premium payments less costs and plus interest are credited.<br />
We recognize the benefi t reserve in the area of life insurance insofar as the investment risk is borne<br />
by <strong>policy</strong>holders separately in liabilities item D.
Notes Accounting policies<br />
The loss and loss adjustment expense reserves are constituted for payment obligations from<br />
insurance claims that have occurred but have not yet been settled. They relate to payment obligations<br />
under insurance and reinsurance contracts in respect of which the amount of the insurance<br />
benefi t or the due date of payment is still uncertain. Insofar they are based on estimates that may<br />
vary from the actual payment. The loss and loss adjustment expense reserves are subdivided into<br />
reserves for claims reported by the balance sheet date and reserves for claims that have already<br />
been incurred but not yet reported (IBNR) by the balance sheet date.<br />
Reserves for claims reported by the balance sheet date are based on recognized actuarial methods<br />
used to estimate future claims expenditure including expenses associated with loss adjustment.<br />
They are recognized according to best estimate principles in the amount that will probably be utilized.<br />
In order to measure the “ultimate liability” the expected ultimate loss ratios are calculated for<br />
all lines of non-life reinsurance with the aid of actuarial methods such as the chain ladder method.<br />
The development of a claim until completion of the run-off is projected on the basis of statistical<br />
triangles. In this context it is assumed that the future rate of infl ation of the loss run-off will be<br />
analogous to the average rate of the past infl ation contained in the data. The more recent underwriting<br />
years in actuarial projections are subject to greater uncertainty, although this is reduced<br />
with the aid of a variety of additional information. Particularly in reinsurance business, a considerable<br />
period of time may elapse between the occurrence of an insured loss, notifi cation by the<br />
insurer and pro-rata payment of the loss by the reinsurer. The realistically estimated future settlement<br />
amount (“best estimate”), calculated in principle on the basis of the information provided<br />
by ceding companies, is therefore brought to account. This estimate draws on past experience and<br />
assumptions as to the future development, taking account of market information. The amount of<br />
the reserves and their allocation to occurrence years are determined using established forecasting<br />
methods of non-life actuarial science.<br />
Reserves for claims that have occurred but not yet been notifi ed by the balance sheet date are constituted<br />
in the same way as reserves for claims that have already occurred. The Group draws here<br />
on empirical values adjusted according to current trends and other relevant factors. These reserves<br />
are constituted using actuarial and statistical models of the expected costs for fi nal settlement and<br />
handling of claims. The analyses are based upon currently known facts and circumstances, projections<br />
of future events, estimates of the future infl ationary trend as well as other social and economic<br />
factors. The latest trends observed in claim notifi cations, the extent of losses and increases<br />
in risk are also considered.<br />
Suffi cient statistical data is not available for major losses. In these instances appropriate reserves<br />
are established aft er analysis of the portfolio exposed to such risks and, as appropriate, aft er individual<br />
scrutiny. These reserves represent the best estimates of the Group.<br />
With the exception of a few reserves, the loss and loss adjustment expense reserves are not discounted.<br />
139
140 <strong>Talanx</strong> Group Financial report 2010<br />
The provision for premium refunds is constituted in life insurance for obligations regarding the<br />
surplus participation of <strong>policy</strong>holders that have not yet been defi nitively allocated to individual<br />
insurance contracts on the balance sheet date. It consists of amounts allocated to <strong>policy</strong>holders in<br />
accordance with national regulations or contractual provisions and amounts resulting from temporary<br />
diff erences between the IFRS consolidated fi nancial statement and the local annual fi nancial<br />
statements (provision for deferred premium refunds, shadow provision for premium refunds) that<br />
will have a bearing on future calculations of the surplus distribution.<br />
We regularly subject all technical provisions to an adequacy test in accordance with IFRS 4. If current<br />
experience indicates that future income will not cover the expected expenses, the technical<br />
provisions are adjusted in income or an additional provision for anticipated losses is established<br />
aft er writing off the deferred acquisition costs. We review the adequacy of the benefi t reserve on the<br />
basis of current assumptions as to the actuarial bases.<br />
Shadow Accounting<br />
IFRS 4.30 allows unrealized, but recognized profi ts and losses (these derive predominantly from<br />
changes in the fair value of assets classifi ed as “available for sale”) reported in equity (Other Comprehensive<br />
Income, OCI) to be included in the measurement of technical items. This may aff ect the<br />
following items: deferred acquisition costs, present values of future profi ts (PVFPs), provisions for<br />
maturity bonuses of <strong>policy</strong>holders, provisions for deferred costs and the provision for premium<br />
refunds. The aforementioned assets and liabilities items and their corresponding amortization<br />
schemes are determined on the basis of the estimated gross margins (EGMs). The latter are modifi<br />
ed accordingly following subsequent recognition of unrealized gains and losses. The resulting<br />
adjustments are carried as so-called “shadow adjustments” to the aff ected items. The contra item in<br />
equity (OCI) is reported analogously to the underlying changes in value.<br />
Technical provisions in the area of life insurance insofar as the<br />
investment risk is borne by <strong>policy</strong>holders<br />
In the case of life insurance products under which <strong>policy</strong>holders carry the investment risk themselves<br />
(e.g. in unit-linked life insurance), the benefi t reserves and other technical provisions refl ect<br />
the fair value of the corresponding investments; these provisions are recognized separately. We<br />
would refer the reader to the explanatory notes on the assets-side item “Investments for the account<br />
and risk of holders of life insurance policies”, page 135.<br />
Other provisions<br />
This item includes inter alia the provisions for pensions and other post-employment benefi t obligations.<br />
The Group companies normally grant their employees pension commitments based on<br />
defi ned contributions or defi ned benefi ts. The type and amount of the commitments depends on<br />
the pension plans in force at the time when the commitment was given. They are based principally<br />
on an employee’s length of service and salary level.
Notes Accounting policies<br />
In addition, since the mid-1990s various German companies have off ered the opportunity to obtain<br />
pension commitments through deferred compensation. The employee-funded commitments<br />
included in the provisions for accrued pension rights are protected by insurance contracts with<br />
HDI-Gerling Lebensversicherung AG, Cologne, and Neue Leben Lebensversicherung AG, Hamburg.<br />
Furthermore, Group employees have the opportunity to accumulate additional old-age provision<br />
by way of deferred compensation through contributions to special insurance companies known as<br />
“Pensionskassen”. The benefi ts are guaranteed for their members and surviving dependants and<br />
comprise traditional pension plans with bonus increases as well as unit-linked hybrid annuities. In<br />
addition to these pension plans, executive staff and Board members, in particular, enjoy individual<br />
commitments as well as commitments given under the benefi ts plan of the Bochumer Verband. Additional<br />
similar obligations based upon length of service exist at some Group companies.<br />
In the case of pensions commitments based on defi ned contributions the companies pay a fi xed<br />
amount to an insurer or pension fund. The commitment given by the company is fi nally discharged<br />
upon payment of the contribution. Under pension commitments based on defi ned benefi<br />
ts the employee receives a specifi c pension commitment from the company or a pension fund.<br />
The contributions payable by the company to fund the commitment are not fi xed in advance.<br />
If the pension commitments are balanced against assets of a legally independent entity (e.g. a fund)<br />
that may be used solely to cover the pension assurances given and cannot be seized by any creditors,<br />
the pension commitments are to be recognized less the assets.<br />
Pension commitments under defi ned benefi t plans are measured in accordance with IAS 19<br />
“Employee Benefi ts” using the projected unit credit method. Not only are the benefi t entitlements<br />
and current annuities existing as at the balance sheet date measured, but allowance is also made<br />
for their future development. The interest rate used for discounting the pension commitments is<br />
based upon the rates applicable to fi rst-rate fi xed-income corporate bonds in accordance with the<br />
currency and duration of the pension commitments.<br />
The amounts payable under defi ned contribution plans are expensed when they become due.<br />
Actuarial gains or losses from pension commitments and plan assets derive from divergences<br />
between the estimated risk experience and the actual risk experience (irregularities in the risk<br />
experience, eff ects of changes in the calculation parameters and unexpected gains or losses on plan<br />
assets). The Group uses the “corridor method” defi ned in IAS 19 to recognize its actuarial gains and<br />
losses. Under the corridor method, a portion of the actuarial gains and losses is recognized in profi t<br />
or loss to the extent that the hitherto unrecognized actuarial gains or losses at the beginning of the<br />
fi nancial year exceed the higher of the following amounts: 10% of the present value of the earned<br />
pension entitlements or 10% of the fair value of any plan assets. The amount outside the corridor<br />
– divided by the expected average remaining working lives of the benefi ciaries – is included as<br />
income or expense in the statement of income.<br />
141
142 <strong>Talanx</strong> Group Financial report 2010<br />
Sundry provisions are established on the basis of best estimates in the amount that is likely to<br />
be used. The provisions are discounted if the interest rate eff ect is of material signifi cance. The<br />
carrying amount of the provisions is reviewed as at each balance sheet date. Provisions in foreign<br />
currencies are translated at the exchange rate on the balance sheet date.<br />
Liabilities and subordinated liabilities<br />
Financial liabilities including subordinated liabilities, insofar as they do not involve funds held<br />
under reinsurance treaties or liabilities from derivatives, are reported at amortized costs. Subordinated<br />
liabilities are fi nancial obligations that can only be satisfi ed aft er the claims of other creditors<br />
in the event of liquidation or bankruptcy. Funds held under reinsurance treaties are measured at<br />
nominal value and liabilities from derivatives are recognized at fair value (on the valuation models<br />
used within the Group to establish fair values see the subsection “Investments including income<br />
and expenses”). In addition, derivatives used as hedging instruments in the context of hedge accounting<br />
are shown under the “Other liabilities”; further explanatory information in this regard is<br />
provided in item 12 of the Notes “Derivative fi nancial instruments and hedge accounting” (pages<br />
207 et seqq.).<br />
Deferred tax liabilities<br />
Deferred tax liabilities must be recognized in accordance with IAS 12 “Income Taxes” if assets are<br />
to be recognized in a higher amount or liabilities in a lower amount in the consolidated balance<br />
sheet than in the tax balance sheet of the group company in question and if this – as a temporary<br />
diff erence – will lead to additional tax loads in the future; cf. the explanatory notes on deferred tax<br />
assets.<br />
Currency translation<br />
Items in the fi nancial statements of Group companies are measured on the basis of the currency<br />
corresponding to the currency of the primary economic environment in which the company operates<br />
(functional currency). The consolidated fi nancial statement is prepared in the euro, which<br />
constitutes the functional currency and the reporting currency of <strong>Talanx</strong> AG.<br />
Transactions in foreign currencies are converted into the functional currency using the exchange<br />
rates on the transaction date. In accordance with IAS 21 “The Eff ects of Changes in Foreign Exchange<br />
Rates” the recognition of exchange gains and losses on translation is guided by the nature of the<br />
underlying balance sheet item.<br />
Gains and losses from the translation of monetary assets and liabilities existing in foreign currencies<br />
are recognized in the statement of income under other income/expenses.<br />
Currency translation diff erences relating to non-monetary assets, changes in the fair values of<br />
which are carried in income, are recognized with the latter in income as profi t or loss from fair<br />
value measurement changes. Exchange gains or losses from non-monetary items – such as equity<br />
securities – classifi ed as available for sale are initially recognized outside income in a separate item<br />
of shareholders’ equity and only booked to income when such non-monetary items are settled.
Notes Accounting policies<br />
The Group companies’ statements of income prepared in the national currencies are converted<br />
into euro at the average rates of exchange and transferred to the consolidated fi nancial statement.<br />
The conversion of foreign currency items in the balance sheets of the individual companies and<br />
the transfer of these items to the consolidated fi nancial statement are eff ected at the mean rates<br />
of exchange on the balance sheet date. All resulting currency translation diff erences – including<br />
those arising out of the capital consolidation – are recognized as a separate item within the other<br />
reserves in shareholders’ equity. Goodwill is treated as an asset of the foreign entity and translated<br />
accordingly.<br />
The exchange rates for the Group’s key foreign currencies are as follows:<br />
Balance sheet<br />
(balance sheet date)<br />
Statement of income<br />
(average)<br />
Currency/country<br />
1 EUR corresponds to:<br />
31.12.2010 31.12.2009 2010 2009<br />
AUD Australia 1.3068 1.6048 1.4510 1.7839<br />
BHD Bahrain 0.4997 0.5404 0.5009 0.5267<br />
BRL Brazil 2.2085 2.4963 2.3384 2.8024<br />
CAD Canada 1.3259 1.5048 1.3758 1.5916<br />
CLP Chile 619.9699 727.1109 677.6252 781.1374<br />
CNY China 8.7511 9.7847 8.9895 9.5419<br />
GBP United Kingdom 0.8585 0.9042 0.8592 0.8966<br />
HKD Hong Kong 10.3146 11.1172 10.3232 10.8274<br />
HUF Hungary 280.1572 272.2169 276.2410 280.0399<br />
KRW South Korea 1501.6346 1669.5842 1541.5994 1771.3279<br />
MXN Mexico 16.4031 18.6562 16.8429 18.9262<br />
MYR Malaysia 4.0869 4.9113 4.2915 4.9076<br />
PLN Poland 3.9678 4.1269 4.0114 4.3358<br />
SEK Sweden 9.0119 10.2986 9.5582 10.6210<br />
UAH Ukraine 10.5603 11.4827 10.5571 11.1792<br />
USD United States 1.3254 1.4336 1.3287 1.3969<br />
ZAR South Africa 8.7907 10.6121 9.7204 11.6273<br />
143
144 <strong>Talanx</strong> Group Financial report 2010<br />
Segment reporting<br />
The Group adjusted its segment reporting in the year under review in light of the corporate reorganization<br />
according to customer groups that was undertaken in primary insurance business (see our<br />
remarks on “Change in segment reporting” in the section “Accounting policies” page 121).<br />
Identifi cation of reportable segments<br />
The reportable segments were determined according to the internal reporting and management<br />
structure of the Group, on the basis of which the Group Board of Management regularly assesses<br />
the performance of the segments and decides on the allocation of resources to the segments. As a<br />
fi rst step, the Group split its business activities into the areas of insurance and corporate operations.<br />
The insurance business was then subdivided – to some extent along new lines – into fi ve<br />
reportable segments; in view of the diff erent product types, risks and capital allocations, a diff erentiation<br />
is initially made between primary insurance and reinsurance.<br />
Refl ecting its diff erent products and business groups, reinsurance business continues to be split<br />
into the two segments of Non-Life Reinsurance and Life/Health Reinsurance. On account of their<br />
management according to customer groups and geographical regions (domestic versus international)<br />
– which therefore spans the various lines of business –, insurance activities in the primary<br />
sector have been restructured/presented in accordance with the following three reportable segments:<br />
“Industrial Lines”, “Retail Germany” and “Retail International”; this replaces the previous<br />
two-way split by line of business into Property/Casualty Primary Insurance and Life Primary Insurance.<br />
The revised segmentation in primary insurance thus corresponds to the responsibilities of<br />
the members of the Board of Management.<br />
The area of “Corporate Operations” constitutes another reportable segment. Altogether, then, the<br />
Group has identifi ed six reportable segments in conformity with IFRS 8 “Operating Segments”. The<br />
fi gures for the previous year have been adjusted accordingly.<br />
The major products and services with which these reportable segments generate income are set out<br />
below. In addition, the main restructuring measures in the three primary insurance segments are<br />
discussed.<br />
Industrial Lines: In the Industrial Lines segment we are for the fi rst time reporting worldwide<br />
industrial business as an independent segment; it was previously part of the Property/Casualty<br />
Primary Insurance segment. The scope of business operations encompasses a wide selection of<br />
insurance products such as liability, motor, accident, fi re, marine, special lines and engineering<br />
insurance for large and mid-sized enterprises in Germany and abroad. In addition, reinsurance in<br />
various classes of insurance is granted.
Notes Segment reporting<br />
Retail Germany: Insurance activities serving German retail and commercial customers that span<br />
the various lines of business, including the bancassurance business transacted Germany-wide – i.e.<br />
insurance products sold over the counter at banks –, are managed in this reportable segment (previously<br />
included in the segments of Property/Casualty Primary Insurance and Life Primary Insurance).<br />
In addition to traditional composite insurance products, numerous life insurance products<br />
are off ered in the form of individual, group and collective policies for a single or regular premium:<br />
endowment, annuity and term life insurance, accident insurance, unit-linked life insurance, occupational<br />
disability and strict “any occupation” disability insurance, foreign travel insurance and<br />
occupational retirement provision.<br />
Retail International: The scope of operations in this new segment encompasses insurance business<br />
transacted across the various lines of insurance with retail and commercial customers, including<br />
bancassurance activities in foreign markets. The broad selection of insurance products largely<br />
refl ects those off ered in the Retail Germany segment.<br />
Non-Life Reinsurance: The most important activities concentrate on property and casualty business<br />
with retail, commercial and industrial customers – fi rst and foremost in the US and German<br />
markets –, marine and aviation business, credit/surety business, facultative business and catastrophe<br />
business.<br />
Life/Health Reinsurance: The segment consists of the international activities of the Hannover Re<br />
Group in the life, health, annuity and accident lines.<br />
Corporate Operations: The Corporate Operations segment encompasses – in contrast to the fi ve<br />
operating segments – management and other functional activities in support of the business conducted<br />
by the Group, primarily relating to asset management, administration, run-off and placement<br />
of portions of reinsurance cessions, Group fi nancing and other service tasks. Certain service<br />
companies previously allocated to the primary insurance segments are included in this segment<br />
from 2010 onwards.<br />
Measurement bases for the performance of the reportable segments<br />
All transactions between reportable segments are measured on the basis of standard market transfer<br />
prices that would also be applicable to transactions at arm’s length. Such intra-group transactions<br />
between segments are eliminated within the scope of consolidation – in the consolidation<br />
column, insofar as they are cross-segment transactions. For reasons of consistency and comparability,<br />
we have adjusted the consolidated statement of income in line with the segment statement<br />
of income; the same applies to the consolidated balance sheet and the segment balance sheet.<br />
Non-current assets are considered largely to consist of intangible assets and own-use real estate/<br />
investment property.<br />
Depending upon the nature and timeframe of the commercial activities, various management<br />
ratios and performance indicators are used to assess the fi nancial success of the reportable segments<br />
within the Group; the operating profi t (EBIT) – determined from IFRS profi t contributions –<br />
is, however, used as a consistent measurement basis. The net profi t or loss for the period before<br />
income taxes is highlighted as a means of capturing true operating profi tability and for the sake of<br />
better comparability. In addition, the result is adjusted for interest charges incurred for borrowing<br />
(fi nancing costs).<br />
145
146 <strong>Talanx</strong> Group Financial report 2010<br />
Segment report.<br />
Balance sheet as at 31 December 2010 1)<br />
Industrial Lines Retail Germany Retail International<br />
Assets 31.12.2010 31.12.2009 2) 31.12.2010 31.12.2009 2) Figures in EUR million<br />
A. Intangible assets<br />
31.12.2010 31.12.2009<br />
a. Goodwill 60 60 397 397 124 128<br />
b. Other intangible assets 8 8 1,629 1,943 29 25<br />
68 68 2,026 2,340 153 153<br />
B. Investments<br />
a. Investment property<br />
b. Investments in affi liated companies and<br />
39 41 449 451 69 64<br />
participating interests 9 8 24 15 — —<br />
c. Investments in associated companies — — 9 9 24 25<br />
d. Loans and receivables<br />
e. Other fi nancial instruments<br />
3,084 3,000 26,993 26,155 3 3<br />
i. Held to maturity 121 121 295 297 71 51<br />
ii. Available for sale 2,764 2,355 8,599 7,700 2,444 2,220<br />
iii. At fair value through profi t or loss 16 20 445 508 487 269<br />
f. Other invested assets 559 870 849 991 224 219<br />
Investments under own management 6,592 6,415 37,663 36,126 3,322 2,851<br />
g. Funds held by ceding companies 43 42 3 66 — —<br />
Total investments 6,635 6,457 37,666 36,192 3,322 2,851<br />
C. Investments for the account and risk of holders<br />
of life insurance policies — — 5,419 4,203 995 772<br />
D. Reinsurance recoverables on technical provisions 3,866 3,947 2,797 2,659 713 699<br />
E. Accounts receivable on insurance business 1,675 1,002 368 407 354 287<br />
F. Deferred acquisition costs 26 8 1,498 1,377 202 198<br />
G. Cash 242 297 337 676 204 209<br />
H. Deferred tax assets 25 36 22 30 59 51<br />
I. Other assets 448 419 1,412 1,024 211 172<br />
J. Non-current assets and assets of disposal groups<br />
classifi ed as held for sale — — — 35 — —<br />
Total assets 12,985 12,234 51,545 48,943 6,213 5,392<br />
1) Previous year’s fi gures adjusted due to modifi ed segment reporting pursuant to IFRS 8<br />
2) Adjusted on the basis of IAS 8
Notes Segment reporting<br />
Non-Life Reinsurance Life/Health Reinsurance Corporate Operations Consolidation Total<br />
31.12.2010 31.12.2009 2) 31.12.2010 31.12.2009 2) 31.12.2010 31.12.2009 31.12.2010 31.12.2009 31.12.2010 31.12.2009 2)<br />
8 8 — — — — — — 589 593<br />
29 45 108 112 48 21 — — 1,851 2,154<br />
37 53 108 112 48 21 — — 2,440 2,747<br />
301 161 2 2 — 7 — — 860 726<br />
11 4 — 1 30 33 — — 74 61<br />
85 84 12 14 14 2 — — 144 134<br />
2,270 2,657 45 45 1 1 –53 –313 32,343 31,548<br />
3,024 2,949 4 4 46 — –562 –564 2,999 2,858<br />
12,096 10,227 4,409 3,653 323 322 — — 30,635 26,477<br />
181 208 92 94 — — — — 1,221 1,099<br />
2,352 1,779 273 267 413 417 –485 –410 4,185 4,133<br />
20,320 18,069 4,837 4,080 827 782 –1,100 –1,287 72,461 67,036<br />
696 626 11,940 10,163 — — –1,721 –1,548 10,961 9,349<br />
21,016 18,695 16,777 14,243 827 782 –2,821 –2,835 83,422 76,385<br />
— — — — — — — — 6,414 4,975<br />
941 1,633 515 265 — — –3,309 –3,241 5,523 5,962<br />
1,806 1,897 1,036 975 — — –228 –226 5,011 4,342<br />
362 331 1,472 1,507 — — 155 123 3,715 3,544<br />
328 257 118 200 36 46 — — 1,265 1,685<br />
10 15 2 7 181 96 –31 — 268 235<br />
970 1,085 47 54 474 673 –1,781 –1,772 1,781 1,655<br />
1,529 — — — — — — — 1,529 35<br />
26,999 23,966 20,075 17,363 1,566 1,618 –8,015 –7,951 111,368 101,565<br />
147
148 <strong>Talanx</strong> Group Financial report 2010<br />
Segment report.<br />
Balance sheet as at 31 December 2010 1)<br />
Industrial Lines Retail Germany Retail International<br />
Liabilities 31.12.2010 31.12.2009 2) 31.12.2010 31.12.2009 2) Figures in EUR million<br />
31.12.2010 31.12.2009<br />
B. Subordinated liabilities 265 269 165 155 — —<br />
C. Technical provisions<br />
a. Unearned premium reserve 713 726 1,835 1,882 1,008 960<br />
b. Benefi t reserve — — 32,333 30,919 1,752 1,527<br />
c. Loss and loss adjustment expense reserve 7,777 7,428 2,696 2,773 1,129 936<br />
d. Provision for premium refunds 13 12 1,061 1,202 39 61<br />
e. Other technical provisions 31 42 8 8 15 9<br />
8,534 8,208 37,933 36,784 3,943 3,493<br />
D. Technical provisions in the area of life insurance insofar<br />
as the investment risk is borne by <strong>policy</strong>holders — — 5,419 4,203 995 772<br />
E. Other provisions<br />
a. Provision for pensions 438 434 133 130 8 8<br />
b. Provision for taxes 117 143 142 178 40 27<br />
c. Sundry provisions 92 137 283 239 33 23<br />
647 714 558 547 81 58<br />
F. Liabilities<br />
a. Notes payable and loans — — — — 17 17<br />
b. Funds held under reinsurance treaties 4 15 2,224 2,050 345 267<br />
c. Other liabilities 1,835 1,343 2,321 2,654 298 222<br />
1,839 1,358 4,545 4,704 660 506<br />
G. Deferred tax liabilities 88 142 290 311 9 5<br />
Total liabilities/provisions 11,373 10,691 48,910 46,704 5,688 4,834<br />
H. Liabilities of disposal groups classifi ed as held for sale — — — — — —
Notes Segment reporting<br />
Non-Life Reinsurance Life/Health Reinsurance Corporate Operations Consolidation Total<br />
31.12.2010 31.12.2009 2) 31.12.2010 31.12.2009 2) 31.12.2010 31.12.2009 31.12.2010 31.12.2009 31.12.2010 31.12.2009 2)<br />
1,869 1,365 92 35 542 264 –142 –85 2,791 2,003<br />
1,813 1,438 98 75 — — –56 –55 5,411 5,026<br />
— — 8,941 7,954 — — –560 –646 42,466 39,754<br />
15,634 15,395 2,431 2,032 — 6 –1,129 –1,314 28,538 27,256<br />
— — — — — — — — 1,113 1,274<br />
131 106 51 40 — — 14 16 250 221<br />
17,578 16,939 11,521 10,101 — 6 –1,731 –2,000 77,778 73,531<br />
— — — — — — — — 6,414 4,975<br />
64 60 18 17 655 649 — — 1,316 1,298<br />
263 264 24 7 157 152 — — 743 771<br />
135 57 23 14 128 106 –2 –1 692 575<br />
462 381 65 38 940 907 –2 –1 2,751 2,644<br />
188 116 168 50 1,304 1,383 –930 –891 747 675<br />
320 331 5,572 4,564 — — –3,241 –2,713 5,224 4,514<br />
620 829 1,139 1,297 757 580 –2,112 –2,364 4,858 4,561<br />
1,128 1,276 6,879 5,911 2,061 1,963 –6,283 –5,968 10,829 9,750<br />
716 715 310 297 4 7 16 32 1,433 1,509<br />
21,753 20,676 18,867 16,382 3,547 3,147 –8,142 –8,022 101,996 94,412<br />
1,381 — — — — — — — 1,381 —<br />
Shareholders’ equity 3) 7,991 7,153<br />
Total liabilities 111,368 101,565<br />
1) Previous year’s fi gures adjusted due to modifi ed segment<br />
reporting pursuant to IFRS 8<br />
2) Adjusted on the basis of IAS 8<br />
3) Group shareholder’s equity incl. minority interests<br />
149
150 <strong>Talanx</strong> Group Financial report 2010<br />
Segment report.<br />
Statement of income for the 2010 fi nancial year 1)<br />
Industrial Lines Retail Germany Retail International<br />
2010 2009 2) 2010 2009 2) 2010 2009<br />
Figures in EUR million<br />
1. Gross written premium including premium from<br />
unit-linked life and annuity insurance 3,076 3,077 6,823 6,614 2,233 1,827<br />
thereof: with other segments 28 15 21 18 — —<br />
with third parties<br />
2. Savings elements of premium from unit-linked<br />
3,048 3,062 6,802 6,596 2,233 1,827<br />
life and annuity insurance — — 932 835 207 144<br />
3. Ceded written premium 1,658 1,732 437 625 203 242<br />
4. Change in gross unearned premium 37 19 45 167 19 –32<br />
5. Change in ceded unearned premium 42 –41 –8 163 100 6<br />
Net premium earned 1,413 1,405 5,507 5,158 1,742 1,403<br />
6. Claims and claims expenses (gross) 2,047 1,777 6,018 5,233 1,527 1,245<br />
Reinsurers’ share 878 909 192 302 113 117<br />
Claims and claims expenses (net) 1,169 868 5,826 4,931 1,414 1,128<br />
7. Acquisition costs and administrative expenses (gross) 568 622 1,282 1,594 657 477<br />
Reinsurers’ share 256 315 172 508 210 129<br />
Acquisition costs and administrative expenses (net) 312 307 1,110 1,086 447 348<br />
8. Other technical income 10 9 28 11 17 8<br />
Other technical expenses –1 105 230 97 34 34<br />
thereof: amortization PVFP — — 147 75 1 1<br />
Other technical result 11 –96 –202 –86 –17 –26<br />
Net technical result –57 134 –1,631 –945 –136 –99<br />
9. a. Income from investments 268 311 1,793 1,756 174 146<br />
b. Expenses for investments 37 70 181 513 22 25<br />
Net income from investments under own management 231 241 1,612 1,243 152 121<br />
Income/expense on funds withheld and contract deposits — –1 –35 –36 –1 —<br />
Net investment income 231 240 1,577 1,207 151 121<br />
thereof: interest and similar income 223 224 1,485 1,380 119 117<br />
impairments/depreciation on investments 7 12 68 193 8 14<br />
write-ups on investments<br />
profi t/loss from investments in associated<br />
— 1 10 — — —<br />
companies — — 1 — –1 —<br />
10. a. Other non-technical income 197 220 397 376 142 43<br />
b. Other non-technical expenses 186 259 387 357 113 92<br />
Other income/expenses 11 –39 10 19 29 –49<br />
thereof: interest and similar income<br />
write-ups on accounts receivable<br />
4 8 8 7 23 13<br />
and other assets 26 6 11 1 — 1<br />
interest and similar expanses<br />
write-downs on accounts receivable<br />
31 30 23 24 16 5<br />
and other assets 7 45 24 32 14 16<br />
amortization on acquired insurance portfolios — 67 — 31 — —<br />
Profi t before goodwill impairments 185 335 –44 281 44 –27<br />
11. Goodwill impairments — 1 — 72 17 15<br />
Operating profi t/loss (EBIT) 185 334 –44 209 27 –42<br />
12. Financing costs 14 18 11 22 — 1<br />
13. Taxes on income 32 79 –12 129 44 –2<br />
Net income 139 237 –43 58 –17 –41<br />
1) Previous year’s fi gures adjusted due to modifi ed segment reporting pursuant to IFRS 8<br />
2) Adjusted on the basis of IAS 8
Notes Segment reporting<br />
Non-Life Reinsurance Life/Health Reinsurance Corporate Operations Consolidation Total<br />
2010 2009 2010 2009 2) 2010 2009 2010 2009 2010 2009 2)<br />
6,340 5,753 5,090 4,529 — — –693 –877 22,869 20,923<br />
367 472 277 372 — — –693 –877 — —<br />
5,973 5,281 4,813 4,157 — — — — 22,869 20,923<br />
— — — — — — — — 1,139 979<br />
705 339 423 421 — — –659 –829 2,767 2,530<br />
–274 –199 –13 –27 — — 1 5 –185 –67<br />
–34 –22 — 3 — — –75 –85 25 24<br />
5,395 5,237 4,654 4,078 — — 42 42 18,753 17,323<br />
4,330 3,786 4,106 3,538 — — –218 –478 17,810 15,101<br />
456 –22 317 231 — — –244 –494 1,712 1,043<br />
3,874 3,808 3,789 3,307 — — 26 16 16,098 14,058<br />
1,525 1,323 1,216 1,112 — — –361 –374 4,887 4,754<br />
92 37 98 116 — — –313 –395 515 710<br />
1,433 1,286 1,118 996 — — –48 21 4,372 4,044<br />
— 4 17 11 — — –1 — 71 43<br />
10 11 54 44 — — 63 4 390 295<br />
— — 4 3 — — — — 152 79<br />
–10 –7 –37 –33 — — –64 –4 –319 –252<br />
78 136 –290 –258 — — — 1 –2,036 –1,031<br />
946 839 246 309 13 30 –57 –70 3,383 3,321<br />
179 266 42 24 110 86 –85 –81 486 903<br />
767 573 204 285 –97 –56 28 11 2,897 2,418<br />
12 37 304 240 — — — 1 280 240<br />
779 610 508 525 –97 –56 28 12 3,177 2,658<br />
672 682 606 571 3 7 –67 –76 3,041 2,905<br />
23 136 1 1 9 5 —1 –8 115 353<br />
27 20 — — — — — — 37 21<br />
2 –5 1 — — –1 — — 2 –6<br />
332 211 95 180 606 664 –822 –727 947 967<br />
280 197 37 76 824 630 –788 –606 1,039 1,005<br />
52 14 58 104 –218 34 –34 –121 –92 –38<br />
6 1 1 1 14 20 –12 –14 44 36<br />
61 99 — — — — — — 98 107<br />
32 47 10 5 65 60 –19 –18 158 153<br />
48 50 11 7 6 3 — — 110 153<br />
— — — — — — — — — 98<br />
909 760 276 371 –315 –22 –6 –108 1,049 1,589<br />
— — — — — 4 — — 17 92<br />
909 760 276 371 –315 –26 –6 –108 1,032 1,497<br />
90 79 4 2 65 72 –50 –61 134 133<br />
196 217 61 71 –108 –31 15 8 228 471<br />
623 464 211 298 –272 –67 29 –55 670 893<br />
thereof minority interest in profi t or loss 450 408<br />
thereof Group net income 220 485<br />
151
152 <strong>Talanx</strong> Group Financial report 2010<br />
The geographical breakdown shown below is based on the regional origin of the investments and<br />
the gross written premium with respect to external clients. No transactions with external clients<br />
amounting to at least 10% of total gross premium occurred during the reporting period.<br />
Investments excluding<br />
funds held by ceding<br />
companies 1) Figures in EUR million<br />
Primary Insurance Reinsurance<br />
Corporate<br />
Operations<br />
31.12.2010<br />
Total<br />
Germany 30,795 6,064 465 37,324<br />
United Kingdom 1,371 1,705 46 3,122<br />
Rest of Europe 12,842 6,993 316 20,151<br />
United States 839 6,052 — 6,891<br />
Rest of North America 103 987 — 1,090<br />
Asia and Australia 240 2,121 — 2,361<br />
Rest of the world 756 766 — 1,522<br />
Total 46,946 24,688 827 72,461<br />
Investments excluding<br />
funds held by ceding<br />
companies 1) Figures in EUR million<br />
Primary Insurance Reinsurance<br />
Corporate<br />
Operations<br />
31.12.2009<br />
Total<br />
Germany 32,178 5,996 222 38,396<br />
United Kingdom 682 1,338 211 2,231<br />
Rest of Europe 10,218 5,790 313 16,321<br />
United States 837 5,852 3 6,692<br />
Rest of North America 82 803 — 885<br />
Asia and Australia 178 1,349 — 1,527<br />
Rest of the world 537 447 — 984<br />
Total 44,712 21,575 749 67,036<br />
1) Aft er elimination of internal transactions within the Group across segments
Notes Segment reporting<br />
Gross written premium 1) Figures in EUR million<br />
Primary Insurance Reinsurance<br />
2010<br />
Total<br />
Germany 8,281 691 8,972<br />
United Kingdom 182 2,434 2,616<br />
Rest of Europe 2,642 1,675 4,317<br />
United States 145 2,957 3,102<br />
Rest of North America — 416 416<br />
Asia and Australia 47 1,452 1,499<br />
Rest of the world 786 1,161 1,947<br />
Total 12,083 10,786 22,869<br />
Gross written premium 1) Figures in EUR million<br />
Primary Insurance Reinsurance<br />
2009<br />
Total<br />
Germany 8,095 696 8,791<br />
United Kingdom 190 1,808 1,998<br />
Rest of Europe 2,538 1,561 4,099<br />
United States 112 2,841 2,953<br />
Rest of North America 1 386 387<br />
Asia and Australia 32 1,218 1,250<br />
Rest of the world 517 928 1,445<br />
Total 11,485 9,438 20,923<br />
1) Aft er elimination of internal transactions within the Group across segments<br />
153
154 <strong>Talanx</strong> Group Financial report 2010<br />
Consolidation<br />
Consolidation principles<br />
The consolidated fi nancial statement was drawn up in accordance with uniform Group accounting<br />
policies. The annual fi nancial statements included in the consolidated fi nancial statement were<br />
for the most part prepared as at 31 December. Compilation of interim fi nancial statements for the<br />
Group companies with diverging fi nancial years is not required pursuant to IAS 27 “Consolidated<br />
and Separate Financial Statements” because their closing dates are no more than three months<br />
prior to the Group closing date.<br />
The capital consolidation is compiled in accordance with the requirements of IAS 27. Subsidiaries<br />
are all companies (including special purpose entities) with respect to which the Group exercises<br />
control over fi nancial and business <strong>policy</strong>. Subsidiaries are included in the consolidated fi nancial<br />
statement (full consolidation) from the point in time when control passed to the Group. They are<br />
deconsolidated at the point in time when control ends.<br />
Investments in subsidiaries not included in the consolidated fi nancial statement because of their<br />
subordinate importance – in relation to assets, fi nancial position and net income of the Group – are<br />
recognized at fair value or, if this cannot be reliably established, at amortized cost in the balance<br />
sheet item “Investments in affi liated companies and participating interests”.<br />
Acquired subsidiaries are accounted using the purchase method. The acquisition costs associated<br />
with purchase correspond to the fair value of the assets off ered and liabilities arising/assumed<br />
at the time of the transaction. Acquisition-related costs are recognized in income when they are<br />
incurred. Assets, liabilities and contingent liabilities that can be identifi ed in the context of a corporate<br />
acquisition are measured upon initial consolidation at their fair values at the time of acquisition.<br />
A diff erence arising out the netting of the acquisition costs with the fair value of the assets<br />
and liabilities is recognized as goodwill under intangible assets. In accordance with IFRS 3 “Business<br />
Combinations” scheduled amortization is not taken on goodwill; instead, it is written down as necessary<br />
on the basis of annual impairment tests. Immaterial and negative goodwill are recognized in<br />
the statement of income in the year of their occurrence.
Notes Consolidation<br />
Minority interests in shareholders’ equity or in the net income of majority-owned subsidiaries<br />
are shown separately in equity in the item “Minority interests” and in the statement of income in<br />
the item “Minority interest in profi t or loss”.<br />
All intra-group receivables and liabilities as well as income, expenses, and profi ts and losses resulting<br />
from intra-group transactions were eliminated within the scope of the debt and earnings<br />
consolidation.<br />
Companies over which the Group is able to exercise a signifi cant infl uence are normally consolidated<br />
“at equity” as associated companies and initially carried at cost of acquisition. A signifi cant<br />
infl uence is presumed to exist if a company belonging to the Group directly or indirectly holds<br />
at least 20% – but no more than 50% – of the voting rights. The Group’s investment in associated<br />
companies includes the goodwill arising upon acquisition. The accounting policies used by<br />
associated companies were in principle modifi ed – if necessary – in order to ensure consistent<br />
Group-wide accounting. The Group’s share in the profi ts and losses of associated companies is<br />
recognized separately in the consolidated statement of income in accordance with IAS 1 “Presentation<br />
of Financial Statements”.<br />
Joint ventures, i.e. if two or more partner companies conduct a commercial activity under joint<br />
management, are included in the consolidated fi nancial statement according to proportionate<br />
consolidation. The procedure for proportionate consolidation largely corresponds to the inclusion<br />
of subsidiaries pursuant to IAS 27. However, the assets and liabilities as well as the expenses<br />
and income of the joint venture are not carried over to the consolidated balance sheet and consolidated<br />
statement of income in the full amount, but rather only on a proportionate basis.<br />
Scope of consolidation<br />
<strong>Talanx</strong> AG is the ultimate parent company of the Group. In accordance with IAS 27 the consolidated<br />
fi nancial statement includes <strong>Talanx</strong> AG (as the parent company) and all major domestic and foreign<br />
Group companies in which <strong>Talanx</strong> AG indirectly or directly holds a majority voting interest or<br />
over which it exercises a de facto power of control.<br />
155
156 <strong>Talanx</strong> Group Financial report 2010<br />
Only subsidiaries which are of minor importance – both individually and in their entirety – for<br />
the net assets, fi nancial position and results of operations of the Group and which do not transact<br />
insurance business are exempted from consolidation. The Group assesses whether a subsidiary is<br />
of minor importance on the basis of the company’s total assets and net income relative to the corresponding<br />
average values for the Group as a whole over the last three years. For this reason 37 (35)<br />
subsidiaries, the business object of which is primarily the rendering of services for insurance companies<br />
within the Group, were not consolidated in the year under review. Altogether, the balance<br />
sheet total of these subsidiaries amounts to less than 0.1% of the average balance sheet total of the<br />
Group over the last three years; the result of these companies amounts to altogether less than 1% of<br />
the average result of the Group over the last three years. In subsequent periods the subsidiaries not<br />
included in the consolidated group on grounds of materiality are examined on each closing date in<br />
order to verify whether consolidation is required in light of a reassessment of materiality.<br />
The scope of consolidation as at the balance sheet date encompasses the companies listed in the<br />
table below.<br />
Scope of consolidation 2010 2009<br />
Number of consolidated companies<br />
Germany 70 74<br />
Abroad 1) 86 89<br />
Total 156 163<br />
Number of consolidated special purpose entities<br />
Abroad 2 2<br />
Total 2 2<br />
Number of consolidated special funds<br />
Germany 14 16<br />
Abroad 8 2<br />
Total 22 18<br />
Sum total of consolidated companies 180 183<br />
Number of associated companies included at equity<br />
Germany 3 3<br />
Abroad 2) 9 9<br />
Total 12 12<br />
Joint ventures consolidated proportionately<br />
Germany 1 —<br />
1) Consists of: 47 (52) individual companies and 39 (37) companies which are consolidated in 3 (3) subgroups.<br />
2) Consists of: 3 (4) associated companies and 6 (5) companies which are included at equity in 1 (1) subgroup.
Notes Consolidation<br />
With regard to the major acquisitions and disposals in the year under review please see our explanatory<br />
remarks in the following subsections of this section. All affi liated companies, joint ventures,<br />
special funds and special purpose entities as well as associated companies are specifi ed individually<br />
in the list of shareholdings (see separate section of these Notes, pages 256 et seqq.).<br />
Acquisitions and disposals as well as further corporate changes<br />
In the year under review fi ve subsidiaries, four associated companies (thereof one company in a<br />
subgroup of Hannover Re) and one joint venture were added to the Group. The 13 disposals relating<br />
to subsidiaries resulted from eight internal Group mergers, one sale and four liquidations/deletions.<br />
In addition, four additions and two disposals occurred at two subgroups of Hannover Re.<br />
Furthermore, two associated companies are no longer recognized at equity. Specifi cally, the scope<br />
of consolidation of the Group changed as follows as at 31 December 2009:<br />
Establishments<br />
On 25 February 2010 the companies Erste Credit Life International AG (in future: Credit Life<br />
International Lebensversicherung AG) and Zweite Credit Life International AG (in future: Credit<br />
Life International Versicherung AG), both based in Hilden, were established. The two companies<br />
are to transact credit life business with eff ect from 1 July 2010. The companies are wholly owned by<br />
HDI-Gerling Leben Service Holding AG, Cologne (renamed <strong>Talanx</strong> Deutschland AG and registered<br />
offi ce relocated to Hannover on 7 December 2010 – abbreviated to TD); the share capital of each<br />
company amounts to EUR 50 thousand and is fully paid up.<br />
Acquisitions<br />
Eff ective 16 March 2010 Funis GmbH & Co. KG participated with a capital contribution of<br />
EUR 8 thousand (corresponding to 75.2% of the shares) in the newly established Foco 146 AB, which<br />
is based in Stockholm, Sweden. The company began trading under the name Svedea AB with eff ect<br />
from the balance sheet date. The company’s business object consists principally of writing liability<br />
insurance for motor vehicles and yachts. On account of its subordinate importance the company<br />
was not included in the consolidated fi nancial statement.<br />
With eff ect from the second quarter Inter Hannover (No. 1) Limited, London, was included in the<br />
consolidated fi nancial statement for the fi rst time. All shares in the company are held by International<br />
Insurance Company of Hannover Ltd., Bracknell. The object of the company, which is a<br />
corporate member of Lloyd’s of London with limited liability, is to participate in the business of one<br />
or more Lloyd’s syndicates. Further details are provided in the section “Business combinations in<br />
the reporting period” on page 163.<br />
At the beginning of July 2010 HDI-Gerling International Holding AG (trading with eff ect from<br />
30 December 2010 as <strong>Talanx</strong> International AG – abbreviated to TINT), Hannover, and <strong>Talanx</strong> AG,<br />
Hannover, acquired 99% and 1% respectively of OOO Strakhovaya Kompaniya “HDI Strakhovanie”,<br />
Moscow. The common shares amount to RUB 30 million (EUR 1 million). The company is active<br />
in the Retail International segment (see also the section “Business combinations in the reporting<br />
period” on page 163).<br />
157
158 <strong>Talanx</strong> Group Financial report 2010<br />
Mergers<br />
The Polish company HDI-Gerling Polska Towarzystwo Ubezpieczen S.A., Warsaw, was merged into<br />
HDI Asekuracja Towarzystwo Ubezpieczen S.A., Warsaw, with retroactive eff ect from 30 June 2010.<br />
In the third quarter of 2010 Hannover Beteiligungsgesellschaft mbH, Hannover, was merged<br />
into GERLING Beteiligungs-GmbH, Cologne, Proactiv Holding AG, Hilden, was merged into <strong>Talanx</strong><br />
Deutschland AG, Hannover, and HDI-Gerling UK Service Company Ltd., London, was merged into<br />
the London branch of HDI-Gerling Industrie Versicherung AG with retroactive eff ect from 1 January<br />
2010.<br />
By way of a contract dated 30 August 2010 Clarus GmbH, Wiesbaden, was merged into DTPVO<br />
Deutsche Privatvorsorge AG (DTPVO), Darmstadt, with retroactive eff ect from 1 January 2010.<br />
DTPVO was renamed Clarus AG and has its registered offi ce in Wiesbaden. The entries were made<br />
on 15 October 2010.<br />
In December 2010 ASPECTA Euro Group GmbH, Cologne, was merged into <strong>Talanx</strong> International AG,<br />
Hannover, ASPECTA Lebensversicherung AG was merged into HDI-Gerling Lebensversicherung AG,<br />
both Cologne, and HBG Hannover Beteiligungsgesellschaft mbH & Co. KG, Hannover, was merged<br />
into GERLING Beteiligungs-GmbH, Cologne, with retroactive eff ect from 1 October 2010.<br />
Disposal<br />
<strong>Talanx</strong> AG sold its participating interest in Euro International Reinsurance S.A., Luxembourg, to a<br />
non-Group company at the end of May 2010. The disposal produced income of EUR 9 million in the<br />
Non-Life Reinsurance segment.<br />
Liquidations/deletions<br />
The Italian company HDI Servizi S.r.l., Rome, was liquidated at the end of the second quarter of<br />
2010.<br />
On 22 September 2010 PENATES A. Ltd., British Virgin Islands, was deleted from the public register.<br />
The Irish companies E+S Reinsurance (Ireland) and Hannover Reinsurance (Dublin), both based in<br />
Dublin, were deleted from the public register on 25 November 2010.<br />
Further corporate changes<br />
Eff ective 8 March 2010 Hannover Rück Beteiligung Verwaltungs-GmbH (HRBV), which is wholly<br />
owned by Hannover Re, reached agreement with a third party outside the Group on the sale of<br />
0.5% of its stake in E+S Rück – by way of a share reduction without a change of control status.<br />
Upon closing of the transaction HRBV held an interest of 63.69% in E+S Rück.
Notes Consolidation<br />
Eff ective 26 April 2010 the share capital of E+S Rück, Hannover, was increased out of retained<br />
earnings without the issue of new shares by an amount of EUR 2.8 million from EUR 42.6 million to<br />
EUR 45.5 million. The par value per share now stands at EUR 600. This did not give rise to a change<br />
of control status.<br />
TINT increased its stake in HDI Seguros S.A., São Paulo/Brazil, to 99.998% in the context of a capital<br />
increase at the end of June 2010, in which the minority shareholders did not participate. Through<br />
the acquisition of further shares from minority shareholders TINT also increased its stake in HDI<br />
Seguros S. A. de C. V., León/Mexico, from 99.45% to 99.98% in the year under review.<br />
Furthermore, TINT increased its stake in HDI STRAKHUVANNYA (Ukraine), Kiev, to 99.224% in the<br />
context of a capital increase in August and September 2010 in which the minority shareholders did<br />
not participate. Through the acquisition of further shares from minority shareholders TINT also<br />
increased its stake in HDI Seguros S. A./Chile from 99.922% to 99.927% in the year under review.<br />
Consolidation of special purpose entities<br />
With regard to the consolidation of special purpose entities, the Group makes a distinction below<br />
between the areas of investments (excluding special and public funds), securitization of reinsurance<br />
risks and Insurance-Linked Securities (ILS). Such special purpose entities are to be examined in<br />
accordance with SIC-12 “Consolidation – Special Purpose Entities” with an eye to their consolidation<br />
requirement. In cases where IFRS do not currently contain any specifi c standards, our analysis also<br />
falls back – in application of IAS 8 – on the relevant standards of US GAAP.<br />
Investments<br />
Within the scope of its asset management activities our subsidiary Hannover Re, Hannover, has<br />
participated since 1988 in numerous special purpose entities – predominantly funds –, which for<br />
their part transact certain types of equity and debt capital investments. On the basis of our analysis<br />
of the relations with these entities we concluded that the Group does not exercise a controlling<br />
infl uence in any of these transactions and a consolidation requirement therefore does not exist.<br />
Hannover Re participates – primarily through the companies Secquaero ILS Fund Ltd., Grand Cayman/Cayman<br />
Islands, and Hannover Insurance-Linked Securities GmbH & Co. KG, Hannover, – in<br />
a number of special purpose entities for the securitization of catastrophe risks by investing in<br />
disaster bonds (or “cat bonds”). Since Hannover Re does not exercise a controlling infl uence in any<br />
of these transactions either there is no consolidation requirement<br />
159
160 <strong>Talanx</strong> Group Financial report 2010<br />
Securitization of reinsurance risks<br />
The securitization of reinsurance risks is largely structured through the use of special purpose<br />
entities.<br />
In July 2009 Hannover Re issued a catastrophe (“cat”) bond with the aim of transferring to the<br />
capital market peak natural catastrophe exposures deriving from European windstorm events. The<br />
term of the cat bond, which has a volume of nominally EUR 150 million, runs until 31 March 2012;<br />
it was placed with institutional investors from Europe and North America by Eurus II Ltd., a special<br />
purpose entity domiciled in the Cayman Islands. Hannover Re does not exercise a controlling infl uence<br />
over the special purpose entity. Under IFRS this transaction is to be recognized as a fi nancial<br />
instrument.<br />
Eff ective 1 January 2009 Hannover Re raised further underwriting capacity for catastrophe risks<br />
on the capital market by way of the “K6” transaction. This securitization, which was placed with<br />
institutional investors in North America, Europe and Asia, involves a quota share cession on worldwide<br />
natural catastrophe business as well as aviation and marine risks. The volume of “K6”, which<br />
was increased in the year under review, was equivalent to EUR 249 (123) million as at the balance<br />
sheet date. The planned term of the transaction runs until 31 December 2011 or in the case of the<br />
new shares placed in the year under review until 31 December 2012. Kaith Re Ltd., a special purpose<br />
entity domiciled in Bermuda, is being used for the securitization.<br />
Hannover Re also uses the special purpose entity Kaith Re Ltd. for various retrocessions of its traditional<br />
covers to institutional investors. In accordance with SIC-12 Kaith Re Ltd. is included in the<br />
consolidated fi nancial statement.<br />
Eff ective 26 April 2010 Hannover Re made use of its right of early cancellation and terminated the<br />
credit default swap underlying the “Merlin” transaction. Since 2007 Hannover Re had used this<br />
transaction to transfer risks from reinsurance recoverables to the capital market. The securities<br />
serving as collateral were issued through the special purpose entity Merlin CDO I B.V., over which<br />
Hannover Re did not exercise a controlling infl uence.
Insurance-Linked Securities (ILS)<br />
Notes Consolidation<br />
In the course of 2010, as part of its extended Insurance-Linked Securities (ILS) activities, Hannover<br />
Re wrote a number of so-called collateralized fronting arrangements under which risks assumed<br />
from ceding companies were passed on to institutional investors outside the Group using special<br />
purpose entities. The purpose of such transactions is to directly transfer clients’ business. Due to<br />
the lack of a controlling infl uence over the special purpose entities involved, there is no consolidation<br />
requirement for Hannover Re with respect to these structures.<br />
The largest single transaction in this connection is “FacPool Re”, under which Hannover Re has<br />
transferred a portfolio of facultative reinsurance risks to the capital market since September 2009.<br />
The contracts, which cover worldwide individual risks, are mediated by an external reinsurance intermediary,<br />
written by Hannover Re and placed on the capital market in conjunction with a service<br />
provider. The “FacPool Re” transaction consists of a quota share reinsurance arrangement and two<br />
non-proportional cessions. The total amount of capital provided is equivalent to EUR 45 (42) million,<br />
with Hannover Re keeping a share of approximately EUR 4 (4) million and additionally assuming<br />
losses that exceed the capacity of “FacPool Re”. The term of the transaction is roughly two and<br />
a half years. A number of special purpose entities participate in the reinsurance cessions within<br />
“FacPool Re”; Hannover Re does not hold any shares in these special purpose entities and does not<br />
bear the majority of the economic benefi ts or risks arising out of their activities through any of its<br />
business relations.<br />
Associated companies<br />
Associated companies are those over which the Group exercises a signifi cant but not controlling<br />
infl uence. In the year under review 12 (12) were valued using the equity method in accordance with<br />
IAS 28 “Investments in Associates”. A further six (four) associated companies are not recognized<br />
at equity owing to their subordinate importance for the presentation of the net assets, fi nancial<br />
position and results of operations (please see here our remarks in the section “Accounting policies”,<br />
subsection “Summary of major accounting policies” from page 127 onwards).<br />
In the case of the company DFA Capital Management, Inc., Wilmington/USA, which had previously<br />
been consolidated as an associated company, the requirements for a signifi cant infl uence pursuant<br />
to IAS 28.7 are no longer satisfi ed; most notably, there is no interchange of personnel on the management/supervisory<br />
bodies. With eff ect from the second quarter of 2010, therefore, the company<br />
was no longer measured at equity, but was instead recognized as an investment under the balance<br />
sheet item “Investments in affi liated companies and participating interests”.<br />
161
162 <strong>Talanx</strong> Group Financial report 2010<br />
On 18 January 2010 Funis GmbH & Co. KG, a wholly owned subsidiary of Hannover Re, acquired<br />
an interest of 28.5% in Energi Holdings, Inc., based in Peabody/United States, for a purchase price<br />
equivalent to EUR 2.4 million. The business object of Energi Holdings, Inc. and its three other wholly<br />
owned subsidiaries is the mediation of risk management and insurance brokerage services for<br />
companies in the energy industry. On 9 December 2010 Funis GmbH & Co. KG acquired a participation<br />
of around 25% of the shares in XS Direct Holdings, based in Dublin/Ireland, by subscribing<br />
to newly issued shares. The interest amounts to EUR 2.5 million. The company held three further<br />
participations – in each case with all shares – as at the balance sheet date. The business object of<br />
the company consists principally of the development and sale of fi nancial services in Ireland and<br />
the United Kingdom. Both Energi Holdings, Inc. and XS Direct Holdings were not included in the<br />
consolidated fi nancial statement at equity owing to their subordinate importance.<br />
The company WPG IV CDA Liquidation Trust, Grand Cayman/Cayman Islands, was liquidated at the<br />
end of February 2010 and was therefore no longer measured at equity in the consolidated fi nancial<br />
statement from the fi rst quarter of 2010 onwards.<br />
In December 2010 AmpegaGerling Asset Management GmbH acquired a 25.1% stake in C-QUADRAT<br />
Investment AG, Vienna. The company will be measured at equity from the fourth quarter of 2010<br />
onwards and recognized for the fi rst time as an associated company in the consolidated fi nancial<br />
statement.<br />
Joint ventures<br />
Since 30 September 2010 one company has been included in the consolidated fi nancial statement<br />
on a proportionate basis as a joint venture in accordance with IAS 31 “Interests in Joint Ventures”.<br />
In July 2010 Proactiv Holding AG, Hilden, acquired 50% of the shares of Credit Life International<br />
Services GmbH, Neuss, from Rheinland Versicherungs AG for a purchase price of EUR 13 thousand.<br />
The acquisition took place with retroactive eff ect from 1 January 2010. Owing to the merger of<br />
Proactiv Holding AG into <strong>Talanx</strong> Deutschland AG (TD), these shares are currently held by TD. Prior<br />
to acquisition the acquired company did not conduct any form of business activity whatsoever. The<br />
business object of Credit Life International Services GmbH is the mediation of insurance products<br />
with and without underwriting, collection and loss adjustment powers as well as the provision of<br />
consulting services for companies. Since TD and Rheinland Versicherungs AG, Neuss, each hold a<br />
50% interest in the share capital of EUR 25 thousand, Credit Life International Services GmbH is<br />
included in the consolidated fi nancial statement for the fi rst time from the third quarter of 2010<br />
onwards as a joint venture on a proportionate basis.<br />
There are no contingent liabilities or capital commitments whatsoever on the part of TD with respect<br />
to Credit Life International Services GmbH. Of the company consolidated on a proportionate<br />
basis, current and non-current assets and liabilities as well as income and expenses in amounts of<br />
EUR 2 million each are attributable to the Group share. Goodwill did not arise in the context of this<br />
transaction. At the time of its acquisition the joint venture was of subordinate importance from the<br />
standpoint of the <strong>Talanx</strong> Group.
Notes Consolidation. Business combinations in the reporting period<br />
Business combinations in the reporting period<br />
On 7 July 2010 (date of acquisition) the Group acquired through its subsidiary HDI-Gerling International<br />
Holding AG 99% and through <strong>Talanx</strong> AG 1% of the shares of HDI Strakhovanie (previously<br />
Fortis Insurance Company LLC), Russia, for EUR 1 million from Fortis Insurance International N.V. and<br />
Sycamore Insurance 2 B.V. HDI Strakhovanie is an insurance company that has previously transacted<br />
property/casualty primary insurance in Russia on a limited scale. The company, which in future<br />
will complement the product portfolio of our existing Russian subsidiary with property/casualty<br />
products, commenced its business operations in December 2010. No appreciable costs were incurred<br />
in connection with the business combination.<br />
HDI Strakhovanie was consolidated for the fi rst time in the third quarter of 2010, and will be included<br />
in the consolidated fi nancial statement as a fully consolidated subsidiary from that point in time<br />
onwards. The acquired assets in an amount of EUR 1 million relate exclusively to cash at banks. The<br />
goodwill calculated upon acquisition totaled EUR 0.1 million. We have omitted an “as if” presentation<br />
and information on the profi t contributions generated since acquisition of the company, since there<br />
are no material implications for the net assets, fi nancial position and results of operations of the<br />
<strong>Talanx</strong> Group. A loss of EUR 37 thousand was recorded in the 2010 fi nancial year.<br />
With eff ect from 15 January 2010 all shares of Inter Hannover (No. 1) Limited, London, were acquired<br />
through the Group subsidiary International Insurance Company of Hannover Ltd., Bracknell. Since<br />
the company is not of material signifi cance from the standpoint of the <strong>Talanx</strong> Group and given that<br />
this company was formerly a so-called “shelf company”, we have omitted the disclosures of information<br />
pursuant to IFRS 3 “Business Combinations”.<br />
163
164 <strong>Talanx</strong> Group Financial report 2010<br />
Non-current assets held for sale and disposal groups<br />
The fi ve items of real estate classifi ed in the previous year as properties for sale (balance sheet item:<br />
investment property) with a book value of EUR 35 million in the Retail Germany segment were all<br />
sold as planned with economic eff ect in 2010.<br />
On 21 December 2010 our subsidiary in the Non-Life Reinsurance segment Hannover Re reached<br />
agreement on the sale of its US subgroup Clarendon Insurance Group, Inc., Wilmington (CIGI), to<br />
Enstar Group Ltd., Hamilton, a Bermuda-based company specializing in the run-off of insurance<br />
business. Hannover Re holds all shares of CIGI indirectly through the intermediate holding company<br />
Hannover Finance, Inc., Wilmington (HFI), which is also included in full in the consolidated<br />
fi nancial statement. The buyer is to acquire all shares of CIGI at a purchase price equivalent to<br />
EUR 163 million before fi nal price determination, which will take place upon adoption of the local<br />
annual fi nancial statement as at 31 December 2010. As at the balance sheet date the transaction was<br />
still subject to the customary regulatory approvals. Closing of the transaction and the associated<br />
deconsolidation from Hannover Re are anticipated in the second quarter of 2011.<br />
Pursuant to IFRS 5 “Non-current Assets Held for Sale and Discontinued Operations” CIGI was classifi<br />
ed as at the balance sheet date as a disposal group, which is to be measured at the lower of the<br />
carrying amount and fair value less costs to sell. This measurement gave rise to the recognition of<br />
impairment losses in an amount of EUR 10 million, which were carried in other income/expenses.<br />
In addition, a miscellaneous liability of EUR 4 million was recognized for selling expenditures and a<br />
sundry provision of EUR 55 million was constituted for expenses in connection with measurement<br />
of the disposal group. The corresponding expenses were recognized in other income/expenses.<br />
The cumulative other comprehensive income of –EUR 29 million arising out of the currency<br />
translation of the assets and liabilities belonging to the disposal group will only be realized in the<br />
context of deconsolidation. Profi ts and losses from the measurement of available-for-sale fi nancial<br />
assets in an amount of EUR 3 million as at the balance sheet date will also not be realized until<br />
deconsolidation.
Notes Non-current assets held for sale and disposal groups<br />
In compliance with IFRS 5 “Non-current Assets Held for Sale and Discontinued Operations” we<br />
recognize the assets and liabilities of the disposal group in corresponding balance sheet items that<br />
are distinct from continuing operations. Transactions between the disposal group and the Group’s<br />
continuing operations continue to be entirely eliminated in conformity with IAS 27 “Consolidated<br />
and Separate Financial Statements”.<br />
The assets and liabilities of the disposal group are presented in the following table and broken<br />
down into their major components:<br />
Figures in EUR million 31.12.2010<br />
Assets<br />
Total investments 643<br />
Cash 27<br />
Reinsurance recoverables on unpaid claims 831<br />
Accounts receivable 17<br />
Other assets 11<br />
Assets held for sale 1,529<br />
Liabilities<br />
Technical provisions 1,310<br />
Funds withheld 27<br />
Reinsurance payable 17<br />
Other liabilities 27<br />
Liabilities related to assets held for sale 1,381<br />
In addition, we are currently reviewing the possibility of disposing of three real estate objects in<br />
Munich, Hamburg and Cologne with book values of altogether EUR 57 million (balance sheet item:<br />
investment property) which are allocated to the Retail Germany segment. The planned disposal in<br />
2011 is prompted above all by unfavorable rental forecasts. The sales negotiations are to commence<br />
in the fi rst quarter of 2011. Since the requirements pursuant to IFRS 5 were not fully satisfi ed at the<br />
closing date, separate disclosure as “non-current assets held for sale” as at 31 December 2010 was<br />
omitted.<br />
165
166 <strong>Talanx</strong> Group Financial report 2010<br />
Nature of risks associated with insurance contracts and<br />
fi nancial instruments<br />
The disclosures provided below complement the risk reporting in the management report and refl<br />
ect the requirements of German Accounting Standard DRS 5-20, IFRS 4 and IFRS 7. For fundamental<br />
qualitative statements, e.g. regarding the organization of our risk management or the assessment<br />
of the risk situation, please see the risk report contained in the management report.<br />
Classes of fi nancial instruments<br />
IFRS 7 “Financial Instruments: Disclosures” sets out all the disclosures required for fi nancial instruments.<br />
Some disclosure duties are to be met by establishing classes of fi nancial instruments. The<br />
grouping made in this context must facilitate a minimum distinction between fi nancial instruments<br />
measured at fair value and those measured at amortized cost. The establishment of classes<br />
need not necessarily be identical to the categorization of fi nancial instruments pursuant to IAS 39.6<br />
or IAS 39.45–46 for purposes of subsequent measurement. The classes established for our fi nancial<br />
instruments were guided by the needs of our portfolio and our balance sheet structure; the degree<br />
of detail of the stated classes may vary as permitted according to the required disclosure.<br />
Essentially, the following classes of fi nancial instruments were established:<br />
■ Financial instruments from insurance contracts<br />
■ Accounts receivable on insurance business<br />
■ Reinsurance recoverables on technical provisions<br />
■ Funds held by ceding companies<br />
■ Funds held under reinsurance treaties<br />
■ Financial instruments from investments<br />
■ Investments in affi liated companies and participating interests<br />
■ Loans and receivables<br />
■ Financial assets held to maturity<br />
■ Financial assets available for sale<br />
■ Fixed-income securities<br />
■ Variable-yield securities<br />
■ Financial assets at fair value through profi t or loss<br />
■ Financial assets classifi ed at fair value through profi t or loss<br />
■ Financial assets held for trading<br />
■ Other invested assets<br />
■ Other fi nancial instruments<br />
■ Other assets – derivative fi nancial instruments that satisfy the criteria for hedge accounting<br />
(hedging instruments)<br />
■ Subordinated liabilities<br />
■ Notes payable and loans<br />
■ Other liabilities – derivative fi nancial instruments (trading portfolios with a negative fair<br />
value) as well as derivative fi nancial instruments that satisfy the criteria for hedge accounting<br />
(hedging instruments with a negative fair value)
Notes Nature of risks associated with insurance contracts and fi nancial instruments<br />
The focus of the <strong>Talanx</strong> Group’s business activities is on the sale and administration of insurance<br />
products in all standard lines of property/casualty and life insurance in both primary and reinsurance<br />
business.<br />
Risks from insurance contracts<br />
Risks from insurance contracts consist principally of insurance risks, default risks, liquidity risks and<br />
market risks. Insurance risks in property/casualty insurance are considered separately from those in<br />
life insurance because of the signifi cant diff erences between them.<br />
Management of technical risks in property/casualty insurance<br />
Insurance risks in non-life business (primary insurance and reinsurance) derive primarily from the<br />
premium/loss risk and the reserving risk.<br />
Insurance business is based upon the assumption of individual risks from <strong>policy</strong>holders (in primary<br />
insurance) or cedants (in reinsurance) and the equalization of these risks in the community<br />
of (re)insureds and over time. For the insurer, the fundamental risk lies in providing insurance<br />
benefi ts, the amount and due date of which are unknown, from premiums calculated in advance<br />
that cannot be changed. The reserving risk arises out of the potentially insuffi cient establishment<br />
of reserves in the balance sheet and the resulting strain on the technical result.<br />
We counter the assumed premium/loss risk inter alia through appropriate reinsurance protection.<br />
The volume of reinsurance protection relative to the gross written premium can be measured according<br />
to the level of retained premium; shown below broken down by segments, this indicates<br />
the proportion of written risks retained for our risk.<br />
Retention by segments<br />
%<br />
2010 2009<br />
Industrial Lines 46.1 43.7<br />
Retail Germany 91.6 85.6<br />
Retail International 92.4 86.9<br />
Non-Life Reinsurance 88.9 94.1<br />
Total Non-Life Insurance 78.9 78.7<br />
The level of retained premium on the Group level in non-life insurance remained roughly on a par<br />
with the previous year at 78.9%, compared to 78.7%. Changes occurred on the level of individual segments,<br />
however, which in some cases were signifi cant. Most notably, the cancellation of a quota share<br />
reinsurance treaty in the motor lines at the Turkish company HDI Sigorta – a move prompted by<br />
regulatory requirements – caused the retention to increase in the Retail International segment. The<br />
rise of retention in the Retail Germany segment can be attributed above all to the contraction in gross<br />
written premium. The reduced retention in Non-Life Reinsurance – which saw a drop from 94.1% to<br />
88.9% – was due in large measure to the growth in gross premium volume, which increased by 10.3%.<br />
167
168 <strong>Talanx</strong> Group Financial report 2010<br />
The net loss ratio in the segments aft er Group restructuring developed as follows in a year-on-year<br />
comparison:<br />
Net loss ratio by segments<br />
%<br />
2010 2009<br />
Industrial Lines 82.0 68.6<br />
Retail Germany 69.4 62.5<br />
Retail International 75.6 71.6<br />
Non-Life Reinsurance 72.0 72.8<br />
Total Non-Life Insurance 73.6 70.5<br />
The moderate level of the loss ratios in past years refl ects our prudent underwriting <strong>policy</strong><br />
and successes in active claims management. On the level of the <strong>Talanx</strong> Group the loss ratio for<br />
the non-life insurers climbed by altogether 3.1 percentage points in the year under review. The<br />
sharply higher loss ratio in the Industrial Lines segment can be attributed to increased strains<br />
asso ciated in particular with major loss events. The loss ratio in the previous year had been<br />
driven by a generally favorable claims experience. The rise in the Retail Germany segment was<br />
due to motor insurance business in the year under review as well as the favorable claims experience<br />
in 2009. In the Retail International segment fl ooding and frost damage in Poland as well as<br />
well as earthquakes in Chile caused the loss ratio to surge sharply higher. In the Non-Life Reinsurance<br />
segment the loss ratio remained slightly below the level of the previous year – despite the<br />
burden of major losses (increase in catastrophe loss ratio from 4.6% in the previous year to 12.3%<br />
in the year under review) – thanks to a favorable run-off of claims incurred in prior years as well<br />
as a pleasing basic loss trend.<br />
In order to ensure that the existing benefi t commitments can be fulfi lled at all times, corresponding<br />
provisions are established and their adequacy is continuously analyzed using actuarial<br />
methods. These also provide insights into the quality of the written risks, their spread across<br />
individual lines with diff ering risk exposures as well as the anticipated future claims payments.<br />
In addition, our portfolios are subject to active claims management. Analyses of the distribution<br />
of loss amounts and claim frequencies facilitate systematic management of the risks.<br />
The loss reserves calculated in the reinsurance sector using actuarial methods are supplemented<br />
where necessary by additional reserves based on our own actuarial loss estimations and the IBNR<br />
(incurred but not reported) reserve for losses that have already occurred but have not yet been<br />
reported to us. Especially in casualty business, IBNR reserves – diff erentiated by risk classes and<br />
regions – are constituted in view of the long run-off of such claims.<br />
The adequate measurement of loss reserves for asbestos-related claims and pollution damage is<br />
a highly complex matter, since in some cases several years or even decades may elapse between<br />
the causation of the loss or injury and its notifi cation. The Group’s exposure to asbestos-related<br />
claims and pollution damage is, however, relatively slight. The adequacy of these reserves is<br />
normally measured using the so-called “survival ratio”. This ratio expresses how many years<br />
the reserves would cover if the average level of paid claims over the past three years were to<br />
continue. At the end of the year under review our survival ratio in the reinsurance sector stood<br />
at 22.8 (24.3) years; the reserves for asbestos-related claims and pollution damage amounted to<br />
EUR 212 (198) million.
Notes Nature of risks associated with insurance contracts and fi nancial instruments<br />
Licensed scientifi c simulation models, supplemented by the expertise of the relevant specialist<br />
departments, are used to assess the material catastrophe risks from natural hazards (earthquake,<br />
windstorm) for the Non-Life Reinsurance segment. Furthermore, we establish the risk to our<br />
portfolio from various scenarios (e.g. hurricanes in the US, windstorms in Europe, earthquakes in<br />
the US) in the form of probability distributions. The monitoring of the natural hazards exposure<br />
of the portfolio (accumulation control) is rounded out by the progressive inclusion of realistic<br />
extreme loss scenarios.<br />
We analyze extreme scenarios and accumulations that could lead to large losses. Based on the<br />
current and most recently calculated fi gures, the potential net loss burdens for the Group are as<br />
follows:<br />
Accumulation scenarios 1) Figures in EUR million<br />
2010 2009<br />
250-year loss US windstorm 709 763<br />
250-year loss California earthquake 531 504<br />
250-year loss European windstorm 530 581<br />
250-year loss Tokyo earthquake 460 426<br />
250-year loss Japanese windstorm 386 369<br />
250-year loss Sydney earthquake 183 325<br />
1) The actual natural catastrophe experiences may diverge fr om the model assumptions<br />
Peak exposures from accumulation risks are protected against through the use of carefully and<br />
individually selected reinsurance covers. In this way we are able to eff ectively limit – and hence<br />
render plannable – large individual losses and the impact of accumulation events.<br />
Run-off triangles are another tool used to verify our assumptions within the Group. Such triangles<br />
show the changes over time in the reserves as a consequence of paid claims and in the recalculation<br />
of the reserves that are to be established as at each balance sheet date. Adequacy is monitored<br />
using actuarial methods (see here also our explanatory remarks on the balance sheet item 20 “Loss<br />
and loss adjustment expense reserve”, pages 219 et seqq.).<br />
In property/casualty insurance the reserving risk is monitored and managed through analysis of<br />
the loss reserves using actuarial methods. In the case of the annuity reserve – as part of the loss<br />
and loss adjustment expense reserve – we also monitor the interest rate trend. A fall in interest<br />
rates would result in a charge to income owing to establishment of a reserve. The annuity reserve is<br />
calculated using the latest annuity tables as an actuarial basis.<br />
An increase of 5 percentage points in the net loss ratio in the area of property/casualty insurance<br />
and non-life reinsurance would reduce the net profi t aft er tax by EUR 321 (298) million.<br />
Management of market risks in life insurance<br />
Typical risks in life insurance (life primary insurance and life/health reinsurance) are associated<br />
with the fact that policies contain long-term benefi t guarantees. Along with interest rate risks,<br />
biometric risks and lapse risks are therefore particularly relevant here. Biometric actuarial bases<br />
such as mortality, longevity and morbidity are established at the inception of a contract in order to<br />
calculate premiums and reserves and measure deferred acquisition costs. Over time, however, these<br />
assumptions may prove to be no longer accurate and may therefore necessitate additional expenditures.<br />
The adequacy of the biometric actuarial bases is therefore regularly reviewed.<br />
169
170 <strong>Talanx</strong> Group Financial report 2010<br />
In view of the aforementioned risks, the calculation bases and our expectations may prove inadequate.<br />
Our life insurers use a variety of tools to counter this possibility:<br />
■ In order to calculate premiums and technical provisions the Group companies use prudently<br />
quantifi ed actuarial bases, the adequacy of which is regularly assured through a continuous<br />
reconciliation of the claims expected according to the withdrawal tables and the claims actually<br />
incurred. In addition, the actuarial bases make appropriate allowance for the risks of error, random<br />
fl uctuation and change by means of commensurate safety loadings.<br />
■ Life insurance policies for the most part involve long-term contracts with a discretionary surplus<br />
distribution. Minor changes in the assumptions with respect to the biometric factors, interest<br />
rates and costs on which tariff s are based are absorbed by the safety loadings built into the actuarial<br />
bases. If these safety loadings are not required, they generate surpluses that are for the most<br />
part – in accordance with statutory requirements – passed on to <strong>policy</strong>holders. The impact on<br />
profi tability in the event of a change in the risk, cost or interest rate expectations is thus limited<br />
by adjustment of the future surplus participation of <strong>policy</strong>holders.<br />
■ We regularly review the lapse pattern of our <strong>policy</strong>holders and the lapse trend of our in-force<br />
portfolio.<br />
■ Additional protection is obtained against certain – primarily biometric – risks by taking out<br />
reinsurance treaties.<br />
In life and health reinsurance, too, the previously described biometric risks are of special importance.<br />
The reserves in life and health reinsurance are based principally upon the information<br />
provided by ceding companies. The plausibility of the fi gures is checked using reliable biometric<br />
actuarial bases. Furthermore, local insurance regulators ensure that the reserves calculated by ceding<br />
companies satisfy all requirements with respect to actuarial methods and assumptions (e.g. use<br />
of mortality and morbidity tables, assumptions regarding the lapse rate etc.). The lapse and credit<br />
risks are also of importance with regard to the prefi nancing of cedants’ new business acquisition<br />
costs. The interest guarantee risk, on the other hand, is of only minimal risk relevance in most<br />
instances due to the structure of the contracts.<br />
The volume of reinsurance protection relative to the gross written premium can be measured according<br />
to the level of retained premium; shown below broken down by segments, this indicates<br />
the proportion of written risks retained for our risk:<br />
Retention by segments<br />
%<br />
2010 2009<br />
Retail Germany 92.9 90.4<br />
Retail International 84.1 83.3<br />
Life/Health Reinsurance 91.7 90.7<br />
Total 91.8 90.1
Notes Nature of risks associated with insurance contracts and fi nancial instruments<br />
We measure sensitivity to these risks using an embedded value analysis. The Market Consistent Embedded<br />
Value (MCEV) is a key risk management tool. It refers to the present value of future shareholders’<br />
earnings plus the shareholders’ equity less the cost of capital for the life insurance and life/<br />
health reinsurance portfolio aft er appropriate allowance for all risks underlying this business. The<br />
embedded value is market-consistent inasmuch as it is arrived at using a capital market valuation<br />
that meets certain requirements: free of arbitrage, risk-neutral, the modeling of the fi nancial<br />
instruments provides the current market prices.<br />
The New Business Value (NBV) is also taken into consideration. The MCEV and NBV denote the present<br />
value of future shareholders’ earnings from business in life insurance and life/health reinsurance<br />
aft er appropriate allowance for all risks underlying the business in question.<br />
The MCEV is calculated for our major life insurers as well as the life/health reinsurance business<br />
written by Hannover Re. Sensitivity analyses highlight the areas in which the Group’s life insurers<br />
and hence the Group as a whole are exposed in the life sector, and they provide pointers to the<br />
areas which should be emphasized from a risk management standpoint. Sensitivities to mortalities,<br />
lapse rates, administrative expenses as well as interest rate and equity price levels are considered in<br />
the analyses.<br />
Sensitivities to mortalities<br />
The degree of exposure of the Group’s life insurers varies according to the type of insurance product.<br />
Thus, a lower-than-expected mortality has a positive eff ect on products primarily involving<br />
a death and/or disability risk and a negative impact on products with a longevity risk – with corresponding<br />
implications for the MCEV.<br />
Sensitivities to lapse rates<br />
Under contracts with a right of surrender the recognized benefi t reserve is at least as high as the<br />
corresponding surrender value, and hence the economic impact of the lapse pattern tends to be<br />
more infl uenced by the level of lapse discounts and other product characteristics. A higher-thenexpected<br />
lapse rate would to some extent negatively aff ect the MCEV.<br />
Sensitivities to administrative expenses<br />
Higher-then-expected administrative expenses would result in a reduction of the MCEV.<br />
Sensitivities to interest rate and equity price levels<br />
The commitment to generate the minimum return for the contractually guaranteed benefi ts gives rise<br />
to a considerable interest guarantee risk in life primary insurance. The fi xed-income investments normally<br />
have a shorter duration than the obligations under the insurance contracts (durations mismatch).<br />
This creates a reinvestment risk for already accumulated credit balances and a new investment risk for<br />
future premiums. If the investment income generated across the remaining settlement period of the<br />
liabilities falls short of the interest due under the guarantees, this leads to a reduction in income and a<br />
decrease in the MCEV. A decline in the equity price level would also negatively impact the MCEV.<br />
171
172 <strong>Talanx</strong> Group Financial report 2010<br />
Derivatives embedded in life insurance contracts that are not recognized separately<br />
Insurance products may include the following major options on the part of the <strong>policy</strong>holder, insofar<br />
as they were agreed upon when the contract was taken out:<br />
■ Possibility of surrender and premium waiver for the contract<br />
■ Increase in insured benefi t without another medical examination – usually with the actuarial<br />
bases applicable at the time with respect to biometric risks and guaranteed interest rate (indexlinked<br />
adjustment, supplementary insurance guarantees in the event of certain changes in living<br />
conditions)<br />
■ Possibility of a one-time payment of the insured benefi t (lump-sum option) under deferred annuities<br />
instead of pension transition. This gives rise to a potential risk if an unexpectedly large<br />
number of <strong>policy</strong>holders were to exercise their option at an interest rate level signifi cantly above<br />
the discount rate used to calculate the annuities. The adequacy test required by IFRS 4 makes<br />
allowance for this option.<br />
Under unit-linked products the <strong>policy</strong>holder can opt for transfer of the relevant units upon maturity<br />
of the contract instead of payment of their equivalent value.<br />
Management of credit risks from insurance contracts<br />
Bad debts may arise on receivables due under insurance business. In order to limit this risk we<br />
take care to ensure the good credit quality of debtors, as measured on the basis of standard market<br />
rating categories. The selection of reinsurers also takes into account internal and external expert<br />
assessments, e.g. market information from brokers. Accounts receivable from <strong>policy</strong>holders and<br />
insurance intermediaries are unsecured. The default risk on these receivables is subject to constant<br />
monitoring within the scope of our risk management. At stake here are a large number of receivables<br />
in relatively modest single amounts, which are due from a diversifi ed array of debtors. Such<br />
accounts receivable are normally due from <strong>policy</strong>holders that do not have a rating. Only commercial<br />
clients in excess of certain dimensions are able to obtain external assessments of their credit<br />
status.<br />
The insurance intermediaries are either individual brokers or broker organizations, which similarly<br />
do not normally have a rating. Default risks in reinsurance business are controlled largely with the<br />
aid of system-supported cession management: cession limits are specifi ed for individual retrocessionaires<br />
and the remaining available capacities are calculated for short-, medium- and long-term<br />
business.<br />
With a view to countering possible delays in or defaults on premium payment in collections directly<br />
from <strong>policy</strong>holders or from intermediaries, each of the Group companies operates an eff ective collections<br />
procedure intended to minimize outstandings. Intermediaries are also subject to credit checks.
Notes Nature of risks associated with insurance contracts and fi nancial instruments<br />
Credit risks additionally arise in primary insurance business in connection with accounts receivable<br />
from reinsurers and in reinsurance business from recoverables due from retrocessionaires<br />
on account of the fact that the gross business written is not always fully retained, but instead<br />
portions are (retro)ceded as necessary. In passive reinsurance we pay close attention to a high level<br />
of fi nancial soundness on the part of the reinsurer, especially in the case of long-tail accounts. Our<br />
reinsurance partners are carefully selected by Security Committees in light of external ratings, their<br />
credit status is constantly monitored and – where necessary – appropriate measures are taken to<br />
secure receivables.<br />
As the equivalent of the maximum exposure to default risks on the balance sheet date, the book<br />
value of fi nancial assets deriving from the insurance business – irrespective of collateral or other<br />
agreements that serve to minimize the default risk – was as follows (excluding funds held by ceding<br />
companies):<br />
31.12.2010 1)<br />
Statement of book values of fi nancial<br />
assets deriving from insurance contracts<br />
Figures in EUR million<br />
Receivables<br />
Industrial Lines Retail Germany Retail International<br />
Non-Life<br />
Reinsurance<br />
Life/Health<br />
Reinsurance<br />
Policy loans<br />
Accounts receivable from<br />
— 198 2 — —<br />
<strong>policy</strong>holders<br />
Accounts receivable from insurance<br />
290 149 291 61 5<br />
intermediaries<br />
Accounts receivable from<br />
272 146 39 298 —<br />
reinsurance business<br />
Other assets<br />
Reinsurance recoverables on<br />
1,047 57 23 1,330 1,003<br />
technical provisions 2,967 873 254 914 515<br />
Total 4,576 1,423 609 2,603 1,523<br />
1) Presentation aft er elimination of intra-Group relations between segments<br />
31.12.2009 1)<br />
Statement of book values of fi nancial<br />
assets deriving from insurance contracts Industrial Lines 2) Figures in EUR million<br />
Receivables<br />
Retail Germany Retail International<br />
Non-Life<br />
Reinsurance<br />
Life/Health<br />
Reinsurance<br />
Policy loans<br />
Accounts receivable from<br />
— 199 2 — —<br />
<strong>policy</strong>holders<br />
Accounts receivable from insurance<br />
370 169 228 45 3<br />
intermediaries<br />
Accounts receivable from<br />
138 157 41 277 —<br />
reinsurance business<br />
Other assets<br />
Reinsurance recoverables on<br />
430 47 16 1,480 941<br />
technical provisions 2,980 888 234 1,595 265<br />
Total 3,918 1,460 521 3,397 1,209<br />
1) Presentation aft er elimination of intra-Group relations between segments<br />
2) Adjusted on the basis of IAS 8<br />
173
174 <strong>Talanx</strong> Group Financial report 2010<br />
The funds held by ceding companies represent the cash and securities deposits furnished by Group<br />
companies to cedants that do not trigger any cash fl ows and cannot be realized by cedants without<br />
the consent of our companies. The durations of these deposits are matched to the corresponding<br />
provisions. In the event of default on such a deposit the technical provision is reduced to the same<br />
extent. The credit risk is therefore limited; with this in mind, it was not shown in the above table.<br />
With respect to business ceded, we reduce the default risk on accounts receivable from reinsurers<br />
by carefully selecting reinsurers through our Group’s internal reinsurance broker Protection<br />
Reinsurance Intermediaries AG and reviewing their credit status on the basis of opinions from<br />
internationally respected rating agencies.<br />
In the three primary insurance segments the claims arising out of passive reinsurance, i.e. the<br />
cession of our assumed risks – the reinsurance recoverables – were unchanged year-on-year at<br />
EUR 4.1 billion. The resulting reinsurance recoverables on unpaid claims totaled EUR 3.1 (3.0) billion.<br />
The ratings of the counterparties for the reinsurance recoverables on unpaid claims were as follows<br />
on the Group level:<br />
AAA AA A BBB < BBB No rating<br />
%<br />
Reinsurance recoverables on technical<br />
provisions 2 (11) 40 (23) 44 (54) — (1) — (—) 14 (11)<br />
86 (88)% of our reinsurers are rated A or better. In determining the ratings, allowance has already<br />
been made for any collateral received – such as deposits or letters of credit.<br />
The accounts receivable from passive reinsurance business in the three primary insurance segments<br />
(aft er deduction of value adjustments) amounted to EUR 740 (389) million. As at the balance<br />
sheet date more than 60 (67)% of these accounts receivable were rated A or better.<br />
In the two reinsurance segments the claims due from retrocessions amounted to EUR 1.4 (1.9) billion<br />
as at the balance sheet date. Altogether 92 (96)% of retrocessionaires have an investment grade<br />
rating. Of these, almost 92 (94)% are rated A or better. The large proportion of reinsurers with top<br />
ratings refl ects our <strong>policy</strong> of avoiding default risks in this area wherever possible.
Notes Nature of risks associated with insurance contracts and fi nancial instruments<br />
The accounts receivable from insurance business that were overdue but not impaired at the balance<br />
sheet date can be broken down as follows:<br />
31.12.2010 31.12.2009<br />
> 3 months<br />
< 1 year > 1 year<br />
> 3 months<br />
< 1 year > 1 year<br />
Figures in EUR million<br />
Accounts receivable from <strong>policy</strong>holders 59 14 112 8<br />
Accounts receivable from insurance intermediaries 44 22 31 21<br />
Accounts receivable from reinsurance business 445 305 232 148<br />
Total 548 341 375 177<br />
The overdue receivables from insurance business are composed of accounts receivable that had not<br />
been paid by the due date and were still outstanding as at the balance sheet date. The presentation<br />
dispenses with the short duration range of “1 day to 3 months” in view of the diff erent processes<br />
used throughout the Group in this regard. Responsibility for receivables management within the<br />
Group is borne locally by the individual subsidiaries. The receivables management process – refl ecting<br />
the underlying business risks – consequently varies (inter alia diff ering treatment of receivables<br />
at risk of default (derecognition or value adjustment); diff ering points in time when receivables<br />
management is activated and diff ering tools used in receivables management). Only once a receivable<br />
is overdue by more than 90 days do the aforementioned reasons become insignifi cant, hence<br />
making Group-wide observations possible.<br />
The primary insurers had accounts receivable from <strong>policy</strong>holders and insurance intermediaries in<br />
primary insurance business that were overdue by more than 90 days as at the balance sheet date<br />
totaling EUR 73 (120) million and EUR 66 (52) million respectively. These fi gures were equivalent to<br />
levels of 9 (15)% and 9 (9)% respectively. The combined average default rate over the past three years<br />
was 2.3 (2.5)%. The accounts receivable from passive reinsurance business with arrears of more than<br />
90 days amounted to altogether EUR 325 (229) million, corresponding to a level of 41 (46)%. The annual<br />
default rate was 1.0 (1.5)%.<br />
Relative to the Non-Life Reinsurance and Life/Health Reinsurance segments, which are represented<br />
by the companies of the Hannover Re Group, EUR 149 (151) million – or 4.3 (5.2)% – of our accounts<br />
receivable from reinsurance business totaling EUR 3.5 (2.9) billion were older than 90 days as at the<br />
balance sheet date and in some cases impaired. The average default rate over the past three years<br />
was unchanged year-on-year at 0.2%.<br />
Of our total reinsurance recoverables, 31.7% were secured by deposits or letters of credit – a level virtually<br />
unchanged from the previous year. In the case of most of our retrocessionaires we also function<br />
as reinsurer, meaning that a potential normally exists for off setting against our own liabilities.<br />
Value adjustments were not taken on accounts receivable from insurance business insofar as the<br />
default risk associated with the assets is reduced by collateral (such as letters of credit, cash deposits,<br />
securities deposits).<br />
175
176 <strong>Talanx</strong> Group Financial report 2010<br />
The adjusted receivables can be broken down as follows:<br />
Analysis of individually adjusted<br />
fi nancial assets deriving from insurance<br />
contracts<br />
Figures in EUR million<br />
Risk provision Thereof 2010<br />
31.12.2010 31.12.2009<br />
Book value after<br />
risk provision Risk provision Thereof 2009<br />
Book value after<br />
risk provision<br />
Accounts receivable from <strong>policy</strong>holders<br />
Accounts receivable from insurance<br />
25 –8 796 33 –1 815<br />
intermediaries<br />
Accounts receivable from reinsurance<br />
21 –36 755 57 –20 613<br />
business 57 –52 3,460 110 –21 2,914<br />
Total 103 –96 5,011 200 –42 4,342<br />
In the year under review risk provision of EUR 52 million for accounts receivable from reinsurance<br />
business was released. This risk provision is no longer needed because in the previous year we<br />
signifi cantly reduced the remaining credit risks through the securitization of default risks resulting<br />
from reinsurance recoverables.<br />
The value adjustments on accounts receivable from insurance business that we recognize in separate<br />
adjustment accounts developed as follows in the year under review:<br />
Development of value adjustments on accounts<br />
receivable from insurance business<br />
Figures in EUR million<br />
2010 2009<br />
Cumulative value adjustments at 31.12. of the previous year 200 242<br />
Change in consolidated group — —<br />
Value adjustments in the fi nancial year 7 25<br />
Write-ups 91 63<br />
Allocation (+)/Release (–) — –3<br />
Exchange rate fl uctuations 3 –1<br />
Other changes –16 —<br />
Cumulative value adjustments at 31.12. of the year under review 103 200<br />
The default risks on fi nancial assets deriving from insurance contracts were determined on the<br />
basis of individual analyses. Any existing collateral was taken into account. The proportion of impaired<br />
receivables stood at 2 (5)%.<br />
Specifi cally, the annual impairment rates were as follows:<br />
Impairment rates<br />
%<br />
31.12.2010 31.12.2009 31.12.2008 31.12.2007<br />
Accounts receivable from <strong>policy</strong>holders 3.1 3.9 4.0 4.0<br />
Accounts receivable from insurance intermediaries 2.6 8.5 11.2 8.6<br />
Accounts receivable from reinsurance business 1.6 3.6 4.2 7.3
The annual default rates were as follows:<br />
Notes Nature of risks associated with insurance contracts and fi nancial instruments<br />
Default rates<br />
%<br />
31.12.2010 31.12.2009 31.12.2008 31.12.2007<br />
Accounts receivable from <strong>policy</strong>holders 1.6 1.8 4.2 2.1<br />
Accounts receivable from insurance intermediaries 1.1 2.2 2.7 1.8<br />
Accounts receivable from reinsurance business 0.2 0.2 0.1 0.3<br />
The net gains/losses on fi nancial instruments from insurance contracts were:<br />
Interest Interest Value<br />
2010<br />
Figures in EUR million<br />
income expense adjustment Write-ups Total<br />
Funds held by ceding companies 425 — — 2 427<br />
Funds held under reinsurance treaties<br />
Reinsurance recoverables on<br />
— 145 — — –145<br />
technical provisions — — –2 23 25<br />
Total 425 145 –2 25 307<br />
Interest Interest Value<br />
2009<br />
Figures in EUR million<br />
income expense adjustment Write-ups Total<br />
Funds held by ceding companies 447 — 1 3 449<br />
Funds held under reinsurance treaties<br />
Reinsurance recoverables on<br />
— 207 — — –207<br />
technical provisions — — 10 33 23<br />
Total 447 207 11 36 265<br />
Risks from investments<br />
The risks from investments principally encompass the market risk (includes the foreign currency<br />
risk, the risk associated with changes in fair value due to interest rate movements, the cash fl ow risk<br />
due to interest rate movements and the market price risk), the default risk and the liquidity risk.<br />
Management of risks from investments<br />
The structure of the investments under own management (excluding funds held by ceding companies)<br />
is regularly examined in order to review the strategic asset allocation. The breakdown for the<br />
Group as at 31 December 2010 was as follows:<br />
Parameter as<br />
per investment Position as at Position as at<br />
Weighting of major asset classes<br />
%<br />
guidelines 31.12.2010 31.12.2009<br />
Bonds (direct holdings and investment funds)<br />
Listed equities (direct holdings and<br />
At least 50 86 84<br />
investment funds) At most 25 2 3<br />
Real estate (direct holdings and investment funds) At most 5 2 2<br />
177
178 <strong>Talanx</strong> Group Financial report 2010<br />
In this regard it is evident that the bonds, equities and real estate are within the defi ned Group<br />
limits. In accordance with the company’s risk-carrying capacity and regulatory requirements, the<br />
investment goals of security, profi tability, liquidity as well as mix and spread are given adequately<br />
balanced consideration under our holistic asset/liability management systems. The main opposing<br />
risks are market risks, default risks and liquidity risks.<br />
Market risks<br />
The market risk consists primarily of the risk of changes in the market prices of fi xed-income assets<br />
and equities as well as the exchange rate risk associated with fl uctuations in exchange rates if there<br />
is no matching cover. This may necessitate value adjustments or lead to the realization of losses in<br />
the event of disposal of fi nancial assets. A decline in the interest rate level can also lead to reduced<br />
investment income.<br />
A vital tool used to monitor and manage market price risks is constant analysis of the value at risk<br />
(VaR), which is increasingly evolving from an assets-side measurement approach into an assets/<br />
liabilities concept. The VaR defi nes the estimated maximum loss that will not be exceeded within a<br />
set holding period (e.g. 10 days) and with a set probability (e.g. 95%).<br />
The VaR is established daily on the basis of historical data. Within the scope of these calculations<br />
the loss potentials of both the total portfolio and partial portfolios are monitored and limited. The<br />
calculation of this maximum loss potential is performed on the basis of a confi dence level of 95%<br />
and a holding period of ten days. This means that this estimated loss potential will be exceeded<br />
within 10 days with a probability of 5%.<br />
The daily updated holdings are fed into the calculation as input data. The scope of the market data<br />
history used for risk analysis is 181 weeks. On this basis, 180 weekly changes are calculated for each<br />
relevant market parameter, such as equity prices, exchange rates and interest rates, and these are<br />
then used to establish the value at risk. Market observations of the recent past are weighted more<br />
heavily through the use of a decay factor in order to refi ne the sensitivity of the VaR model to<br />
current volatility changes and hence improve the forecast quality. The time series on the basis of<br />
which the risk parameters are calculated are updated weekly. In this context, the market parameters<br />
of the oldest week are removed and replaced by those of the current week. The risk model is recalibrated<br />
on the basis of the updated market data.
Notes Nature of risks associated with insurance contracts and fi nancial instruments<br />
The risk model used is based on a multi-factor model. This multi-factor model is grounded on<br />
numerous representative time series, e.g. interest rates, exchange rates and stock indices. All riskrelevant<br />
factors can be determined from these time series using main component analysis. The<br />
correlations existing between the time series are incorporated into the weighting of the risk factors.<br />
In this way allowance is made in the risk assessment for cumulative and diversifi cation eff ects. The<br />
individual elements of the portfolio are analyzed through regression towards these factors. The factor<br />
weightings thereby determined create a correlation between the movements in the factors derived<br />
from the movements in the representative time series and the movements in the securities.<br />
The risks associated with securities are arrived at through simulation of the factor developments.<br />
The risk associated with options is arrived at through a comprehensive simulation. Consideration<br />
is thus given to the non-linear correlations between option prices and the price movements of the<br />
underlying instruments.<br />
Normal market scenarios are used to calculate the value at risk. In addition, stress tests are conducted<br />
in order to be able to map extreme scenarios. In this context, the loss potentials are simulated<br />
on the basis of already occurred or notional extreme events. Actual market developments may<br />
diverge from the model assumptions.<br />
The VaR (confi dence level of 95%, holding period of 10 days) as at 31 December 2010 amounted to<br />
EUR 1.1 billion, a fi gure equivalent to 1.6% of the assets under consideration.<br />
The range of management tools is complemented by stress tests and scenario analyses. In the case<br />
of interest-rate-sensitive products and equities, we calculate a possible change in fair value using a<br />
historic “worst case” scenario on a daily basis, estimating the potential loss under extreme market<br />
conditions. With the aid of scenarios we simulate changes in equity prices, exchange rates and<br />
yields on the basis of historical data. Interest rate risks refer to an unfavorable change in the value<br />
of fi nancial assets held in the portfolio due to changes in the market interest rate level. Declining<br />
market yields lead to increases and rising market yields to decreases in the fair value of fi xedincome<br />
securities portfolios. Share price risks derive from unfavorable changes in the value of<br />
equities and equity or index derivatives due, for example, to downward movements on particular<br />
stock indices. We spread these risks through systematic diversifi cation across various sectors and<br />
regions. Currency risks are of considerable importance to an internationally operating insurance<br />
enterprise that writes a signifi cant proportion of its business in foreign currencies.<br />
The following table shows scenarios for the development of investments held by the Group as at<br />
the balance sheet date. The amounts shown are gross amounts; in particular, the eff ects illustrated<br />
disregard taxes and the provision for premium refunds. Eff ects arising on the basis of the surplus<br />
participation of <strong>policy</strong>holders in life primary insurance thus do not form part of the analysis. Making<br />
allowance for these eff ects, the repercussions indicated for the results and shareholders’ equity<br />
would be considerably reduced.<br />
179
180 <strong>Talanx</strong> Group Financial report 2010<br />
Scenarios for changes in the fair value of assets held by the Group as at the balance sheet date:<br />
Recognized<br />
in the statement<br />
of<br />
Portfolio Scenario<br />
income 1)<br />
Recognized<br />
directly in<br />
equity 1)<br />
31.12.2010<br />
Portfolio<br />
change<br />
based on<br />
fair value 2)<br />
31.12.2009<br />
Portfolio<br />
change<br />
based on<br />
fair value 2)<br />
Figures in EUR<br />
million<br />
Equity securities 3) Share prices +20% +17 +345 +361 +347<br />
Share prices +10% +8 +173 +181 +170<br />
Share prices –10% –8 –184 –191 –166<br />
Share prices –20% –14 –367 –382 –320<br />
Fixed-income<br />
securities Yield increase +200 basis points –37 –2,149 –6,297 –5,613<br />
Yield increase +100 basis points –19 –1,122 –3,346 –2,977<br />
Yield decrease –100 basis points +19 +1,203 +3,456 +2,966<br />
Yield decrease –200 basis points +38 +2,501 +7,245 +6,202<br />
Exchange-ratesensitiveinvestments<br />
Change in<br />
exchange rates 4) +10% –1,614 –136 –1,750 –1,493<br />
thereof USD –894 –95 –989 –911<br />
thereof GBP –188 –6 –194 –164<br />
thereof AUD –150 — –150 –108<br />
thereof other<br />
Change in<br />
–381 –36 –418 –310<br />
exchange rates 4) –10% +1,614 +136 +1,750 +1,493<br />
thereof USD +894 +95 +989 +911<br />
thereof GBP +188 +6 +194 +164<br />
thereof AUD +150 — +150 +108<br />
thereof other +381 +36 +418 +310<br />
1) Amounts shown are gross (before taxes and surplus participation)<br />
2) Including fi nancial assets belonging to the categories “loans and receivables” and “held to maturity”<br />
3) Including derivative holdings<br />
4) Exchange-rate fl uctuations of +/–10% against the euro based on balance sheet values<br />
The breakdown of our investments by currency was as follows:<br />
Currency<br />
%<br />
31.12.2010 31.12.2009<br />
EUR 76 78<br />
USD 13 13<br />
GBP 3 2<br />
AUD 2 2<br />
Other 6 5<br />
Total 100 100
Notes Nature of risks associated with insurance contracts and fi nancial instruments<br />
We use short-call and long-put options as well as swaps to partially hedge portfolios, especially<br />
against price, exchange and interest rate risks. In the year under review we also used derivative<br />
fi nancial instruments to optimize our portfolio in light of risk/return considerations. The contracts<br />
are concluded solely with fi rst-class counterparties and compliance with the standards defi ned in<br />
the investment guidelines is strictly controlled in order to avoid risks – especially credit risks – associated<br />
with the use of such transactions. By systematically adhering to the principle of matching<br />
currency coverage, we are also able to signifi cantly reduce the foreign currency risk within the<br />
Group.<br />
Default risks<br />
The risks of counterparty default requiring monitoring consist of counterparty credit risks and issuer’s<br />
risks. Along with the lists of counterparties and issuers specifi ed by the Board of Management,<br />
monitoring of the limits defi ned per rating category constitutes a vital precondition for investment<br />
decisions. We pay close attention to the good credit status of counterparties and debtors in order to<br />
avoid default risks. Key indicators here are the ratings assigned by external agencies such as S&P or<br />
Moody’s. New investments are restricted to investment grade securities in order to limit the credit<br />
risk.<br />
The maximum default risk exposure on the balance sheet date, exclusive of collateral or other<br />
agreements that serve to minimize the default risk, was as follows:<br />
Measured at<br />
amortized cost<br />
Measured at<br />
fair value Total<br />
31.12.2010<br />
Figures in EUR million<br />
Investments in affi liated companies and participating<br />
interests 74 — 74<br />
Loans and receivables 32,343 — 32,343<br />
Financial assets held to maturity 2,999 — 2,999<br />
Financial assets available for sale<br />
Financial assets at fair value through profi t or loss<br />
— 30,635 30,635<br />
Financial assets classifi ed at fair value through<br />
profi t or loss — 989 989<br />
Financial assets held for trading — 232 232<br />
Other invested assets 114 4,071 4,185<br />
181
182 <strong>Talanx</strong> Group Financial report 2010<br />
Measured at<br />
amortized cost<br />
Measured at<br />
fair value Total<br />
31.12.2009<br />
Figures in EUR million<br />
Investments in affi liated companies and participating<br />
interests 61 — 61<br />
Loans and receivables 31,548 — 31,548<br />
Financial assets held to maturity 2,858 — 2,858<br />
Financial assets available for sale<br />
Financial assets at fair value through profi t or loss<br />
— 26,477 26,477<br />
Financial assets classifi ed at fair value through<br />
profi t or loss — 861 861<br />
Financial assets held for trading — 238 238<br />
Other invested assets 119 4,014 4,133<br />
Investments are serviced regularly by the debtors. Collateral exists above all with respect to covered<br />
bonds and asset-backed securities as well as mortgage loans secured by a charge over property.<br />
With the exception of the mortgage loans, the portfolio did not contain any overdue, unadjusted<br />
assets as at the balance sheet date since overdue securities are written down immediately. The<br />
mortgage loans show arrears totaling EUR 24 (22) million; this fi gure includes receivables overdue<br />
by more than 12 months of EUR 5 million. Since these receivables are adequately secured by charges<br />
over property, no value adjustment was taken. Under the contractual provisions, realization is<br />
possible only in the event of a failure to properly perform. The reader is referred to item 29 of the<br />
Notes, page 234, with regard to the impairments taken on investments in the year under review.<br />
The fi xed-income investments and loans (excluding other invested assets) are divided into the following<br />
debtor groups and corresponding ratings:<br />
Measured at Measured at<br />
31.12.2010<br />
Figures in EUR million<br />
amortized cost<br />
fair value Total<br />
EU member states 1,329 4,670 5,999<br />
Foreign governments 398 3,173 3,571<br />
Semi-governmental entities1) 9,563 5,369 14,932<br />
Corporations 7,771 10,126 17,897<br />
Covered bonds/asset-backed securities 14,499 5,054 19,553<br />
Mortgage loans 1,239 — 1,239<br />
Investment fund units — 666 666<br />
Other 543 314 857<br />
1) In the year under review this includes securities in amounts of EUR 2,305 million (measured at amortized cost) and<br />
EUR 3,039 million (measured at fair value) which are guaranteed by the Federal Republic of Germany, other EU states<br />
or German federal states.
Notes Nature of risks associated with insurance contracts and fi nancial instruments<br />
Measured at Measured at<br />
31.12.2009<br />
Figures in EUR million<br />
amortized cost<br />
fair value Total<br />
EU member states 1,193 3,866 5,059<br />
Foreign governments 368 2,763 3,131<br />
Semi-governmental entities1) 9,338 5,423 14,761<br />
Corporations 8,351 7,862 16,213<br />
Covered bonds/asset-backed securities 13,156 4,129 17,285<br />
Mortgage loans 1,383 — 1,383<br />
Investment fund units — 745 745<br />
Other 619 336 955<br />
1) In the year under review this includes securities in amounts of EUR 2,674 million (measured at amortized cost) and<br />
EUR 3,850 million (measured at fair value) which are guaranteed by the Federal Republic of Germany, other EU states<br />
or German federal states.<br />
More than 96 (95)% of the covered bonds/asset-backed securities were German covered bonds<br />
(Pfandbriefe) as at the balance sheet date.<br />
The rating structure of the fi xed-income investments (excluding other invested assets, <strong>policy</strong> loans<br />
and mortgage loans) were as follows:<br />
Rating<br />
Government<br />
bonds<br />
Securities issued<br />
by semi-governmental<br />
entities 1)<br />
Corporate<br />
bonds<br />
Covered bonds/<br />
asset-backed<br />
securities Other<br />
EUR<br />
EUR<br />
EUR<br />
EUR<br />
EUR<br />
% million % million % million % million % million<br />
AAA 74 7,077 36 5,308 2 321 79 15,526 23 310<br />
AA 5 519 58 8,721 25 4,556 17 3,273 2 27<br />
A 11 1,097 5 806 54 9,611 1 260 15 192<br />
BBB 7 646 1 90 17 2,971 1 136 29 383<br />
184 <strong>Talanx</strong> Group Financial report 2010<br />
Management of concentration risks<br />
A broad mix and spread of individual asset classes is observed in order to minimize the portfolio<br />
risk. The concentration risk is limited by the investment guidelines and constantly monitored;<br />
overall, it is comparatively slight, even though bank mergers – in particular – result in appreciable<br />
increases in concentrations. What is more, the extent to which investments may be made in more<br />
heavily risk-exposed assets is restricted.<br />
Overall, the measurement and monitoring mechanisms described here result in a prudent, broadly<br />
diversifi ed investment strategy. This is refl ected in the fact that within its portfolio of assets under<br />
own management the Group’s exposure to government bonds and securities issued by semigovernmental<br />
entities of the so-called PIIGS states amounts to altogether EUR 1.5 billion on a fair<br />
value basis; this corresponds to a proportion of 2%. The amortized costs and fair values of the bonds<br />
issued by the aff ected states as at the balance sheet date were as follows:<br />
thereof issuer country<br />
= investor country<br />
Issuer<br />
Figures in EUR million<br />
Amortized cost Fair value Amortized cost Fair value<br />
Portugal 77 70 — —<br />
Ireland 299 233 3 3<br />
Italy 466 455 329 322<br />
Greece 155 111 — —<br />
Spain 674 611 2 2<br />
Total 1,671 1,480 334 327<br />
No impairments had to be taken on these holdings. There is currently no risk of default here on<br />
account of bailout mechanisms existing on the European level (Eurozone safety net).<br />
Management of liquidity risks<br />
The liquidity risk refers to the risk of being unable to convert investments and other assets into<br />
cash in a timely manner in order to meet our fi nancial obligations when they become due. Due to<br />
illiquidity of the markets, it may not be possible to sell holdings (or to do so only aft er delays) or to<br />
close open positions (or to do so only with price markdowns). We counter the liquidity risk through<br />
regular liquidity planning and by matching the durations of investments with fi nancial obligations.<br />
A liquid asset structure ensures that at all times the Group is in a position to make the necessary<br />
payments. With regard to payment obligations in connection with underwriting business, we are<br />
guided inter alia by the expected maturities that refl ect the run-off patterns of the reserves.<br />
In order to monitor liquidity risks each category of security is assigned a liquidity code that indicates<br />
how quickly a security can be sold. These codes are regularly reviewed by Portfolio Management.<br />
The plausibility of changes is checked in Risk Controlling and the codes are modifi ed as<br />
appropriate. The data is then included in the standardized portfolio reporting to the Chief Financial<br />
Offi cers. Defi ned minimum and maximum limits for liquidity are observed. Oversteps of risk limits<br />
are brought to the attention of the Chief Financial Offi cers and Portfolio Management without<br />
delay.
Notes Nature of risks associated with insurance contracts and fi nancial instruments<br />
For a presentation of the investments and the gross provisions as well as the reinsurers’ shares<br />
thereof (broken down by their expected or contractual maturities), please see the notes on the<br />
corresponding balance sheet items.<br />
The following table shows the cash fl ows of the major net technical provisions (benefi t reserve, loss<br />
and loss adjustment expense reserve) and the fi nancial liabilities which are relevant to the management<br />
of liquidity risks. The technical provisions are broken down into the expected maturities, the<br />
liabilities into the contractual maturities:<br />
Carrying 3 months 1 through 5 through 10 through More than<br />
No<br />
2010<br />
Figures in EUR million<br />
amount to 1 year 5 years 10 years 20 years 20 years maturity<br />
Technical provisions 1) Financial liabilities<br />
77,778 12,277 19,434 13,099 12,289 7,161 6,744<br />
Subordinated liabilities 2,791 138 508 — 746 500 899<br />
Notes payable and loans 747 — 747 — — — —<br />
Other liabilities 2) thereof: liabilities from derivatives,<br />
4,858 495 211 13 3 12 2<br />
excluding hedging instruments 3) thereof: negative fair values from<br />
85 9 59 12 2 1 2<br />
hedging instruments 3) 149 — 149 — — — —<br />
Total 86,174 12,910 22,900 13,112 13,038 7,673 7,645<br />
2009 4)<br />
Carrying<br />
amount<br />
3 months<br />
to 1 year<br />
1 through<br />
5 years<br />
5 through<br />
10 years<br />
10 through<br />
20 years<br />
More than<br />
20 years<br />
No<br />
maturity<br />
Figures in EUR million<br />
Technical provisions 1) Financial liabilities<br />
73,531 11,134 18,599 12,210 11,893 6,932 6,242<br />
Subordinated liabilities 2,003 — — 524 746 138 595<br />
Notes payable and loans 675 2 673 — — — —<br />
Other liabilities 2) thereof: liabilities from derivatives,<br />
4,561 54 386 6 2 2 304<br />
excluding hedging instruments 3) thereof: negative fair values from<br />
30 3 16 6 — — 5<br />
hedging instruments 3) 42 8 34 — — — —<br />
Total 80,770 11,190 19,658 12,740 12,641 7,072 7,141<br />
1) Under the technical provisions only the benefi t reserves and loss reserves are split according to maturities. The provision for premium refunds encompasses the claims<br />
of <strong>policy</strong>holders under commercial law, to the extent that they have not already been fi nally allocated and paid to individual <strong>policy</strong>holders. Essentially, therefore,<br />
unambiguous allocation to the individual insurance contracts and maturities is not possible. The unearned premium reserve consists of the portion of gross written<br />
premium allocable to subsequent fi nancial year(s) as income for a particular period aft er the balance sheet date. The unearned premium reserve does not involve future<br />
liquidity-aff ecting cash fl ows<br />
2) Under the other liabilities the liabilities to <strong>policy</strong>holders and intermediaries as well as the reinsurance payable are not broken down by maturities, since these liabilities<br />
are directly connected with insurance contracts and hence cannot be considered in isolation fr om them<br />
3) The undiscounted cash fl ows with respect to such derivatives are not presented for reasons of materiality. Instead, the fair values of the derivative fi nancial instruments<br />
are stated<br />
4) Adjusted on the basis of IAS 8<br />
185
186 <strong>Talanx</strong> Group Financial report 2010<br />
The funds held under reinsurance treaties represent collateral withheld for technical provisions<br />
ceded to reinsurers and retrocessionaires and to this extent do not trigger any cash fl ows. The<br />
changes in funds held under reinsurance treaties are normally determined by changes in the corresponding<br />
ceded technical provisions. Such funds held under reinsurance treaties therefore have<br />
no contractually fi xed maturity; they are liquidated in step with the run-off of the corresponding<br />
provisions.<br />
In addition to the assets made available to cover provisions and liabilities, the Group has at its<br />
disposal the following lines of credit that can be drawn upon as required:<br />
The <strong>Talanx</strong> Group has concluded a fi rm agreement with a broad consortium of banks regarding an<br />
available fl oating-rate line of credit that may be drawn upon as necessary. As at the balance sheet<br />
date we had used a tranche amounting to altogether EUR 550 million. The nominal amount of the<br />
line of credit was EUR 1.5 billion as at the balance sheet date.<br />
In addition, facilities exist with various fi nancial institutions for letters of credit, including<br />
two unsecured syndicated guarantee facilities from 2005 and 2006. Following the contractual<br />
maturity of the fi rst half of the line from 2005 in January 2010, it amounted to an equivalent of<br />
EUR 0.8 (1.4) billion as at the balance sheet date. The second half of this line matures in January<br />
2012. The line from 2006, the amount of which as at the balance sheet date was equivalent to<br />
EUR 1.5 (1.4) billion, matures in January 2013.<br />
Letter of credit facilities with various terms and a total volume equivalent to EUR 1.3 (1.1) billion<br />
also exist on a bilateral basis with fi nancial institutions. For further information on the furnished<br />
letters of credit please see our remarks in the section of the Notes entitled “Other information”,<br />
subsection “Contingent liabilities and other fi nancial commitments”, pages 251 et seq.<br />
A long-term unsecured line of credit with a total volume equivalent to at most EUR 566 (523) million<br />
was concluded in December 2009. It is intended specifi cally for US life reinsurance business.<br />
A number of LOC facilities include standard market clauses that allow the banks rights of cancellation<br />
in the event of material changes in the shareholding structure of our Group company<br />
Hannover Re or trigger a requirement to furnish collateral upon materialization of major events,<br />
for example if its rating is signifi cantly downgraded.
Notes Nature of risks associated with insurance contracts and fi nancial instruments. Notes on the consolidated balance sheet – assets<br />
Notes on the consolidated balance sheet<br />
– assets<br />
(1) Goodwill<br />
2010 2009<br />
Figures in EUR million<br />
Gross book value at 31.12. of the previous year 741 677<br />
Currency translation at 01.01. of the year under review<br />
Gross book value after currency translation at 01.01.<br />
13 20<br />
of the year under review 754 697<br />
Change in consolidated group — 15<br />
Additions — 28<br />
Currency exchange rate diff erences — 1<br />
Gross book value at 31.12. of the year under review 754 741<br />
Accumulated depreciation and accumulated impairment losses<br />
at 31.12. of the previous year 148 56<br />
Currency translation at 01.01. of the year under review<br />
Accumulated depreciation and accumulated impairment losses after<br />
— —<br />
currency translation at 01.01. of the year under review 148 56<br />
Impairments<br />
Accumulated deprecation and accumulated impairment losses<br />
17 92<br />
at 31.12. of the year under review 165 148<br />
Balance at 31.12. of the previous year 593 621<br />
Balance at 31.12. of the year under review 589 593<br />
The recognized goodwill derived mainly from the acquisition of HDI Seguros de Automóveis e Bens<br />
S. A., Brazil, in 2005, the purchase of the former Gerling Group by <strong>Talanx</strong> AG in 2006, the increase<br />
of the interest held by the Group in PB Versicherungen to 100% in 2007 and the purchase of 100%<br />
stakes in PBV Lebensversicherung AG (previously: BHW Lebensversicherung AG) and PB Pensionskasse<br />
AG (previously: BHW Pensionskasse AG) (both also 2007).<br />
The decrease in goodwill to EUR 589 million was attributable to impairments of EUR 17 million<br />
taken in the year under review in the Retail International segment in connection with impairment<br />
tests (see our explanatory remarks in the following subsection).<br />
187
188 <strong>Talanx</strong> Group Financial report 2010<br />
Impairment test<br />
Goodwill is allocated to cash-generating units (CGUs) pursuant to IFRS 3 in conjunction with IAS 36.<br />
It is allocated to those CGUs which are expected to generate a value in use (in the form of cash fl ows)<br />
as a result of the business combination that gave rise to the goodwill. Each CGU to which goodwill<br />
is allocated should represent the lowest entity level on which goodwill is monitored for internal<br />
management purposes.<br />
In 2010 we adjusted the grouping of assets for the purposes of identifying cash-generating units<br />
in line with the structural changes in the Group’s primary insurance sector, which also aff ected the<br />
previous confi guration of the CGUs. Until the end of 2009 the individual CGUs were defi ned according<br />
to the responsibilities on the holding company’s Board of Management and the internal reporting<br />
at that time and hence essentially according to the former defi nition of the business segments<br />
within the meaning of IAS 8. The impairment test in the previous year was therefore performed for<br />
the last time on the basis of the CGUs Property/Casualty Primary Insurance, the group of companies<br />
combined under the former HDI-Gerling Leben Serviceholding AG, the bancassurance group<br />
and the two CGUs Non-Life Reinsurance and Life/Health Reinsurance.<br />
With eff ect from 2010 onwards the Group is managing and reporting both internally and externally<br />
according to the new Group structure. Since then, the Group has reorganized its insurance activities<br />
in primary insurance in conformity with a change in the responsibilities of the members of the<br />
Board of Management (compare here our remarks in the section “Accounting policies”, subsection<br />
“Change in segment reporting”, page 121 and the section “Segment reporting” on page 144). The two<br />
existing primary insurance segments of Property/Casualty Primary Insurance and Life Primary<br />
Insurance were transformed across lines into the three reportable segments of Industrial Lines,<br />
Retail Germany and Retail International. For the purpose of identifying CGUs in primary insurance,<br />
this reorganization means that the segments of Industrial Lines and Retail Germany, which<br />
also satisfy the defi nition of an operating segment pursuant to IAS 8, each constitute a CGU. In the<br />
Retail International segment each foreign market constitutes a separate CGU. In this segment crosscompany<br />
synergistic potentials (in relation to cash fl ows) can only be realized in those countries<br />
in which we are represented by several companies. In terms of their products and sales structures,<br />
the individual foreign units otherwise operate largely self-suffi ciently. The CGUs of the Group are<br />
therefore as follows:<br />
■ Industrial Lines business segment<br />
■ Retail Germany business segment<br />
■ Non-Life Reinsurance business segment<br />
■ Life/Health Reinsurance business segment<br />
The CGUs of the Retail International segment are as follows:<br />
■ Brazil<br />
■ Poland<br />
■ Mexico<br />
■ Chile
Notes Notes on the consolidated balance sheet – assets<br />
On account of the internal Group restructuring activities, the goodwill can be broken down as<br />
follows according to the revised allocation set out in the segment reporting:<br />
Retail<br />
International<br />
Non-Life<br />
Reinsurance<br />
Corporate<br />
Operations Total<br />
Industrial Lines Retail Germany<br />
Figures in EUR million<br />
Balance at 31.12.2008 89 415 106 8 3 621<br />
Currency translation at 01.01.2009<br />
Balance after currency translation at<br />
— — 20 — — 20<br />
01.01.2009 89 415 126 8 3 641<br />
Change in consolidated group — — 15 — — 15<br />
Additions — 28 — — — 28<br />
Impairments 29 46 14 — 3 92<br />
Currency exchange rate diff erences — — 1 — — 1<br />
Balance at 31.12.2009 60 397 128 8 — 593<br />
Currency translation at 01.01.2010<br />
Balance after currency translation at<br />
— — 13 — — 13<br />
01.01.2010 60 397 141 8 — 606<br />
Impairments — — 17 — — 17<br />
Balance at 31.12.2010 60 397 124 8 — 589<br />
In order to establish whether an impairment expense needs to be recognized, the carrying value of<br />
the CGU including its allocated goodwill is compared with its recoverable amount. The recoverable<br />
amount is the higher of the fair value less costs to sell and the value in use. For all CGUs with the exception<br />
of the two reinsurance segments, the recoverable amount is established on the basis of the<br />
value in use – which is calculated by the Group using a recognized measurement method, namely<br />
the discounted cash fl ow method. Insofar as CGUs are composed of more than one Group company,<br />
a sum-of-the-parts approach is used.<br />
189
190 <strong>Talanx</strong> Group Financial report 2010<br />
When it comes to measuring the value of the property/casualty insurers in the CGUs of Industrial<br />
Lines, Retail Germany and Retail International, the point of departure for establishing the present<br />
value of future cash fl ows consists of planned income statements. The planning calculations are<br />
drawn up on a stand-alone basis assuming that the entity will continue with a generally unchanged<br />
concept; they record the post-tax net income of the fi ve subsequent years as well as an extrapolation<br />
of the sixth year as a perpetuity factor. Entity-specifi c approximations are made in the detailed<br />
planning (at the time of the planning). In particular, the possibilities for growth in the market environment<br />
as well as profi tability according to the claims and cost trend are estimated in the context<br />
of planned measures on the company level. Investment income is projected in relation to the specifi<br />
c asset portfolio. The planning calculations on which measurement is based are approved by the<br />
management of the companies concerned. The discount factor (capitalization rate) for the Group<br />
companies consists of a risk-free basic interest rate, country-specifi c yield curves, a market risk premium<br />
and an individual company beta factor (calculated on the basis of the Capital Asset Pricing<br />
Model). What is more, in order to extrapolate the cash fl ows beyond the period of the detailed planning<br />
we also use – on the basis of conservative assumptions – constant growth rates. The fi gures are<br />
arrived at from past experience and future expectations and do not exceed the long-term average<br />
growth rates for the various markets in which the entities operate. Present values determined in<br />
local currency are translated at the exchange rate on the balance sheet date.<br />
The current capitalization rate and the long-term growth rate are listed below for the property/<br />
casualty insurers of the CGUs:<br />
Capitalization rate<br />
Long-term<br />
growth rate<br />
CGU<br />
Industrial Lines<br />
in %<br />
in %<br />
German-speaking countries 8.0–8.5 0.2–0.5<br />
Other countries (EU only) 8.5–9.0 0.25–0.5<br />
Retail Germany 8.0 0.5–1.0<br />
Retail International<br />
Brazil 13.0 1.0<br />
Poland 10.3 1.3<br />
Mexico 12.6 0.6<br />
Chile 11.25 0.25
Notes Notes on the consolidated balance sheet – assets<br />
Calculations of the Market Consistent Embedded Value (MCEV) form the basis for valuation of the<br />
life insurers. The value of the entity in terms of an appraisal value (MCEV allowing for the expected<br />
new business) is regularly determined with the aid of an average market multiple (1.02) weighted<br />
for up-to-dateness, which measures the ratio of appraisal value to embedded value and is based<br />
on market data. The plausibility of the multiple is regularly checked using the New Business Value<br />
(NBV).<br />
A variant of the method normally applicable to life insurers exists for companies with long-term<br />
exclusive cooperation agreements and the associated stability in their new business. These companies<br />
are valued using a simplifi ed appraisal value method, in which the present value of the perpetuity<br />
factor for the New Business Value is added to the current MCEV forecast. Sales agreements<br />
that end at short notice may necessitate separate evaluation. The capitalization rates in the Retail<br />
Germany segment are 8.0%.<br />
Small insurers and non-insurance companies are recognized either at the present value of future<br />
cash fl ows or with their shareholders’ equity.<br />
For the CGUs of Non-Life Reinsurance and Life/Health Reinsurance, which together correspond to<br />
the Hannover Re Group, reference is made to the market price of the Hannover Re share as the fi rst<br />
step for the purposes of the impairment test. The stock market value of Hannover Re is divided<br />
between the two segments – which are synonymous with the two CGUs – on the basis of the average<br />
net return on premium over the past three years. The recoverable amount determined in this<br />
way is compared with the carrying value including the goodwill allocated to the CGU in question.<br />
Alternatively, should the stock market price of the Hannover Re share be signifi cantly adversely<br />
aff ected on a balance sheet date by factors that do not refl ect the sustainable profi t potential of the<br />
Hannover Re Group, a method based on the present value of future cash fl ows may be used instead.<br />
On the basis of the impairment test carried out as at 30 September 2010, the goodwill of the CGU<br />
Mexico (EUR 17 million) was entirely written off . The positive expectations as to the future development<br />
of the company’s business were revised downwards. The Mexican economy continues to<br />
struggle with the repercussions of the fi nancial crisis – the domestic part of the economy even<br />
more so than that which is driven by exports. Furthermore, the anticipated results in the coming<br />
years will be increasingly strained by the investments made to put in place the foundation for generating<br />
successful growth in the Mexican market going forward. The primary focus here is on the<br />
opening of new offi ces, the modernization of IT and the appointment of new staff as well as skills<br />
enhancement of the existing workforce.<br />
No further impairment expenses needed to be recognized.<br />
191
192 <strong>Talanx</strong> Group Financial report 2010<br />
(2) Other intangible assets<br />
Insurance-related<br />
intangible assets<br />
Software<br />
Purchased Created Other 2009 1)<br />
2010<br />
Figures in EUR million<br />
Gross book value at 31.12.<br />
of the previous year<br />
Adjustment of values carried<br />
2,785 357 110 42 3,294 3,162<br />
forward from prior years 2) Gross book value at 01.01.<br />
— –89 5 –3 –87 —<br />
of the year under review 2,785 268 115 39 3,207 3,162<br />
Change in consolidated group — — — — — 4<br />
Additions — 29 8 33 70 193<br />
Disposals — 5 1 18 24 66<br />
Reclassifi cation — 11 — — 11 —<br />
Other changes 6 — — — 6 1<br />
Currency exchange rate diff erences<br />
Gross book value at 31.12.<br />
1 2 — 2 5 —<br />
of the year under review 2,792 305 122 56 3,275 3,294<br />
Accumulated depreciation and<br />
accumulated impairment losses<br />
at 31.12. of the previous year<br />
Adjustment of values carried<br />
806 262 57 15 1,140 845<br />
forward from prior years 2) Accumulated depreciation and<br />
accumulated impairment losses<br />
— –89 5 –3 –87 —<br />
at 01.01. of the year under review 806 173 62 12 1,053 845<br />
Change in consolidated group — — — — — 1<br />
Additions — — — — — 3<br />
Disposals<br />
Depreciation/amortization<br />
— 3 — 2 5 33<br />
Scheduled 318 34 9 5 366 245<br />
Unscheduled — — — — — 78<br />
Reclassifi cation — 8 — — 8 2<br />
Other changes — — — — — 1<br />
Currency exchange rate diff erences<br />
Accumulated depreciation and<br />
accumulated impairment losses<br />
— 1 — 1 2 –2<br />
at 31.12. of the year under review 1,124 213 71 16 1,424 1,140<br />
Balance at 31.12. of the previous year 1) Balance at 31.12. of the year<br />
1,979 95 53 27 2,154 2,317<br />
under review 1,668 92 51 40 1,851 2,154<br />
1) Adjusted on the basis of IAS 8<br />
2) The values carried forward were adjusted in connection with implementation of a new IT system; there were no implications for the carrying value<br />
The “insurance-related intangible assets” derived principally from the insurance portfolios of the<br />
former Gerling Group acquired in 2006 (carrying value 2010: EUR 1.1 billion) and the portfolios<br />
of BHW Lebensversicherung AG (carrying value 2010: EUR 280 million) and PB Lebensversicherung<br />
AG (carrying value 2010: EUR 56 million) purchased in 2007 as well as from Neue Leben<br />
Lebensversiche rung AG (carrying value 2010: EUR 100 million).
Notes Notes on the consolidated balance sheet – assets<br />
The addition of EUR 193 million recognized in the gross book value of the previous year relates – in<br />
an amount of EUR 104 million – to the present value of future profi ts (PVFP) carried in connection<br />
with Hannover Re’s acquisition of the ING life reinsurance portfolio. Scheduled amortization is<br />
taken on this insurance-related intangible asset over the term of the underlying reinsurance treaties<br />
in proportion to the future premium income. The period of amortization is 30 years.<br />
Particularly due to scheduled depreciation and amortization, the insurance-related intangible<br />
assets decreased by EUR 311 million in the reporting period to EUR 1,668 million. Insofar as PVFPs<br />
are involved in the case of life insurance enterprises, these are capitalized and amortized across the<br />
period of the contracts (see also our remarks in the section “Accounting policies”, subsection “Summary<br />
of major accounting policies”, on page 127).<br />
The gross PVFP recognized is composed of a shareholders’ portion – on which deferred taxes are<br />
established – and a <strong>policy</strong>holders’ portion. It is capitalized in order to spread the charge to Group<br />
shareholders’ equity under IFRS upon acquisition of an insurance portfolio equally across future<br />
periods in step with the amortization. Only the amortization of the shareholders’ portion results<br />
in a charge to future earnings. The PVFP in favor of <strong>policy</strong>holders is recognized by life insurance<br />
companies that are obliged to enable their <strong>policy</strong>holders to participate in all results through the<br />
establishment of a provision for deferred premium refunds.<br />
The breakdown of the PVFPs for the life insurance companies is shown in the table below:<br />
PVFPs for life insurance companies 31.12.2010 31.12.2009 1)<br />
Figures in EUR million<br />
Shareholders’ portion 720 861<br />
Policyholders’ portion 850 1,016<br />
Balance 1,570 1,877<br />
1) Adjusted on the basis of IAS 8<br />
Of the depreciation/amortization on insurance-related intangible assets totaling EUR 318 million,<br />
an amount of EUR 152 million was attributable to the shareholders’ portion and EUR 166 million to<br />
the <strong>policy</strong>holders’ portion. The amortization on the shareholders’ portion is recognized in the statement<br />
of income in the item “Other technical expenses”.<br />
193
194 <strong>Talanx</strong> Group Financial report 2010<br />
(3) Investment property<br />
2010 2009<br />
Figures in EUR million<br />
Gross book value at 31.12. of the previous year 1,069 898<br />
Adjustment of values carried forward from prior years 1) –185 —<br />
Gross book value at 01.01. of the year under review 884 898<br />
Additions 149 164<br />
Disposals 32 23<br />
Disposal groups pursuant to IFRS 5 — 34<br />
Reclassifi cation 29 1<br />
Other changes 1) — –1<br />
Currency exchange rate diff erences 12 –4<br />
Gross book value at 31.12. of the year under review 1,042 1,069<br />
Accumulated depreciation and accumulated impairment losses<br />
at 31.12. of the previous year 343 314<br />
Adjustment of values carried forward from prior years 1) Accumulated depreciation and accumulated impairment losses<br />
–185 —<br />
at 01.01. of the year under review 158 314<br />
Disposals<br />
Depreciation/impairment<br />
4 3<br />
Scheduled 15 9<br />
Unscheduled 6 8<br />
Disposal groups pursuant to IFRS 5 — 5<br />
Reclassifi cation 7 3<br />
Other changes 1) Accumulated depreciation and accumulated impairment losses<br />
— 7<br />
at 31.12. of the year under review 182 343<br />
Balance at 31.12. of the previous year 726 584<br />
Balance at 31.12. of the year under review 860 726<br />
1) The values carried forward were adjusted in connection with implementation of a new IT system;<br />
there were no implications for the carrying value<br />
The additions of EUR 149 million relate principally to the Non-Life Reinsurance segment<br />
(EUR 136 million) and are attributable inter alia to the sharply increased investment activities<br />
of Hannover Re Real Estate Holdings, Inc., and Hannover Re Euro RE Holdings GmbH. A further<br />
EUR 8 million was due to the Retail Germany segment.<br />
The fair value of investment property amounted to EUR 901 (790) million as at the balance sheet<br />
date. The fair values were determined largely internally within the Group using discounted cash<br />
fl ow methods and in individual cases on the basis of external expert opinions. The directly allocable<br />
operating expenses (including repairs and maintenance) totaled EUR 24 million with respect<br />
to properties rented out; operating expenses of EUR 2 million were incurred on properties with<br />
which no rental income was generated.<br />
Of the total investment property, EUR 387 (415) million was allocated to special cover funds.
(4) Investments in affi liated companies<br />
and participating interests<br />
Notes Notes on the consolidated balance sheet – assets<br />
2010 2009<br />
Figures in EUR million<br />
Affi liated companies 13 13<br />
Participating interests 61 48<br />
Balance at 31.12. of the year under review 74 61<br />
Associated companies that are not recognized at equity owing to their subordinate importance for<br />
the presentation of the net assets, fi nancial position and results of operations are recognized under<br />
participating interests (see also our remarks in the section “Accounting policies”, subsection “Summary<br />
of major accounting policies”, pages 127 et seq.). For these associated companies not valued<br />
at equity we have recognized assets of EUR 52 million, debts of EUR 21 million, profi ts for the year of<br />
EUR 0.2 million and revenues of EUR 9 million.<br />
(5) Investments in associated companies<br />
2010 2009<br />
Figures in EUR million<br />
Balance at 31.12. of the previous year 134 135<br />
Change in consolidated group 14 —<br />
Additions — 4<br />
Disposals 2 —<br />
Adjustment recognized in income — –6<br />
Adjustment recognized outside income –2 —<br />
Currency exchange rate diff erences — 1<br />
Balance at 31.12. of the year under review 144 134<br />
The change in the consolidated group (EUR 14 million) was largely attributable to the acquisition of<br />
a stake in the listed funds provider C-QUADRAT Investment AG, Vienna. The company is recognized<br />
in the Corporate Operations segment.<br />
The goodwill of all associated companies valued at equity amounted to EUR 24 (20) million as<br />
at year-end. Of the associated companies, Apulia Prontoprestito S.p.A., Rome, and C-QUADRAT<br />
Investment AG, Vienna, are publically listed. The market price of our interests was EUR 32 (11) million<br />
as at the balance sheet date.<br />
For all associated companies combined we recognized assets of EUR 2.3 billion, debts of EUR 1.8 billion,<br />
profi ts for the year of EUR 26 million and revenues of EUR 360 million.<br />
For further information on our associated companies please see the section “Consolidation” on<br />
pages 161 et seq. as well as the subsection “List of shareholdings” on pages 256 et seqq.<br />
195
196 <strong>Talanx</strong> Group Financial report 2010<br />
(6) Loans and receivables<br />
Amortized cost<br />
Unrealized<br />
gains/losses Fair value<br />
31.12.2010 31.12.2009 31.12.2010 31.12.2009 31.12.2010 31.12.2009<br />
Figures in EUR million<br />
Mortgage loans<br />
Loans and prepayments<br />
1,239 1,383 106 3 1,345 1,386<br />
on insurance policies<br />
Loans and receivables<br />
due from governmental<br />
or semi-governmental<br />
200 201 — — 200 201<br />
entities 1) 9,728 9,454 304 262 10,032 9,716<br />
Corporate securities<br />
Covered bonds, asset-<br />
7,342 7,930 97 104 7,439 8,034<br />
backed securities 13,491 12,163 341 312 13,832 12,475<br />
Participation rights 343 417 –6 –14 337 403<br />
Total 32,343 31,548 842 667 33,185 32,215<br />
1) The loans and receivables due fr om governmental or semi-governmental entities include securities of EUR 2,114 (2,310) million<br />
which are guaranteed by the Federal Republic of Germany, other EU states or German federal states.<br />
The item “Covered bonds, asset-backed securities” includes German covered bonds (Pfandbriefe)<br />
with a carrying amount of EUR 13,464 (11,869) million (99 (98)%).<br />
Amortized cost Fair value<br />
Contractual maturity<br />
Figures in EUR million<br />
31.12.2010 31.12.2009 31.12.2010 31.12.2009<br />
Due in one year 1,290 2,049 1,306 2,063<br />
Due after one through two years 1,380 1,146 1,422 1,181<br />
Due after two through three years 1,601 1,352 1,612 1,415<br />
Due after three through four years 3,046 1,501 3,081 1,557<br />
Due after four through fi ve years 2,986 2,740 3,107 2,805<br />
Due after fi ve through ten years 9,252 11,344 9,553 11,666<br />
Due after ten years 12,788 11,416 13,104 11,528<br />
Total 32,343 31,548 33,185 32,215
Notes Notes on the consolidated balance sheet – assets<br />
Amortized cost<br />
Rating structure of loans and receivables<br />
Figures in EUR million<br />
31.12.2010 31.12.2009<br />
AAA 13,553 12,297<br />
AA 11,780 11,513<br />
A 4,521 4,699<br />
BBB or lower 2,489 3,039<br />
Total 32,343 31,548<br />
The rating categories are based on the classifi cations of leading international rating agencies.<br />
The rating category of “BBB or lower” includes unrated loans and receivables of EUR 1.5 (1.5) billion.<br />
They consist principally of mortgage loans and <strong>policy</strong> loans.<br />
(7) Financial assets held to maturity<br />
Amortized cost<br />
Unrealized<br />
gains/losses Fair value<br />
31.12.2010 31.12.2009 31.12.2010 31.12.2009 31.12.2010 31.12.2009<br />
Figures in EUR million<br />
Government debt securities<br />
of EU member states 438 378 13 — 451 378<br />
US Treasury Notes<br />
Other foreign government<br />
386 355 45 35 431 390<br />
debt securities<br />
Debt securities issued by<br />
11 14 1 1 12 15<br />
semi-governmental entities 1) 726 698 34 28 760 726<br />
Corporate securities<br />
Mortgage bonds,<br />
429 421 18 21 447 442<br />
asset-backed securities 1,009 992 44 46 1,053 1,038<br />
Total 2,999 2,858 155 131 3,154 2,989<br />
1) The debt securities issued by semi-governmental entities include securities of EUR 191 (364) million which are guaranteed<br />
by the Federal Republic of Germany, other EU states or German federal states<br />
The item “Mortgage bonds, asset-backed securities” includes covered bonds with a carrying amount<br />
of EUR 998 (962) million (99 (97)%).<br />
197
198 <strong>Talanx</strong> Group Financial report 2010<br />
Amortized cost Fair value<br />
Contractual maturity<br />
Figures in EUR million<br />
31.12.2010 31.12.2009 31.12.2010 31.12.2009<br />
Due in one year 344 108 347 119<br />
Due after one through two years 483 281 499 291<br />
Due after two through three years 377 470 396 492<br />
Due after three through four years 404 367 437 383<br />
Due after four through fi ve years 857 300 911 318<br />
Due after fi ve through ten years 480 1,287 512 1,344<br />
Due after ten years 54 45 52 42<br />
Total 2,999 2,858 3,154 2,989<br />
Amortized cost<br />
Rating structure of fi nancial assets held to maturity<br />
Figures in EUR million<br />
31.12.2010 31.12.2009<br />
AAA 1,731 1,776<br />
AA 728 582<br />
A 407 368<br />
BBB or lower 133 132<br />
Total 2,999 2,858<br />
The rating categories are based on the classifi cations of leading international rating agencies.<br />
The rating category of “BBB or lower” includes unrated fi xed-income securities of EUR 8 (8) million.
(8) Financial assets available for sale<br />
Notes Notes on the consolidated balance sheet – assets<br />
Amortized cost<br />
Unrealized<br />
gains/losses Fair value<br />
31.12.2010 31.12.2009 31.12.2010 31.12.2009 31.12.2010 31.12.2009<br />
Figures in EUR million<br />
Fixed-income securities<br />
Government debt securities<br />
of EU member states 4,719 3,771 –65 68 4,654 3,839<br />
US Treasury Notes<br />
Other foreign government<br />
2,059 2,020 66 15 2,125 2,035<br />
debt securities<br />
Debt securities issued by<br />
950 612 14 3 964 615<br />
semi-governmental entities 1) 5,165 5,214 98 111 5,263 5,325<br />
Corporate securities 9,538 7,357 115 194 9,653 7,551<br />
Investment funds<br />
Mortgage bonds,<br />
640 716 –3 14 637 730<br />
asset-backed securities 4,742 3,811 80 91 4,822 3,902<br />
Participation rights 210 227 2 2 212 229<br />
Total fi xed-income securities 28,023 23,728 307 498 28,330 24,226<br />
Variable-yield securities<br />
Equities 926 743 250 299 1,176 1,042<br />
Investment funds 1,035 1,124 58 49 1,093 1,173<br />
Participation rights 36 35 — 1 36 36<br />
Other — — — — — —<br />
Total variable-yield securities 1,997 1,902 308 349 2,305 2,251<br />
Total securities 30,020 25,630 615 847 30,635 26,477<br />
1) The debt securities issued by semi-governmental entities include securities of EUR 3,039 (3,850) million<br />
which are guaranteed by the Federal Republic of Germany, other EU states or German federal states<br />
The item “Mortgage bonds, asset-backed securities” includes covered bonds with a carrying amount<br />
of EUR 4,220 (3,331) million (88 (85)%).<br />
199
200 <strong>Talanx</strong> Group Financial report 2010<br />
Fair value Amortized cost<br />
Contractual maturity of fi xed-income securities<br />
Figures in EUR million<br />
31.12.2010 31.12.2009 31.12.2010 31.12.2009<br />
Due in one year 3,516 3,711 3,498 3,663<br />
Due after one through two years 3,512 3,108 3,468 3,044<br />
Due after two through three years 3,489 3,003 3,396 2,924<br />
Due after three through four years 3,725 3,286 3,644 3,155<br />
Due after four through fi ve years 3,726 3,291 3,708 3,209<br />
Due after fi ve through ten years 6,987 5,814 7,000 5,726<br />
Due after ten years 3,375 2,013 3,309 2,007<br />
Total 28,330 24,226 28,023 23,728<br />
Rating structure of fi xed-income securities<br />
Figures in EUR million<br />
Fair value<br />
31.12.2010 31.12.2009<br />
AAA 13,186 11,562<br />
AA 4,514 4,550<br />
A 6,924 5,224<br />
BBB or lower 3,706 2,890<br />
Total 28,330 24,226<br />
The rating categories are based on the classifi cations of leading international rating agencies.<br />
The rating category of “BBB or lower” includes unrated fi xed-income securities of EUR 309 (80) million.
Notes Notes on the consolidated balance sheet – assets<br />
(9) Financial assets at fair value through profi t or loss<br />
Fair value<br />
31.12.2010 31.12.2009<br />
Figures in EUR million<br />
Fixed-income securities<br />
Government debt securities of EU member states 14 26<br />
Other foreign government debt securities 34 59<br />
Debt securities issued by semi-governmental entities 97 95<br />
Corporate securities 467 305<br />
Investment funds 30 15<br />
Covered bonds/asset-backed securities 230 227<br />
Participation rights 102 107<br />
Total fi xed-income securities 974 834<br />
Investment funds (variable-yield securities) 15 18<br />
Other variable-yield securities<br />
Total fi nancial assets classifi ed at<br />
— 9<br />
fair value through profi t or loss 989 861<br />
Fixed-income securities<br />
Government debt securities of EU member states 3 2<br />
Other foreign government debt securities 49 53<br />
Debt securities issued by semi-governmental entities 9 3<br />
Corporate securities 7 6<br />
Other securities 1 —<br />
Total fi xed-income securities 69 64<br />
Investment funds (variable-yield securities) 83 62<br />
Derivatives 80 112<br />
Total fi nancial assets held for trading 232 238<br />
Total securities 1,221 1,099<br />
The item “Covered bonds/asset-backed securities” includes German covered bonds (Pfandbriefe)<br />
with a carrying amount of EUR 121 (126) million (53 (56)%).<br />
201
202 <strong>Talanx</strong> Group Financial report 2010<br />
Fair value<br />
Contractual maturity of fi xed-income securities<br />
Figures in EUR million<br />
31.12.2010 31.12.2009<br />
Due in one year 481 191<br />
Due after one through two years 73 336<br />
Due after two through three years 116 40<br />
Due after three through four years 45 49<br />
Due after four through fi ve years 3 43<br />
Due after fi ve through ten years 41 26<br />
Due after ten years 284 213<br />
Total 1,043 898<br />
Fair value<br />
Rating structure of fi xed-income securities<br />
Figures in EUR million<br />
31.12.2010 31.12.2009<br />
AAA 154 256<br />
AA 72 87<br />
A 115 215<br />
BBB or lower 702 340<br />
Total 1,043 898<br />
The rating categories are based on the classifi cations of leading international rating agencies.<br />
The rating category of “BBB or lower” includes unrated fi xed-income securities of EUR 194 (13) million.<br />
The fi nancial assets classifi ed at fair value through profi t or loss (with no trading intention) include<br />
inter alia structured products, in respect of which the fair value option aff orded by IAS 39 was exercised.<br />
The carrying amount of these fi nancial assets constitutes – contrary to the purely economic<br />
perspective – the maximum credit exposure. The amount of the change in fair value attributable<br />
to changes in the credit risk of fi nancial assets is –EUR 12 million in the reporting period and<br />
EUR 8 million on an accumulated basis. There are no credit derivatives or similar hedging instruments<br />
for these securities.
(10) Other invested assets<br />
(11) Fair value hierarchy<br />
Fair value hierarchy<br />
Notes Notes on the consolidated balance sheet – assets<br />
The other invested assets of altogether EUR 4.2 (4.1) billion are composed principally of the following<br />
items:<br />
■ participating interests in partnerships<br />
■ loans to affi liated companies<br />
■ short-term investments<br />
The participating interests in partnerships relate principally to participating interests in private<br />
equity fi rms and are allocated to the “available for sale” category. The fair value (carrying amount)<br />
of these participating interests was EUR 1,017 (695) million as at the balance sheet date. The amortized<br />
cost of the participations amounted to EUR 722 (578) million; in addition, unrealized gains<br />
of EUR 298 (126) million and unrealized losses of EUR 3 (9) million from these investments were<br />
recognized directly in equity via the other income/expenses (item: “Other reserves”).<br />
The loans to affi liated companies were measured largely at amortized cost. The carrying amount as<br />
at the balance sheet date was EUR 114 (117) million.<br />
The short-term investments recognized consist predominantly of overnight money, time deposits<br />
and money market securities with a maturity of up to one year in an amount of EUR 3,037 (3,302)<br />
million, which were generally measured outside income at fair value. The amortized cost of these<br />
fi nancial assets was EUR 3,034 (3,300) million; unrealized gains of EUR 3 (2) million were recognized<br />
outside income. The short-term investments are categorized within the Group as “fi nancial assets<br />
available for sale”.<br />
For the purposes of the disclosure requirements pursuant to IFRS 7 “Financial Instruments: Disclosures”,<br />
the fi nancial instruments to be recognized at fair value in the balance sheet are to be<br />
assigned to a three-level fair value hierarchy. The purpose of this new requirement, inter alia, is to<br />
set out the market proximity of the data included in the determination of fair values. The following<br />
classes of fi nancial instruments are aff ected: fi nancial assets available for sale, fi nancial assets at<br />
fair value through profi t or loss, other fi nancial assets – insofar as they are recognized at fair value,<br />
negative fair values from derivative fi nancial instruments (included in the balance sheet item<br />
“Other liabilities”) as well as hedging instruments (derivatives in the context of hedge accounting).<br />
Breakdown of fi nancial assets measured at fair value<br />
The fi nancial assets recognized at fair value were allocated as follows as at the balance sheet date in<br />
accordance with the three levels of the fair value hierarchy:<br />
■ Level 1: Quoted prices (unadjusted) in active markets for identical assets and liabilities. This<br />
includes fi rst and foremost listed equities, futures and options, investment funds and highly liquid<br />
bonds traded on regulated markets. As at the balance sheet date the proportion of fi nancial<br />
instruments in the total portfolio of fi nancial assets measured at fair value allocated to level 1<br />
was 45 (50)%.<br />
203
204 <strong>Talanx</strong> Group Financial report 2010<br />
■ Level 2: Inputs used for measurement that are based on observable market data and are not<br />
included in level 1. This level includes, for example, assets measured on the basis of interest<br />
rate curves, such as borrower’s note loans and registered debentures. Market prices of bonds of<br />
limited liquidity, such as corporate bonds, are also allocated to level 2. Altogether, 52 (46)% of<br />
the fi nancial instruments recognized at fair value were allocated to this level as at the balance<br />
sheet date.<br />
■ Level 3: Inputs used for measurement that are not based on observable market data (unobservable<br />
inputs). This level includes primarily unlisted equity securities. As at the balance sheet date<br />
the Group allocated 3 (4)% of the fi nancial assets recognized at fair value to this category.<br />
The following table shows the carrying amounts of the fi nancial assets recognized at fair value<br />
broken down according to the three levels of the fair value hierarchy:<br />
Carrying amounts of fi nancial instruments<br />
recognized at fair value Level 1 Level 2 Level 3 1)<br />
Figures in EUR million<br />
Assets measured at fair value<br />
Financial assets available for sale<br />
Balance at<br />
31.12.2010<br />
Fixed-income securities 11,054 17,216 60 28,330<br />
Variable-yield securities<br />
Financial assets at fair value through profi t or loss<br />
Financial assets classifi ed at fair value<br />
1,706 314 285 2,305<br />
through profi t or loss 130 836 23 989<br />
Financial assets held for trading 153 79 — 232<br />
Other invested assets<br />
Total amount of fi nancial assets<br />
3,016 158 897 4,071<br />
measured at fair value 16,059 18,603 1,265 35,927<br />
Financial liabilities measured at fair value<br />
Other liabilities (negative fair values from<br />
derivative fi nancial instruments)<br />
Negative fair values from derivatives<br />
(trading portfolio) 2 83 — 85<br />
Negative fair value from hedging instruments<br />
Total amount of fi nancial liabilities<br />
109 40 — 149<br />
measured at fair value 111 123 — 234<br />
1) Categorization in level 3 has no quality implications;<br />
no conclusions may be drawn as to the credit rating of the issuers.
Notes Notes on the consolidated balance sheet – assets<br />
Carrying amounts of fi nancial instruments<br />
recognized at fair value Level 1 Level 2 Level 3 1)<br />
Figures in EUR million<br />
Assets measured at fair value<br />
Financial assets available for sale<br />
Balance at<br />
31.12.2009<br />
Fixed-income securities 10,522 13,570 134 24,226<br />
Variable-yield securities<br />
Financial assets at fair value through profi t or loss<br />
Financial assets classifi ed at fair value<br />
1,610 89 552 2,251<br />
through profi t or loss 188 641 32 861<br />
Financial assets held for trading 150 88 — 238<br />
Other invested assets<br />
Total amount of fi nancial assets<br />
3,237 64 713 4,014<br />
measured at fair value 15,707 14,452 1,431 31,590<br />
Financial liabilities measured at fair value<br />
Other liabilities (negative fair values from<br />
derivative fi nancial instruments)<br />
Negative fair values from derivatives<br />
(trading portfolio) — 30 — 30<br />
Negative fair value from hedging instruments<br />
Total amount of fi nancial liabilities<br />
2 40 — 42<br />
measured at fair value 2 70 — 72<br />
1) Categorization in level 3 has no quality implications;<br />
no conclusions may be drawn as to the credit rating of the issuers.<br />
In the fi nancial year just-ended securities with a fair value of EUR 614 million were no longer classifi<br />
ed as level 1 fi nancial assets – as in the previous year – but were instead allocated to level 2. The<br />
reclassifi cation was carried out above all as a consequence of the reduced liquidity of the instruments.<br />
We reclassifi ed securities with a fair value of EUR 74 million, which in the previous year were<br />
recognized as level 2 fi nancial assets, to level 1 in 2010. Overall, the reclassifi cations for the most<br />
part aff ect fi xed-income securities allocated to the category “fi nancial assets available for sale”.<br />
Analysis of fi nancial assets for which signifi cant inputs are not based<br />
on observable market data (level 3)<br />
In the year under review variable-yield securities allocated to the category “fi nancial assets available<br />
for sale” with a volume of EUR 257 million were correctly reclassifi ed – since in this regard<br />
required parameters at fair value are based on observable market data – from level 3 to level 2. This<br />
allocation aff ects in an amount of EUR 250 million solely investment fund units. In addition, we<br />
reclassifi ed securities with a fair value of EUR 53 million – of which EUR 25 million is attributable to<br />
variable-yield securities in our portfolio of fi nancial assets classifi ed at fair value through profi t or<br />
loss – from level 3 to level 1. Listed market prices were available for these instruments in the reporting<br />
period.<br />
205
206 <strong>Talanx</strong> Group Financial report 2010<br />
Development of fi nancial assets<br />
recognized at fair value<br />
Figures in EUR million<br />
The following table provides a reconciliation of the fi nancial assets included in level 3 at the beginning<br />
of the reporting period with the values as at 31 December of the fi nancial year.<br />
Financial assets<br />
available for sale/<br />
Fixed-income<br />
securities<br />
Financial assets<br />
available for sale/<br />
Variable-yield<br />
securities<br />
Financial assets<br />
classifi ed at<br />
fair value through<br />
profi t or loss<br />
Other invested<br />
assets (measured at<br />
fair value)<br />
Total amount of<br />
fi nancial assets<br />
Balance at 01.01.2009<br />
Income and expenses<br />
recognized in the<br />
96 608 41 719 1,464<br />
statement of income –1 –40 4 –71 –108<br />
recognized directly in equity 30 –12 — –3 15<br />
Transfers to level 3 — — — — —<br />
Transfers from level 3 — — — — —<br />
Additions 9 44 — 90 143<br />
Disposals — 47 13 16 76<br />
Currency exchange rate diff erences — –1 — –6 –7<br />
Balance at 01.01.2010<br />
Income and expenses<br />
recognized in the<br />
134 552 32 713 1,431<br />
statement of income 1 –8 2 –18 –23<br />
recognized directly in equity 2 –7 — 95 90<br />
Transfers to level 3 — — — — —<br />
Transfers from level 3 –6 –279 –25 — –310<br />
Additions 12 35 13 168 228<br />
Disposals 80 12 — 64 156<br />
Currency exchange rate diff erences –3 4 1 3 5<br />
Balance at 31.12.2010 60 285 23 897 1,265<br />
Presentation of eff ects on profi t or loss<br />
of the fi nancial assets recognized at<br />
fair value in level 3<br />
Figures in EUR million<br />
Gains and losses in the 2009<br />
fi nancial year<br />
The income and expenses for the period recognized in the consolidated statement of income including<br />
the gains and losses on assets and liabilities held in the portfolio at the end of the reporting<br />
period that were included in level 3 are shown in the following table:<br />
Financial assets<br />
available for sale/<br />
Fixed-income<br />
securities<br />
Financial assets<br />
available for sale/<br />
Variable-yield<br />
securities<br />
Financial assets<br />
classifi ed at<br />
fair value through<br />
profi t or loss<br />
Other invested<br />
assets (measured at<br />
fair value)<br />
Total amount of<br />
fi nancial assets<br />
Income from investments 4 — 6 11 21<br />
Expenses for investments<br />
Thereof attributable to fi nancial assets<br />
included in the portfolio at 31.12.2009<br />
–5 –40 –2 –82 –129<br />
Income from investments 4 — 6 11 21<br />
Expenses for investments<br />
Gains and losses in the 2010<br />
fi nancial year<br />
–3 –33 –2 –82 –120<br />
Income from investments 2 — 5 3 10<br />
Expenses for investments<br />
Thereof attributable to fi nancial assets<br />
included in the portfolio at 31.12.2010<br />
–1 –8 –3 –21 –33<br />
Income from investments 2 — 5 1 8<br />
Expenses for investments –1 –2 –3 –7 –13
Notes Notes on the consolidated balance sheet – assets<br />
If models are used to measure fi nancial assets included in level 3 under which the adoption of<br />
reasonable alternative inputs leads to a material change in fair value, IFRS 7 requires disclosure<br />
of the eff ects of these alternative assumptions. Of the fi nancial assets included in level 3 with fair<br />
values of altogether EUR 1.3 (1.4) billion as at the balance sheet date, the Group generally measures<br />
fi nancial assets with a volume of EUR 1.2 (1.3) billion using the Net Asset Value method, in respect of<br />
which alternative inputs within the meaning of the standard cannot reasonably be established. For<br />
the remaining fi nancial assets included in level 3 with a volume of EUR 28 (101) million, the eff ects<br />
of alternative inputs and assumptions are immaterial.<br />
(12) Derivative fi nancial instruments and hedge accounting<br />
Derivatives<br />
We use derivative fi nancial instruments to hedge against interest rate, exchange and other market<br />
price risks and to a limited extent also to optimize returns or realize intentions to buy/sell. In this<br />
context, the applicable regulatory requirements and the standards set out in the Group’s internal<br />
investment guidelines are strictly observed and fi rst-class counterparties are always selected.<br />
In addition, embedded derivatives in structured products and insurance contracts are – where<br />
required under the standards of IAS 39 “Financial Instruments: Recognition and Measurement” and<br />
IFRS 4 “Insurance Contracts” – separated from the underlying contracts and recognized separately<br />
at fair value.<br />
In the context of initial measurement derivative fi nancial instruments are recognized at the fair<br />
value attributable to them on the date of contract materialization. Subsequent measurement is<br />
then also made at the fair value applicable on the relevant balance sheet date. Regarding the valuation<br />
models used, please see the subsection entitled “Determination of fair values” in the section<br />
“Accounting policies” on pages 133 et seq.<br />
The method of recognizing gains and losses is dependent upon whether or not the derivative fi nancial<br />
instrument is used as a hedging instrument within the meaning of hedge accounting pursuant<br />
to IAS 39 – and, if it was, on the type of hedged position/risk. In the case of derivatives which are not<br />
hedging instruments, the fl uctuations in value are recognized in the statement of income within<br />
investment income. This approach also applies to separated embedded derivatives of structured<br />
fi nancial instruments and those from insurance contracts. With respect to hedging instruments,<br />
the Group distinguishes between derivatives according to their intended use as fair value hedges<br />
and cash fl ow hedges (see separate subsection of this item of the Notes).<br />
207
208 <strong>Talanx</strong> Group Financial report 2010<br />
Maturities of derivative<br />
fi nancial instruments<br />
Figures in EUR million<br />
Interest rate hedges<br />
The recognition of derivative fi nancial instruments in the balance sheet is broken down in the following<br />
table:<br />
Balance sheet recognition of derivative fi nancial<br />
instruments<br />
Figures in EUR million<br />
Balance sheet items (positive fair values)<br />
Hedging instrument<br />
as per IAS 39 31.12.2010 31.12.2009<br />
Financial assets at fair value through profi t or<br />
loss, fi nancial assets held for trading (derivatives)<br />
Balance sheet items (negative fair values)<br />
No 80 112<br />
Liabilities, other liabilities (derivatives) No –85 –30<br />
Yes –149 –42<br />
Total (net) –154 40<br />
In the fi nancial year just-ended the derivative fi nancial instruments – excluding derivatives used as<br />
hedging instruments – produced an unrealized loss of –EUR 20 million. This contrasted with a gain<br />
of EUR 14 million in the previous year. The loss realized on positions closed in 2010 amounted to<br />
–EUR 21 million, compared to a gain of EUR 19 million in the previous year.<br />
The fair values of our open derivative positions including the relevant nominal values as at the<br />
balance sheet date are shown below diff erentiated according to risk types and maturities. Positive<br />
and negative fair values are netted in the table. Open positions from derivatives therefore existed<br />
in an amount of –EUR 154 (40) million at the balance sheet date, corresponding to 0.1 (0.04)% of the<br />
balance sheet total.<br />
Due in<br />
one year<br />
Due after one<br />
through<br />
fi ve years<br />
Due after fi ve<br />
through<br />
ten years<br />
Due after<br />
ten years Other 31.12.2010 31.12.2009<br />
Fair value 1 –143 — –1 14 –129 –25<br />
Notional values<br />
Currency hedges<br />
52 1,856 — 5 375 2,288 1,165<br />
Fair value –5 –18 –11 — — –34 –15<br />
Notional values<br />
Equity and index hedges<br />
22 47 42 — — 111 168<br />
Fair value — — –6 — — –6 25<br />
Notional values<br />
Infl ation hedges<br />
— — 1 — — 1 474<br />
Fair value — –31 — — — –31 —<br />
Notional values<br />
Derivatives in connection with<br />
insurance contracts<br />
— 2,535 — — — 2,535 —<br />
1)<br />
Fair value<br />
Other risks<br />
— — — — 46 46 55<br />
Fair value — — — — — — —<br />
Notional values<br />
Total hedges<br />
— — — — — — 3<br />
Fair value –4 –192 –17 –1 60 –154 40<br />
Notional values 74 4,438 43 5 375 4,935 1,810<br />
1) The fi nancial instruments relate exclusively to derivatives in connection with reinsurance business which under IFRS 4 are to be separated fr om the underlying insurance<br />
contract and recognized separately at fair value. In view of the characteristics of these derivatives, a maturity disclosure/presentation of nominal values is not reasonably<br />
possible and has therefore been omitted. The derivatives are recognized at fair value.
Notes Notes on the consolidated balance sheet – assets<br />
In the year under review the Group acquired derivative fi nancial instruments in the reinsurance<br />
sector to hedge infl ation risks within the loss reserves. These transactions resulted in the recognition<br />
of negative fair values of EUR 31 million (balance sheet item: 26 “Other liabilities”, page 229).<br />
Hedge accounting<br />
In the context of hedge accounting the Group seeks to compensate for the changes in value/<br />
changes in cash fl ows of an underlying caused by changes in market price by taking out a hedging<br />
instrument (derivative), the changes in value or changes in cash fl ows of which develop along<br />
approximately opposite lines. Hedging is carried out on the level of individual transactions (micro<br />
hedge). On closing of the transaction we document the hedge relationship between the underlying<br />
and the hedging instrument, the purpose of risk management and the underlying hedging strategy.<br />
In addition, at the outset of the hedge relationship we document our assessment of the extent to<br />
which the hedging instruments are eff ective in off setting the corresponding changes of the underlying.<br />
Proof of the eff ectiveness of the hedge relationships has been furnished.<br />
Fair value hedges<br />
In order to hedge changes in the fair value of equities (underlyings), the Group designated equity<br />
swaps as hedging derivatives in 2010. Under these fair value hedges, the changes in the fair value<br />
of the derivative are recognized with the changes in the fair value of the underlying allocable to the<br />
hedged risk in the investment income. In the year under review losses of –EUR 1 million from the<br />
underlying transactions and gains of EUR 1 million from the hedging derivatives were recognized in<br />
income for the fair value hedges. There was no ineff ectiveness in the case of these hedges.<br />
Cash fl ow hedges<br />
The Group uses interest rate swaps in the context of cash fl ow hedges in order to hedge cash fl ows<br />
relating to certain fl oating-rate commitments (underlyings) against the associated interest rate risk.<br />
The plain vanilla interest rate swaps serve to protect against adverse eff ects in the net profi t or loss<br />
for the period in the event of rising interest rates. The interest payments received from the swaps<br />
(fl oating rates) are opposed by interest payments in the same amount in connection with the liabilities;<br />
in addition, the Group undertakes to make fi xed interest payments to the swap partners. The<br />
selection of highly rated counterparties ensures that we avoid entering into a signifi cant credit risk.<br />
The fl oating rate varies according to the 3-month EURIBOR. In addition, in 2010 the Group hedged<br />
future transactions that are very likely to occur against the interest rate risk. In this connection<br />
valuation units are established consisting of forward transactions in securities (forward purchases)<br />
and planned securities purchases. The forward purchases are used to hedge the risk associated with<br />
already fi rm future reinvestments that it may only be possible in future to generate low returns on<br />
reinvestments due to falling interest rates. The underlying in relation to the hedging instruments<br />
is the future investment at the then applicable returns/rates. IAS 39 only permits the hedging of<br />
planned transactions to be captured as cash fl ow hedges.<br />
The eff ective part of the hedging instruments measured at fair value is recognized directly in<br />
equity in the cash fl ow hedge reserve aft er allowance for deferred taxes. The ineff ective part of such<br />
changes in value, on the other hand, is booked directly in the statement of income in the investment<br />
income – in the case of eff ective hedging of fl oating-rate liabilities in other income/expenses.<br />
The underlying continues to be measured at amortized cost in accordance with allocation to the<br />
category pursuant to IAS 39. If the hedged transactions result in the recognition of fi nancial assets,<br />
the amounts carried in shareholders’ equity are amortized over the maturity period of the acquired<br />
asset.<br />
209
210 <strong>Talanx</strong> Group Financial report 2010<br />
The following table presents a reconciliation of the cash fl ow hedge reserve (before taxes):<br />
Changes in the cash fl ow hedge reserve<br />
Figures in EUR million<br />
2010 2009<br />
Balance at 31.12. of the previous year –33 –26<br />
Allocations (hedging of cash fl ows from fl oating interest rates) 7 –7<br />
Reductions (hedging of planned transactions) –110 —<br />
Balance at 31.12. of the year under review (before taxes) –136 –33<br />
The negative balance of the cash fl ow hedge reserve increased in the year under review by<br />
–EUR 103 (–7) million (before taxes) and –EUR 100 (–5) million (aft er taxes).<br />
An amount of EUR 1.2 (0.2) million was recognized in income in the year under review owing to the<br />
ineff ectiveness of cash fl ow hedges.<br />
The expected cash fl ows from the cash fl ow hedges and their respective contribution to profi t or<br />
loss are as follows:<br />
> 1 year and<br />
Expected<br />
total<br />
Cash fl ows of the hedged transaction < 1 year < 5 years amount 31.12.2010 1) 31.12.2009 1)<br />
Figures in EUR million<br />
Cash fl ow of the underlyings –10 –903 –913 –5 –10<br />
Cash fl ow of the hedging instruments –16 –9 –25 –21 –16<br />
Profi t/loss –26 –15 –41 –26 –26<br />
1) Cash fl ow of the period in question<br />
Fair values of the hedging instruments<br />
The fair values of the derivative fi nancial instruments designated in the context of hedge accounting<br />
were as follows as at the balance sheet date:<br />
Hedging instruments<br />
Figures in EUR million<br />
Fair value hedges<br />
2010 2009<br />
Equity swaps<br />
Cash fl ow hedges<br />
–6 —<br />
Interest rate swaps –33 –42<br />
Forward securities transactions –110 —<br />
Total –149 –42<br />
The net gains or losses on derivatives used for hedging carried in the statement of income<br />
amounted to –EUR 22 (–16) million in the year under review and relate chiefl y to current interest<br />
payments (–EUR 21 (–16) million), changes in value recognized in income on grounds of ineff ectiveness<br />
(EUR 1.2 (0.2) million), EUR 1 million from hedging derivatives in connection with fair value<br />
hedges and –EUR 3 million from other payments.
(13) Accounts receivable on insurance business<br />
Notes Notes on the consolidated balance sheet – assets<br />
2010 2009<br />
Figures in EUR million<br />
Accounts receivable on direct written insurance business<br />
thereof:<br />
1,551 1,428<br />
From <strong>policy</strong>holders 796 815<br />
From insurance intermediaries 755 613<br />
Accounts receivable on reinsurance business 3,460 2,914<br />
Balance at 31.12. of the year under review 5,011 4,342<br />
(14) Deferred acquisition costs<br />
Gross<br />
business<br />
2010 2009<br />
Reinsurance<br />
recoverables<br />
Net<br />
business<br />
Gross<br />
business<br />
Reinsurance<br />
recoverables<br />
Net<br />
business<br />
Figures in EUR million<br />
Balance at 31.12.<br />
of the previous year<br />
Change in<br />
3,899 355 3,544 4,137 628 3,509<br />
consolidated group<br />
Portfolio entries/<br />
— — — — — —<br />
withdrawals<br />
Newly capitalized<br />
10 1 9 — 1 –1<br />
acquisition costs<br />
Amortized<br />
624 –4 628 273 –195 468<br />
acquisition costs 658 65 593 561 78 483<br />
Currency adjustments 138 6 132 50 –1 51<br />
Other changes<br />
Balance at 31.12.<br />
— 5 –5 — — —<br />
of the year under review 4,013 298 3,715 3,899 355 3,544<br />
211
212 <strong>Talanx</strong> Group Financial report 2010<br />
(15) Other assets<br />
2010 2009<br />
Figures in EUR million<br />
Own-use real estate 646 612<br />
Tax refund claims 266 216<br />
Plant and equipment 140 148<br />
Interest and rent due 15 12<br />
Sundry assets 714 667<br />
Balance at 31.12. of the year under review 1,781 1,655<br />
Development of own-use real estate<br />
Figures in EUR million<br />
2010 2009<br />
Gross book value at 31.12. of the previous year 822 757<br />
Adjustment of values carried forward from prior years 1) –23 —<br />
Gross book value at 01.01. of the year under review 799 757<br />
Change in consolidated group — 1<br />
Additions 56 62<br />
Disposals 136 1<br />
Reclassifi cation –32 2<br />
Currency exchange rate diff erences 2 1<br />
Gross book value at 31.12. of the year under review 689 822<br />
Accumulated depreciation and accumulated impairment losses<br />
at 31.12. of the previous year 210 185<br />
Adjustment of values carried forward from prior years 1) Accumulated depreciation and accumulated impairment losses<br />
–23 —<br />
at 01.01. of the year under review 187 185<br />
Change in consolidated group — —<br />
Additions — 15<br />
Disposals<br />
Depreciation/impairment<br />
134 —<br />
Scheduled 12 11<br />
Unscheduled 1 2<br />
Reclassifi cation<br />
Accumulated depreciation and accumulated impairment losses<br />
–23 –3<br />
at 31.12. of the year under review 43 210<br />
Balance at 31.12. of the previous year 612 572<br />
Balance at 31.12. of the year under review 646 612<br />
1) The values carried forward were adjusted in connection with implementation of a new IT system;<br />
there were no implications for the carrying value<br />
The fair value of the own-use real estate amounted to EUR 697 (691) million as at the balance sheet<br />
date. These fair values were calculated largely using the discounted cash fl ow method. The methods<br />
used to determine the book values are set out in the section entitled “Accounting policies”, subsection<br />
“Summary of major accounting policies” on page 127.
Notes Notes on the consolidated balance sheet – assets<br />
An amount of EUR 245 (253) million was allocated from the own-use real estate to special cover<br />
funds. The expenditures capitalized for buildings under construction amounted to EUR 96 (42) million<br />
as at the balance sheet date. Contractual commitments for the acquisition of property, plant<br />
and equipment totaled EUR 2 (—) million as at the balance sheet date.<br />
Development of plant and equipment<br />
Figures in EUR million<br />
2010 2009<br />
Gross book value at 31.12. of the previous year 411 343<br />
Adjustment of values carried forward from prior years 1) –27 —<br />
Gross book value at 01.01. of the year under review 384 343<br />
Change in consolidated group — 15<br />
Additions 42 71<br />
Disposals 38 24<br />
Reclassifi cation 1 —<br />
Disposal group pursuant to IFRS 5 — 2<br />
Currency exchange rate diff erences 8 4<br />
Gross book value at 31.12. of the year under review 397 411<br />
Accumulated depreciation and accumulated impairment losses<br />
at 31.12. of the previous year 263 221<br />
Adjustment of values carried forward from prior years 1) Accumulated depreciation and accumulated impairment losses<br />
–27 —<br />
after currency translation at 01.01. of the year under review 236 221<br />
Change in consolidated group — 2<br />
Additions — 1<br />
Disposals<br />
Depreciation/impairments<br />
30 —<br />
Scheduled 45 34<br />
Unscheduled 1 1<br />
Reclassifi cation 1 —<br />
Other changes — 2<br />
Currency exchange rate diff erences<br />
Accumulated depreciation and accumulated impairment losses<br />
4 2<br />
at 31.12. of the year under review 257 263<br />
Balance at 31.12. of the previous year 148 122<br />
Balance at 31.12. of the year under review 140 148<br />
1) The values carried forward were adjusted in connection with implementation of a new IT system;<br />
there were no implications for the carrying value<br />
Other assets<br />
Figures in EUR million<br />
31.12.2010 31.12.2009<br />
Trade accounts receivable 77 93<br />
Receivables relating to investments 75 170<br />
Receivables from non-group lead business 68 84<br />
Other tangible assets 8 11<br />
Claims under insurance for pension commitments 55 50<br />
Prepaid insurance benefi ts 175 116<br />
Surrender values 33 28<br />
Prepaid expenses 37 18<br />
Sundry assets 186 97<br />
Total 714 667<br />
213
214 <strong>Talanx</strong> Group Financial report 2010<br />
Notes on the consolidated balance sheet<br />
– liabilities<br />
(16) Shareholders’ equity<br />
Shareholders’ equity is shown as a separate component of the consolidated fi nancial statement in<br />
accordance with IAS 1 “Presentation of Financial Statements” and IAS 32 “Financial Instruments:<br />
Disclosure and Presentation” in conjunction with IAS 39 “Financial Instruments: Recognition and<br />
Measurement”. The change in shareholders’ equity comprises not only the net income deriving<br />
from the statement of income but also the changes in the value of asset and liability items not<br />
recognized in the statement of income.<br />
The share capital of <strong>Talanx</strong> AG remains unchanged at EUR 260 million and is divided into 260,000<br />
registered no-par shares. The share capital is fully paid up. With regard to the composition of the<br />
shareholders’ equity, please see the “Consolidated statement of changes in equity” on page 112.<br />
Minority interests are established in accordance with the shares held by companies outside the<br />
Group in the shareholders’ equity of the subsidiaries – principally in the shareholders’ equity of the<br />
Hannover Re Group.<br />
Minority interests 2010 2009 1)<br />
Figures in EUR million<br />
Unrealized gains and losses from investments 225 169<br />
Minority interest in net profi t 450 408<br />
Other shareholder’s equity 2,360 2,002<br />
Total 3,035 2,579<br />
1) Adjusted on the basis of IAS 8<br />
The equity-aff ecting changes in fi nancial instruments – allocated to the category of “fi nancial<br />
assets available for sale” within the Group – before allowance for <strong>policy</strong>holders, minority interests<br />
and deferred taxes were as follows:<br />
2010 2009<br />
Figures in EUR million<br />
Allocation of gains/losses from the fair value measurement of the<br />
“ fi nancial assets available for sale” (unrealized gains and losses)<br />
Transfer of gains/losses from the fair value measurement of the<br />
97 1,098<br />
“fi nancial assets available for sale” to the result for the reporting period –216 –95<br />
Changes in shareholders’ equity and minority interests<br />
IAS 1 “Presentation of Financial Statements” requires detailed disclosures in the Notes that enable<br />
the readers of the fi nancial statements to understand the objectives, methods and processes of<br />
capital management and provide supplementary information on changes in Group shareholders’<br />
equity.<br />
In this context please see the following remarks as well as the information contained in the management<br />
report regarding capital management and performance management as well as valuebased<br />
management.
Capital management<br />
Notes Notes on the consolidated balance sheet – liabilities<br />
The preservation and consistent strengthening of its equity base is a key strategic objective for the<br />
<strong>Talanx</strong> Group. As part of its approach to capital management the <strong>Talanx</strong> Group considers the <strong>policy</strong>holders’<br />
surplus over and above the shareholders’ equity reported in the balance sheet.<br />
The <strong>policy</strong>holders’ surplus is defi ned as the sum total of<br />
■ shareholders’ equity excluding minority interests, composed of the common shares, additional<br />
paid-in capital, other comprehensive income and retained earnings,<br />
■ minority interests and<br />
■ hybrid capital used as an equity substitute, which encompasses our subordinated liabilities.<br />
The <strong>policy</strong>holders’ surplus totaled EUR 10.8 (9.2) billion as at the balance sheet date.<br />
The chart below illustrates the growth of the <strong>policy</strong>holders’ surplus over the last fi ve reporting<br />
years.<br />
■ Hybrid capital<br />
■ Minority interests<br />
■ Group shareholders’ equity<br />
1) Adjusted on the basis of IAS 8<br />
7,634 8,331<br />
7,792 9,156<br />
2,170<br />
2,037<br />
3,427<br />
The <strong>Talanx</strong> Group uses “Intrinsic Value Creation” (IVC) as its central value-based management indicator<br />
for measuring the value created by our Group companies and segments. This concept as well<br />
as the objectives and principles in accordance with which we conduct our enterprise governance<br />
and capital management is described in our remarks on capital management and performance<br />
management in the relevant subsections of the management report.<br />
In terms of its capital resources the <strong>Talanx</strong> Group satisfi es the expectations of the rating agencies<br />
that assess the Group’s fi nancial strength. Some Group companies are subject to additional national<br />
capital and solvency requirements. All Group companies met the applicable local minimum<br />
capital requirements in the year under review.<br />
Within the scope of Group-wide capital management <strong>Talanx</strong> AG monitors the capital resources of<br />
its subsidiaries with the utmost diligence.<br />
2,168<br />
2,431<br />
3,732<br />
2,074<br />
2,092<br />
3,626<br />
Figures in EUR million 2006 1) 2007 1) 2008 1) 2009 1)<br />
2,003<br />
2,579<br />
4,574<br />
10,782<br />
2010<br />
2,791<br />
3,035<br />
4,956<br />
215
216 <strong>Talanx</strong> Group Financial report 2010<br />
(17) Subordinated liabilities<br />
In order to optimize the Group’s capital structure and to safeguard the liquidity (solvency) required<br />
(by regulators), various Group companies have in the past taken out long-term liabilities that predominantly<br />
take the form of subordinated debt and are in some cases exchange-listed.<br />
Specifi cally, the long-term subordinated debt is comprised of the following fi nancial instruments:<br />
Nominal value, coupon,<br />
issue/maturity,<br />
debt rating (A. M. Best; S&P) 2010 2009<br />
Figures in EUR million<br />
<strong>Talanx</strong> AG EUR 300 million, fi xed then fl oating rate,<br />
2010/no fi nal maturity, (—; BBB)<br />
<strong>Talanx</strong> AG issued a subordinated registered bond in 2010 with a contractual conversion<br />
obligation to <strong>Talanx</strong> shares in the event of an initial public off ering; it may be<br />
called by the issuer after ten years at the earliest.<br />
300 —<br />
Hannover Finance (Luxembourg) S. A. EUR 500 million, fi xed (5.75%) then<br />
fl oating rate, 2010/2040, (a; A)<br />
The guaranteed subordinated bond was issued in 2010 on the European capital<br />
market. It may be called in 2014 at the earliest and at each coupon date thereafter.<br />
500 —<br />
Hannover Finance (Luxembourg) S. A. EUR 750 million, fi xed (5.75%) then<br />
fl oating rate, 2004/2024, (a; A)<br />
The guaranteed subordinated debt was placed on the European capital market.<br />
It may be redeemed in 2014 at the earliest and at each coupon date thereafter.<br />
747 746<br />
Hannover Finance (Luxembourg) S. A. EUR 500 million, fi xed (5%) then fl oating<br />
rate, 2005/no fi nal maturity, (a; A)<br />
Part of the volume of the guaranteed subordinated debt was off ered to the holders<br />
of the debt issued in 2001 by way of exchange. The debt may be called by the issuer<br />
on 01.06.2015 at the earliest and at each coupon date thereafter.<br />
484 481<br />
Hannover Finance (Luxembourg) S. A. 1) EUR 138 million, fi xed (6.25%) then<br />
fl oating rate, 2001/2031, (a; A)<br />
The guaranteed subordinated debt was originally issued in an amount of EUR 350<br />
million. The holders of this debt were off ered the opportunity to exchange into the<br />
new debt issued in 2005. Nominal participation in the exchange was EUR 212 million.<br />
The debt may be called by the issuer in March 2011 at the earliest.<br />
138 138<br />
HDI-Gerling Industrie Versicherung AG EUR 250 million, fi xed (7%) then fl oating<br />
rate, 2004/2024, (bbb+; A–)<br />
The subordinated bond is listed on the Euro MTF Market of the Luxembourg Stock<br />
Exchange and may be called by the issuer in 2014 at the earliest.<br />
265 269<br />
HDI-Gerling Lebensversicherung AG 2) EUR 110 million, 6.75%, 2005/no fi nal<br />
maturity (—; A–)<br />
The subordinated debt is listed on the Euro MTF Market of the Luxembourg Stock<br />
Exchange. It may be called by the issuer in 2015 at the earliest.<br />
115 105<br />
<strong>Talanx</strong> Finanz 3) EUR 243 million, 4.5%, 2005/2025,<br />
(bbb; BBB)<br />
The bond was originally issued in an amount of EUR 350 million. The guaranteed<br />
subordinated debt is listed on the Luxembourg Stock Exchange.<br />
242 264<br />
Balance at 31.12 . of the fi nancial year 2.791 2.003<br />
1) The remaining volume of this debt in an amount of EUR 138 million was repaid on 14 March 2011<br />
2) In the fi rst quarter of 2010 external companies acquired portions of the debt in a nominal amount of EUR 10 million;<br />
the remaining volume was increased accordingly<br />
3) In the fi rst quarter of 2010 the issuer bought back, amortized and cancelled portions of the debt in a nominal amount<br />
of EUR 10 million fr om a Group company. In the third quarter of 2010 Group companies purchased portions of the debt in<br />
a nominal amount of EUR 22 million; the remaining volume was reduced accordingly
Notes Notes on the consolidated balance sheet – liabilities<br />
The increase in subordinated debt resulted principally from the two debts issued in the year under<br />
review.<br />
On 14 September 2010 our subsidiary Hannover Finance (Luxembourg) S. A. placed subordinated<br />
debt on the European capital market with a nominal value of EUR 500 million. It has a maturity<br />
of 30 years with a fi rst scheduled call option aft er ten years. The bond carries a fi xed coupon of<br />
5.75% p.a. in the fi rst ten years, aft er which the interest basis changes to a fl oating rate of threemonth<br />
EURIBOR +423.5 basis points.<br />
In November of the year under review <strong>Talanx</strong> AG signed a contract with the Japanese insurer Meiji<br />
Yasuda Life Insurance Company, Tokyo, regarding a long-term strategic cooperation backed by a<br />
capital participation. In this context <strong>Talanx</strong> AG issued a subordinated debt on 18 November 2010<br />
with a nominal volume of EUR 300 million. The creditor is Meiji Yasuda Life Insurance Company.<br />
The bond has no fi nal maturity and entails a contractual obligation for conversion into shares of<br />
<strong>Talanx</strong> AG in the event of an initial public off ering. In the fi rst ten years this debt carries a fi xed<br />
coupon; it has a fi rst scheduled call option by the issuer aft er 10 years.<br />
2010<br />
Figures in EUR million<br />
Amortized cost<br />
Unrealized<br />
gains or losses Accrued interest Fair value<br />
Debts measured at amortized cost 2,791 –86 66 2,771<br />
2009<br />
Figures in EUR million<br />
Amortized cost<br />
Unrealized<br />
gains or losses Accrued interest Fair value<br />
Debts measured at amortized cost 2,003 –132 58 1,929<br />
The fair value of the extended subordinated loans is normally based on quoted, active market<br />
prices. If such price information was not available, fair value was determined on the basis of the<br />
recognized eff ective interest rate method or estimated using other fi nancial assets with similar<br />
rating, duration and return characteristics. Under the eff ective interest rate method the current<br />
market interest rate levels in the relevant interest rate fi xing periods are always taken as a basis.<br />
The net result of EUR 126 (104) million from subordinated liabilities in the year under review consisted<br />
of interest expenses in an amount of EUR 126 (102) million and expenses from amortization<br />
(EUR — (2) million).<br />
Of the total subordinated liabilities, an amount of EUR 646 (524) million has a maturity of up to<br />
5 years, EUR 746 (746) million has a maturity of 10–20 years, EUR 500 (138) million has a maturity of<br />
more than 20 years and EUR 899 (595) million has no fi xed maturity. A detailed presentation of the<br />
maturities is provided in the section entitled “Nature of risks associated with insurance contracts<br />
and fi nancial instruments” (subsection “Management of liquidity risks”, pages 184 et seqq.).<br />
217
218 <strong>Talanx</strong> Group Financial report 2010<br />
(18) Unearned premium reserve<br />
2010 2009<br />
Gross Retro Net Gross Retro Net<br />
Figures in EUR million<br />
Balance at 31.12.<br />
of the previous year 5,026 414 4,612 4,894 409 4,485<br />
Change in the consolidated group — — — 69 24 45<br />
Portfolio entries/withdrawals –3 –1 –2 –54 2 –56<br />
Allocations 906 90 816 1,361 38 1,323<br />
Releases 722 116 606 1,294 62 1,232<br />
Other changes — –1 1 –1 — –1<br />
Currency exchange rate diff erences<br />
Balance at 31.12.<br />
204 20 184 51 3 48<br />
of the year under review 5,411 406 5,005 5,026 414 4,612<br />
(19) Benefi t reserve<br />
2010 2009<br />
Gross Retro Net Gross Retro Net<br />
Figures in EUR million<br />
Balance at 31.12.<br />
of the previous year 39,754 799 38,955 36,386 929 35,457<br />
Change in the consolidated group — — — 985 — 985<br />
Portfolio entries/withdrawals –61 217 –278 385 –98 483<br />
Allocations 4,168 –11 4,179 3,863 78 3,785<br />
Releases 1,739 — 1,739 1,918 108 1,810<br />
Other changes –2 — –2 — — —<br />
Currency exchange rate diff erences<br />
Balance at 31.12.<br />
346 –28 374 53 –2 55<br />
of the year under review 42,466 977 41,489 39,754 799 38,955<br />
2010 2009<br />
Gross Retro Net Gross Retro Net<br />
Figures in EUR million<br />
Less than one year 2,874 36 2,838 2,933 46 2,887<br />
Between one and fi ve years 8,490 196 8,294 8,085 193 7,892<br />
Between fi ve and ten years 8,856 155 8,701 7,990 166 7,824<br />
Between ten and twenty years 9,888 187 9,701 9,230 204 9,026<br />
After more than twenty years 6,067 80 5,987 5,630 92 5,538<br />
Deposits 6,291 323 5,968 5,886 98 5,788<br />
Total 42,466 977 41,489 39,754 799 38,955
Notes Notes on the consolidated balance sheet – liabilities<br />
(20) Loss and loss adjustment expense reserve (loss reserve)<br />
2010 2009 1)<br />
Gross Retro Net Gross Retro Net<br />
Figures in EUR million<br />
Balance at 31.12.<br />
of the previous year 27,256 4,734 22,522 27,161 5,480 21,681<br />
Change in consolidated group –2 — –2 13 2 11<br />
Portfolio entries/withdrawals<br />
Plus incurred claims and<br />
claims expenses (net)<br />
124 –11 135 –25 –1 –24<br />
Year under review 13,746 1,391 12,355 9,671 1,180 8,491<br />
Previous years 579 134 445 1,369 –216 1,585<br />
Total<br />
Less claims and claims<br />
expenses paid (net)<br />
14,325 1,525 12,800 11,040 964 10,076<br />
Year under review 6,814 518 6,296 4,984 421 4,563<br />
Previous years 6,340 1,077 5,263 5,954 1,291 4,663<br />
Total 13,154 1,595 11,559 10,938 1,712 9,226<br />
Other changes –1,210 –741 –469 –3 22 –25<br />
Currency exchange rate diff erences<br />
Balance at 31.12.<br />
1,199 161 1,038 8 –21 29<br />
of the year under review 28,538 4,073 24,465 27,256 4,734 22,522<br />
1) Adjusted on the basis of IAS 8<br />
The other changes and currency exchange rate diff erences include the fi gures for the disposal<br />
group in accordance with IFRS 5 in an amount of EUR 1.3 billion (gross). In this regard please see our<br />
remarks on the disposal group on pages 164 et seq.<br />
The run-off triangles establish the correlation between the loss occurrence year and the loss run-off<br />
year. In line with previous years, we show the constituted loss reserves not by occurrence years but<br />
by the run-off of the reserve reported in the balance sheet. For the sake of improved understanding,<br />
we split the disclosure into primary insurance and reinsurance, with only the corresponding net<br />
loss reserves being shown.<br />
The following two tables set out the net loss reserves for the years 2000 to 2010 split into our<br />
property/casualty companies in the primary insurance segments and the Group segment of Non-<br />
Life Reinsurance. The tables show the changes made over time in the loss reserve established as at<br />
each balance sheet date due to payments rendered, supplementary premiums brought to account<br />
in years aft er they were written and revised estimates of outstanding payments. The diff erence<br />
between the original loss reserve and the current reserve is refl ected in the net run-off results.<br />
These results are signifi cantly infl uenced by movements in the euro relative to major foreign currencies.<br />
Despite opposing eff ects associated with other major foreign currencies, the depreciation<br />
of the euro against the US dollar year-on-year was a particularly signifi cant factor in the rise in the<br />
loss reserves on a euro basis.<br />
219
220 <strong>Talanx</strong> Group Financial report 2010<br />
Net loss reserve and its run-off in the primary insurance segments<br />
The chart shows the run-off of the net loss reserves established by our property/casualty insurance<br />
companies as at each balance sheet date, this reserve comprising the provisions constituted in<br />
each case for the current and preceding occurrence years. The run-off of the reserves for individual<br />
occurrence years is not shown.<br />
2000 2001 2002 2003 2004 2005 2006 2007 2008 2009 2010<br />
Figures in EUR million<br />
Loss and loss adjustment expense<br />
reserve<br />
Cumulative payments for the year in<br />
question and previous years<br />
3,942 3,912 3,903 4,217 4,879 5,818 6,095 6,242 6,042 6,122 6,700<br />
One year later 1,031 802 872 632 740 1,150 991 1,486 1,008 1,355<br />
Two years later 1,344 1,206 1,237 1,030 1,269 1,696 1,800 1,908 1,787<br />
Three years later 1,596 1,449 1,528 1,409 1,667 2,255 2,030 2,484<br />
Four years later 1,755 1,677 1,831 1,730 2,115 2,401 2,491<br />
Five years later 1,904 1,907 2,091 2,083 2,219 2,805<br />
Six years later 2,100 2,131 2,366 2,121 2,554<br />
Seven years later 2,278 2,363 2,347 2,392<br />
Eight years later 2,462 2,343 2,527<br />
Nine years later 2,465 2,511<br />
Ten years later<br />
Loss and loss adjustment expense<br />
reserve (net) for the year in question<br />
and previous years plus payments<br />
made to date on the original reserve<br />
2,609<br />
One year later 3,696 3,426 3,824 3,863 4,493 5,077 5,205 5,659 5,356 5,917<br />
Two years later 3,337 3,276 3,628 3,806 4,387 5,011 5,161 4,976 5,066<br />
Three years later 3,198 3,334 3,671 3,895 4,381 5,089 4,760 5,398<br />
Four years later 3,234 3,319 3,802 3,941 4,536 4,760 5,038<br />
Five years later 3,196 3,505 3,842 4,065 4,302 4,999<br />
Six years later 3,321 3,507 3,912 3,904 4,524<br />
Seven years later 3,501 3,614 3,807 4,124<br />
Eight years later 3,492 3,538 3,970<br />
Nine years later 3,434 3,675<br />
Ten years later 3,535<br />
Run-off result of the loss reserve<br />
Of which currency exchange rate<br />
407 238 –68 93 355 819 1,056 844 975 205<br />
diff erences<br />
Run-off result excluding currency<br />
50 114 121 36 –94 –123 –81 82 –71 –103<br />
exchange rate diff erences 357 124 –189 57 449 942 1,137 762 1,046 308<br />
As percentage of original loss reserve 9 3 –5 1 9 16 19 12 17 5
Net loss reserve and its run-off in the Non-Life Reinsurance segment<br />
Notes Notes on the consolidated balance sheet – liabilities<br />
The run-off triangles show the run-off of the net loss reserve established as at each balance sheet<br />
date in the Non-Life Reinsurance segment, this reserve comprising the provisions constituted in<br />
each case for the current and preceding occurrence years. The run-off of the reserve for individual<br />
occurrence years is not shown in this regard, but rather the run-off of the reserve constituted annually<br />
in the balance sheet as at the balance sheet date.<br />
2000 2001 2002 2003 2004 2005 2006 2007 2008 2009 2010<br />
Figures in EUR million<br />
Loss and loss adjustment expense<br />
reserve<br />
Cumulative payments for the year in<br />
question and previous years<br />
8,482 12,183 12,863 13,462 13,121 14,296 13,280 12,718 13,354 13,780 15,255<br />
One year later 2,108 2,242 2,118 3,623 4,496 3,051 2,665 2,476 2,928 2,807<br />
Two years later 3,112 3,775 5,024 7,322 6,611 5,072 4,390 4,250 4,573<br />
Three years later 4,174 6,032 7,765 8,780 7,590 6,205 5,696 5,371<br />
Four years later 5,745 8,589 8,909 9,519 8,356 7,306 6,501<br />
Five years later 7,581 9,400 9,467 10,102 9,137 7,935<br />
Six years later 8,114 9,786 9,897 10,734 9,596<br />
Seven years later 8,405 10,122 10,457 11,082<br />
Eight years later 8,611 10,533 10,724<br />
Nine years later 8,891 10,735<br />
Ten years later<br />
Loss and loss adjustment expense<br />
reserve (net) for the year in question<br />
and previous years plus payments<br />
made to date on the original reserve<br />
at the end of the year<br />
9,024<br />
One year later 9,422 11,604 11,743 13,636 14,433 13,074 12,366 12,171 13,265 14,303<br />
Two years later 8,878 10,477 11,845 14,237 13,533 12,366 11,868 11,926 13,263<br />
Three years later 8,186 10,744 12,373 13,597 13,061 11,977 11,645 12,040<br />
Four years later 8,354 11,544 11,731 13,307 12,771 11,773 11,670<br />
Five years later 9,102 11,051 11,666 13,122 12,618 11,769<br />
Six years later 8,756 11,164 11,686 13,054 12,578<br />
Seven years later 8,864 11,219 11,707 12,988<br />
Eight years later 8,936 11,262 11,670<br />
Nine years later 8,933 11,166<br />
Ten years later 8,866<br />
Run-off result of the loss reserve<br />
Of which currency exchange rate<br />
67 28 –58 29 –26 –36 –29 –90 116 –525<br />
diff erences<br />
Run-off result excluding currency<br />
–94 –27 –28 –42 –47 –69 –65 –90 –139 –137<br />
exchange rate diff erences 161 55 –30 71 21 33 36 — 255 –388<br />
As percentage of original loss reserve 2 1 — 1 — — — — 2 –3<br />
221
222 <strong>Talanx</strong> Group Financial report 2010<br />
The carrying amount of the reinsurance recoverables on unpaid claims of EUR 4.1 (4.7) billion<br />
includes cumulative specifi c value adjustments of EUR 4 (24) million. The total amount of the net<br />
reserves was EUR 24.4 (22.5) billion. The following breakdown of the durations refers to this amount.<br />
2010 2009 1)<br />
Duration of the reserve<br />
Figures in EUR million<br />
Gross Retro Net Gross Retro Net<br />
One year or less 9,403 1,516 7,887 8,201 1,427 6,774<br />
Between one and fi ve years 10,944 1,570 9,374 10,514 2,069 8,445<br />
Between fi ve and ten years 4,243 559 3,684 4,220 775 3,445<br />
Between ten and twenty years 2,401 244 2,157 2,663 318 2,345<br />
More than twenty years 1,094 84 1,010 1,302 73 1,229<br />
Deposits 453 100 353 356 72 284<br />
Total 28,538 4,073 24,465 27,256 4,734 22,522<br />
1) Adjusted on the basis of IAS 8<br />
(21) Provision for premium refunds<br />
2010 2009 1)<br />
Gross Retro Netto Net Retro Net<br />
Figures in EUR million<br />
Balance at 31.12.<br />
of the previous year 1,274 1 1,273 973 1 972<br />
Change in the consolidated group — — — 2 — 2<br />
Portfolio entries/withdrawals — — — — — —<br />
Allocations/releases (—)<br />
Disposals<br />
–164 — –164 452 — 452<br />
Life insurance policies<br />
Liability/accident policies with a<br />
–1 — –1 163 — 163<br />
premium refund 11 — 11 8 — 8<br />
Other changes 12 — 12 18 — 18<br />
Currency exchange rate diff erences<br />
Balance at 31.12.<br />
1 — 1 — — —<br />
of the year under review 1,113 1 1,112 1,274 1 1,273<br />
1) Adjusted on the basis of IAS 8
Notes Notes on the consolidated balance sheet – liabilities<br />
(22) Provision for pensions and other post-employment benefi t<br />
obligations<br />
The Group companies normally award their employees pension commitments based on defi ned<br />
contribution or defi ned benefi t plans. The type of pension commitment is given in accordance with<br />
the relevant pension plan and encompasses retirement, disability, widows’ and orphans’ benefi ts.<br />
The pension entitlement is dependent on length of service and salary. The vast majority of pension<br />
commitments are based on defi ned benefi t pension plans.<br />
Under defi ned benefi t plans the pension benefi ciary is promised a specifi c benefi t; in contrast to<br />
defi ned contribution plans, the expenditures to be incurred by the company on the basis of the<br />
benefi t commitments are not fi xed from the outset. The commitments to employees in Germany<br />
predominantly comprise commitments funded by the company; no pension funds exist.<br />
In addition, employees have an opportunity to accumulate further old-age provision by way of<br />
deferred compensation through membership of HDI-Gerling Pensionskasse AG. The benefi ts<br />
provided by HDI-Gerling Pensionskasse AG are guaranteed for its members and their surviving<br />
dependants and comprise traditional pension plans with bonus increases as well as unit-linked<br />
hybrid annuities. Employees of the former Gerling Group also have the option of obtaining pension<br />
commitments through deferred compensation with Gerling Versorgungskasse VVaG. In this case<br />
the employer companies meet the administrative expenses and assume responsibility for ensuring<br />
that the life insurance contracts can be fulfi lled through their liability to make additional contributions.<br />
Provisions for pensions are established in accordance with IAS 19 “Employee Benefi ts” using the<br />
Projected Unit Credit Method. They are established in accordance with actuarial principles and<br />
make allowance for the length of service and estimated rate of compensation increase of pension<br />
benefi ciaries. The benefi t entitlements are discounted using a single Group-wide blended rate of<br />
interest.<br />
The pension commitments are measured on the basis of the following assumptions:<br />
2010 2009<br />
Measurement parameters/assumptions weighted in %<br />
Discount rate 4.52 5.31<br />
Projected long-term yield on plan assets 5.78 6.08<br />
2010 2009<br />
Measurement parameters/assumptions<br />
Figures in %<br />
Rate of compensation<br />
Germany USA UK Other Germany USA UK Other<br />
increase 2.75 — — 2.5–5.0 3 — 4.75 2.5–5.2<br />
Indexation 2 2 3.4 2.0–3.0 2.25 2 3.25 2.0–3.0<br />
223
224 <strong>Talanx</strong> Group Financial report 2010<br />
The change in the projected benefi t obligation of the pension commitments for the various defi ned<br />
benefi t plans of the Group was as follows:<br />
Change in the projected benefi t obligation<br />
Figures in EUR million<br />
2010 2009<br />
Projected benefi t obligation at 01.01. of the year under review 1,424 1,246<br />
Current service cost 12 14<br />
Interest cost 74 76<br />
Deferred compensation 1 2<br />
Actuarial gain/loss 131 113<br />
Currency translation 5 42<br />
Benefi ts paid during the year –68 –66<br />
Past service cost 1 —<br />
Business combinations, divestitures and other activities –1 –1<br />
Plan curtailments — –2<br />
Projected benefi t obligation at 31.12. of the year under review 1,579 1,424<br />
The funded status of the defi ned benefi t obligation is shown in the following table:<br />
Change in the projected benefi t obligation<br />
Figures in EUR million<br />
2010 2009<br />
Projected benefi t obligation from unfunded plans 1,506 1,366<br />
Projected benefi t obligation from wholly or partially funded plans 73 58<br />
Projected benefi t obligation at 31.12. of the year under review 1,579 1,424<br />
Fair value of plan assets –82 –70<br />
Funded status 1,497 1,354<br />
The fair value of the plan assets developed as follows:<br />
Change in plan assets<br />
Figures in EUR million<br />
2010 2009<br />
Fair value at 01.01. of the year under review 70 57<br />
Expected return on plan assets 3 2<br />
Actuarial gain/loss 7 6<br />
Currency translation 4 3<br />
Employer contributions 4 4<br />
Benefi ts paid during the year –3 –2<br />
Eff ect of plan settlements –3 —<br />
Business combinations, divestitures and other activities — —<br />
Fair value at 31.12. of the year under review 82 70
Notes Notes on the consolidated balance sheet – liabilities<br />
The structure of the asset portfolio underlying the plan assets was as follows:<br />
Portfolio structure of plan assets<br />
as % of plan assets<br />
2010 2009<br />
Fixed-income securities 54 54<br />
Equities 18 19<br />
Other 28 27<br />
Total 100 100<br />
The expected long-term return on plan assets per asset class is based on studies of historical and<br />
estimated future rates of return.<br />
The fair value of plan assets as at the balance sheet date included amounts totaling EUR 33 (30) million<br />
for own fi nancial instruments.<br />
The actual return on the plan assets amounted to EUR 3 (5) million in the year under review.<br />
The following table presents a reconciliation of the defi ned benefi t obligations with the provisions<br />
for pensions recognized as at the balance sheet date:<br />
Funded status of the defi ned benefi t obligation<br />
Figures in EUR million<br />
2010 2009<br />
Defi ned benefi t obligations at 31.12. of the year under review 1,579 1,424<br />
Fair value of plan assets at 31.12. of the year under review –82 –70<br />
Funded status at 31.12. of the year under review 1,497 1,354<br />
Unrealized actuarial gain/loss –180 –56<br />
Unrecognized past service cost –1 —<br />
Net provisions for pensions at 31.12. of the year under review 1,316 1,298<br />
The recognized provision for pensions developed as follows in the year under review:<br />
Change in the provisions for pensions<br />
Figures in EUR million<br />
2010 2009<br />
Net provisions for pensions at 01.01. of the year under review 1,298 1,272<br />
Currency translation 1 —<br />
Change in consolidated group –6 —<br />
Net periodic pension cost 92 92<br />
Deferred compensation — —<br />
Amounts paid during the year –2 –3<br />
Benefi ts paid during the year –68 –66<br />
Reclassifi cation and other movements 1 3<br />
Disposal groups pursuant to IFRS 5 — —<br />
Net provisions for pensions at 31.12. of the year under review 1,316 1,298<br />
225
226 <strong>Talanx</strong> Group Financial report 2010<br />
The components of the net periodic pension cost for defi ned benefi t plans recognized in the statement<br />
of income were as follows:<br />
Net periodic pension cost<br />
Figures in EUR million<br />
2010 2009<br />
Current service cost for the year under review 12 13<br />
Interest cost 74 76<br />
Expected return on plan assets –3 –2<br />
Recognized actuarial gain/loss 9 7<br />
Past service cost — —<br />
Eff ect of plan curtailments — –2<br />
Net periodic pension cost for the year under review 92 92<br />
For the 2011 fi nancial year the Group anticipates employer contributions of EUR 2 (3) million, which<br />
will be paid into the defi ned benefi t plans shown here.<br />
The net periodic pension cost was recognized in the consolidated statement of income in amounts<br />
of EUR 12 (14) million under acquisition costs and administrative expenses, EUR 79 (77) million<br />
under other expenses and EUR 1 (1) million under other investment expenses.<br />
Defi ned contribution plans are funded via external pension funds or similar institutions. In this<br />
case fi xed contributions (e.g. based on the relevant income) are paid to these institutions and the<br />
pension benefi ciary’s claim is against the said institution; in eff ect, the employer has no further obligation<br />
beyond payment of the contributions. The expense recognized for these obligations in the<br />
year under review amounted to EUR 4 (4) million, of which only a minimal amount was attributable<br />
to commitments to employees in key positions.<br />
(23) Provisions for taxes<br />
The provisions for taxes can be broken down as follows:<br />
2010 2009<br />
Figures in EUR million<br />
Provision for income tax 569 639<br />
Other tax provisions 174 132<br />
Total 743 771
(24) Sundry provisions<br />
Notes Notes on the consolidated balance sheet – liabilities<br />
The sundry provisions, which are measured by the likely amounts used, developed as follows:<br />
Restructuring/<br />
Integration<br />
Assumption<br />
of<br />
third-party<br />
pension<br />
commitments<br />
in<br />
return for<br />
payment<br />
Bonuses<br />
and<br />
incentives<br />
Anniversary<br />
bonuses<br />
Early retirement/<br />
partial<br />
retirement<br />
arrangements<br />
Other<br />
personnel<br />
expenses<br />
Outstanding<br />
invoices Other Total<br />
Figures in EUR million<br />
Balance at 01.01.2009 47 75 55 24 54 23 72 175 525<br />
Change in consolidated group — — — — — — — — —<br />
Additions 1 — 49 6 17 48 96 74 291<br />
Utilization 30 — 42 2 3 26 66 37 206<br />
Release — — 2 — 1 1 6 14 24<br />
Change in fair value of plan assets — — — — –9 — — — –9<br />
Other changes — — — — — — — — —<br />
Currency exchange rate diff erences — — — — — –1 –1 — –2<br />
Balance at 31.12.2009 18 75 60 28 58 43 95 198 575<br />
Change in consolidated group — — — — — — — — —<br />
Additions 16 — 52 1 15 54 196 250 584<br />
Utilization 7 — 44 3 13 32 160 123 382<br />
Release 2 — 6 — — 1 9 125 143<br />
Change in fair value of plan assets — — — — –1 — — — –1<br />
Other changes –6 — –2 — –3 5 –5 75 64<br />
Currency exchange rate diff erences — — –1 — — –1 –1 –2 –5<br />
Balance at 31.12.2010 19 75 59 26 56 68 116 273 692<br />
Reclassifi cations in accordance with IFRS 5 in an amount of EUR 9 million were carried under the<br />
“Other changes” in 2010. In addition, a sundry provision of EUR 55 million was established for<br />
expenses from the valuation of the disposal group (item: Other); for further explanation please see<br />
the section “Non-current assets held for sale and disposal groups”, pages 164 et seq.<br />
227
228 <strong>Talanx</strong> Group Financial report 2010<br />
(25) Notes payable and loans<br />
In this item the Group reports loan liabilities of EUR 747 (675) million, chiefl y in connection with the<br />
fi nancing of acquired interests or other investment activities.<br />
The rise of EUR 72 million in the liabilities to EUR 747 million in the year under review is attributable<br />
solely to the Non-Life Reinsurance segment and results from increased borrowing requirements<br />
as a consequence of the investment activities of Hannover Re Real Estate Holdings, Inc. The largest<br />
loan in a nominal amount of EUR 68 million runs until March 2015.<br />
In addition, loans of EUR 559 million are apportionable to the Corporate Operations segment and<br />
are connected above all with the fi nancing of interests acquired in 2007 (purchase of all shares<br />
of BHW Lebensversicherung AG and BHW Pensionskasse AG as well as increase in the interests<br />
held in the PB insurers to 100%). <strong>Talanx</strong> AG took out a fl oating-rate bank liability in an amount of<br />
EUR 550 million in order to fi nance these acquisitions. The Group uses derivative fi nancial instruments<br />
to hedge the interest rate risk (for further information see item 12 of the Notes, subsection<br />
“Hedge accounting”, page 209). A further EUR 9 million is attributable to a bearer debenture issued<br />
in 2003 with a term until July 2013. The interest expenditures (EUR 8 million) resulting from these<br />
liabilities are recognized under the item “Financing costs”.<br />
The net result from notes payable and loans is EUR 15 (14) million and consists solely of interest<br />
expenditures including amortization of EUR 1 (—) million.<br />
The carrying amount of this item corresponds to the amortized cost. Cash outfl ows occur annually<br />
until fi nal maturity in the amount of the interest payments. The total amount does not include any<br />
liabilities with a maturity of less than one year (see also the subsection “Management of liquidity<br />
risks” in the section “Nature of risks associated with insurance contracts and fi nancial instruments”,<br />
pages 184 et seqq.).
(26) Other liabilities<br />
Notes Notes on the consolidated balance sheet – liabilities<br />
2010 2009<br />
Figures in EUR million<br />
Liabilities under direct written insurance business 2,155 2,237<br />
thereof to <strong>policy</strong>holders 1,548 1,659<br />
thereof to insurance intermediaries 607 578<br />
Reinsurance payable 1,968 1,570<br />
Liabilities due to banks — 57<br />
Trade accounts payable 68 39<br />
Liabilities relating to investments 145 206<br />
Liabilities under non-group lead business 71 35<br />
Liabilities from derivatives 234 72<br />
thereof negative fair values from derivative hedging instruments 149 42<br />
Deferred income 26 27<br />
Interest 15 11<br />
Liabilities due to social insurance institutions 11 11<br />
Other liabilities 165 296<br />
Balance at 31.12. of the year under review 4,858 4,561<br />
In the year under review <strong>Talanx</strong> AG paid back liabilities due to banks in an amount of EUR 57 million.<br />
Explanatory remarks on the maturities of the fi nancial instruments included in the other liabilities<br />
are provided in the section “Nature of risks associated with insurance contracts and fi nancial instruments”.<br />
Detailed information on liabilities from derivatives is provided in item 12 of the Notes,<br />
page 208.<br />
229
230 <strong>Talanx</strong> Group Financial report 2010<br />
(27) Deferred taxes<br />
The following table presents a breakdown of the deferred tax assets and liabilities into the balance<br />
sheet items from which they are derived.<br />
31.12.2010 31.12.2009 1)<br />
Figures in EUR million<br />
Deferred tax assets<br />
Loss and loss adjustment expense reserves 338 251<br />
Technical provisions 290 269<br />
Loss carry-forwards 306 271<br />
Benefi t reserves 50 52<br />
Provisions 208 132<br />
Accounts receivable on insurance business 12 20<br />
Investments 68 54<br />
Contract deposits 309 537<br />
Premium refunds 13 14<br />
Other invested assets 3 14<br />
Value adjustment –180 –267<br />
Other 400 232<br />
Total 1,817 1,579<br />
Deferred tax liabilities<br />
Equalization reserve 1,088 1,060<br />
Deferred acquisition costs2) 488 511<br />
Contract deposits 51 96<br />
Accounts receivable on insurance business 381 99<br />
Present value of future profi ts (PVFP) 302 285<br />
Benefi t reserves 167 342<br />
Technical provisions 47 95<br />
Investments 197 191<br />
Loss and loss adjustment expense reserves 30 59<br />
Other invested assets 63 23<br />
Debt consolidation 18 12<br />
Provisions 55 16<br />
Other 95 64<br />
Total 2,982 2,853<br />
Deferred tax liabilities (net) 1,165 1,274<br />
1) Adjusted on the basis of IAS 8<br />
2) The deferred taxes on deferred acquisition costs are shown for net, i.e. aft er allowance for the shares of reinsurers.<br />
The deferred tax assets and deferred tax liabilities were recognized as follows:<br />
31.12.2010 31.12.2009<br />
Figures in EUR million<br />
Deferred tax assets 268 235<br />
Deferred tax liabilities 1,433 1,509<br />
Deferred tax liabilities (net) 1,165 1,274
2010 1)<br />
Notes Notes on the consolidated balance sheet – liabilities. Notes on the consolidated statement of income<br />
(28) Net premium earned<br />
The gross written premium includes the savings elements of premiums under unit-linked life<br />
and annuity policies. These savings elements were eliminated from the net premium earned.<br />
Industrial<br />
Lines<br />
Retail<br />
Germany<br />
Retail<br />
International<br />
Non-Life<br />
Reinsurance<br />
Life/Health<br />
Reinsurance Total<br />
Figures in EUR million<br />
Gross written premium including<br />
premium from unit-linked life and<br />
annuity insurance<br />
Savings elements of premium from<br />
3,048 6,802 2,233 5,973 4,813 22,869<br />
unit-linked life and annuity insurance — 932 207 — — 1,139<br />
Ceded written premium 1,363 210 88 692 414 2,767<br />
Change in gross unearned premium 41 45 18 –276 –13 –185<br />
Change in ceded unearned premium 42 –6 28 –39 — 25<br />
Net premium earned 1,684 5,711 1,928 5,044 4,386 18,753<br />
2009 1)<br />
Industrial<br />
Lines<br />
Retail<br />
Germany<br />
Retail<br />
International<br />
Non-Life<br />
Reinsurance<br />
Life/Health<br />
Reinsurance Total<br />
Figures in EUR million<br />
Gross written premium including<br />
premium from unit-linked life and<br />
annuity insurance<br />
Savings elements of premium from<br />
3,062 6,596 1,827 5,281 4,157 20,923<br />
unit-linked life and annuity insurance — 835 144 — — 979<br />
Ceded written premium 1,402 271 110 332 415 2,530<br />
Change in gross unearned premium 20 167 –32 –193 –29 –67<br />
Change in ceded unearned premium –39 86 –6 –20 3 24<br />
Net premium earned 1,719 5,571 1,547 4,776 3,710 17,323<br />
1) Presentation aft er elimination of intra-Group relations<br />
Notes on the consolidated<br />
statement of income<br />
231
232 <strong>Talanx</strong> Group Financial report 2010<br />
2010 1)<br />
(29) Investment income<br />
Industrial<br />
Lines<br />
Retail<br />
Germany<br />
Retail<br />
International<br />
Non-Life<br />
Reinsurance<br />
Life/Health<br />
Reinsurance<br />
Corporate<br />
Operations Total<br />
Figures in EUR million<br />
Income from real estate 7 51 1 32 — — 91<br />
Dividends2) 9 23 3 6 1 7 49<br />
Current interest income3) 208 1,463 119 634 189 3 2,616<br />
Other income 3 11 — 9 2 1 26<br />
Ordinary investment income 227 1,548 123 681 192 11 2,782<br />
Appreciation — 10 — 27 — — 37<br />
Realized gains on investments 24 191 26 207 39 3 490<br />
Unrealized gains on investments 3 21 24 12 14 — 74<br />
Investment income 254 1,770 173 927 245 14 3,383<br />
Realized losses on investments 10 28 3 55 9 — 105<br />
Unrealized losses on investments 1 12 6 44 23 — 86<br />
Total 11 40 9 99 32 — 191<br />
Impairments/depreciation on investment<br />
property<br />
Scheduled 1 7 — 7 — — 15<br />
Unscheduled — 6 — — — — 6<br />
Impairments on equity securities<br />
Impairments on fi xed-income<br />
2 28 8 1 — 6 45<br />
securities — 9 — 8 — — 17<br />
Impairments on other investments<br />
Expenses for the administration of<br />
3 18 — 8 — 3 32<br />
investments 4 11 1 9 2 98 125<br />
Other expenses<br />
Other investment expenses/<br />
8 17 1 25 2 2 55<br />
impairments 18 96 10 58 4 109 295<br />
Investment expenses<br />
Net income from investments under<br />
29 136 19 157 36 109 486<br />
own management 225 1,634 154 770 209 –95 2,897<br />
Interest income on funds withheld<br />
and contract deposits<br />
Interest expense on funds<br />
— — — 19 406 — 425<br />
withheld and contract deposits<br />
Net interest income on funds<br />
1 24 — 7 113 — 145<br />
withheld and contract deposits –1 –24 — 12 293 — 280<br />
Net investment income 224 1,610 154 782 502 –95 3,177<br />
1) Adjusted on the basis of IAS 8; presentation aft er elimination of intra-Group relations between segments<br />
2) The profi t or loss on investments in associated companies amounts to EUR 2 million and was recognized under dividends in 2010;<br />
the previous year was adjusted accordingly<br />
3) Amortization amounts fr om diff erences on fi xed-income investments are recognized under current interest income (previously “Other income”);<br />
the previous year was adjusted accordingly
2009 1)<br />
Industrial<br />
Lines<br />
Retail<br />
Germany<br />
Retail<br />
International<br />
Non-Life<br />
Reinsurance<br />
Notes Notes on the consolidated statement of income<br />
Life/Health<br />
Reinsurance<br />
Corporate<br />
Operations Total<br />
Figures in EUR million<br />
Income from real estate 4 54 2 5 — — 65<br />
Dividends2) 6 36 4 –3 — 8 51<br />
Current interest income3) 209 1,357 116 606 162 7 2,457<br />
Other income 5 17 — 10 2 — 34<br />
Ordinary investment income 224 1,464 122 618 164 15 2,607<br />
Appreciation — — — 21 — — 21<br />
Realized gains on investments 68 240 20 154 30 8 520<br />
Unrealized gains on investments 4 31 6 18 114 — 173<br />
Investment income 296 1,735 148 811 308 23 3,321<br />
Realized losses on investments 44 165 6 59 10 — 284<br />
Unrealized losses on investments 1 88 1 25 6 — 121<br />
Total 45 253 7 84 16 — 405<br />
Impairments/depreciation on<br />
investment property<br />
Scheduled 2 7 — — — — 9<br />
Unscheduled — 7 — 1 — — 8<br />
Impairments on equity securities<br />
Impairments on fi xed-income<br />
1 95 8 3 — 5 112<br />
securities 3 47 5 46 — — 101<br />
Impairments on other investments<br />
Expenses for the administration of<br />
7 28 1 87 — — 123<br />
investments 3 12 — 8 2 80 105<br />
Other expenses<br />
Other investment expenses/<br />
4 16 2 17 1 — 40<br />
impairments 20 212 16 162 3 85 498<br />
Investment expenses<br />
Net income from investments under<br />
65 465 23 246 19 85 903<br />
own management 231 1,270 125 565 289 –62 2,418<br />
Interest income on funds withheld and<br />
contract deposits<br />
Interest expense on funds withheld<br />
1 2 1 46 397 — 447<br />
and contract deposits<br />
Net interest income on funds withheld<br />
1 27 — 10 169 — 207<br />
and contract deposits — –25 1 36 228 — 240<br />
Net investment income 231 1,245 126 601 517 –62 2,658<br />
1) Adjusted on the basis of IAS 8; presentation aft er elimination of intra-Group relations between segments<br />
2) The profi t or loss on investments in associated companies amounts to –EUR 6 million and was recognized under dividends in 2010;<br />
the previous year was adjusted accordingly<br />
3) Amortization amounts fr om diff erences on fi xed-income investments are recognized under current interest income (previously “Other income”);<br />
the previous year was adjusted accordingly<br />
233
234 <strong>Talanx</strong> Group Financial report 2010<br />
2010 1)<br />
Of the unscheduled impairments totaling EUR 100 (344) million, an amount of EUR 32 (123) million<br />
was attributable to other investments, including EUR 7 (93) million on alternative investments.<br />
The impairments on fi xed-income securities of EUR 17 (101) million were taken predominantly on<br />
structured assets. A further EUR 45 (112) million in impairment losses were recognized on equity<br />
holdings. This contrasted with appreciation of EUR 37 (21) million on investments that had been<br />
written down in previous periods; of this total volume, EUR 3 (11) million was attributable to alternative<br />
assets and EUR 24 (10) million to fi xed-income securities.<br />
Net gains and losses on investments<br />
The net gains and losses on investments shown in the following table are based largely on the<br />
classes established by the Group (see here “Classes of fi nancial instruments” in the section “Nature<br />
of risks associated with insurance contracts and fi nancial instruments”, pages 166 et seq.).<br />
Making allowance for expenses for the administration of investments (EUR 125 (105) million) and<br />
other expenses (EUR 55 (40) million), the total net investment income as at the balance sheet date<br />
amounted to EUR 3,177 (2,658) million.<br />
Ordinary<br />
investment<br />
income<br />
Amor tization<br />
Gains on<br />
disposal<br />
Losses on<br />
disposal<br />
Impairments<br />
Appreciation<br />
Unrealized<br />
gains<br />
Unrealized<br />
losses Total 2)<br />
Figures in EUR million<br />
Investments in affi liated companies<br />
and participating interests 3 — — — 3 — — — —<br />
Loans and receivables 1,265 79 53 20 10 3 — — 1,370<br />
Financial assets held to maturity<br />
Financial assets available for sale<br />
120 — — — — — — — 120<br />
Fixed-income securities 1,036 20 251 42 8 30 — — 1,287<br />
Variable-yield securities<br />
Financial assets at fair value through<br />
profi t or loss<br />
Financial assets classifi ed at fair<br />
value through profi t or loss<br />
65 — 121 16 51 — — — 119<br />
Fixed-income securities 42 — 23 3 — — 45 24 83<br />
Variable-yield securities<br />
Financial assets held for trading<br />
— — — — — — 2 — 2<br />
Fixed-income securities 4 — — — — — 1 — 5<br />
Variable-yield securities — — 3 1 — — — 1 1<br />
Derivatives<br />
Other invested assets, insofar as they<br />
4 — 23 23 — — 20 2 22<br />
are fi nancial assets 29 — 7 — 22 4 4 — 22<br />
Other1) 109 6 9 — 21 — 2 59 46<br />
Investments under own management<br />
Funds held by ceding companies/<br />
2,677 105 490 105 115 37 74 86 3,077<br />
funds held under reinsurance treaties 280 — — — — — — — 280<br />
Total 2,957 105 490 105 115 37 74 86 3,357<br />
1) For the purposes of reconciliation with the consolidated statement of income, the “Other” item combines the gains on investment property, associated companies and<br />
derivative fi nancial instruments – insofar as the fair values are negative; derivatives held for hedging purposes within the scope of hedge accounting (see item 12 of the<br />
Notes) are not included in the list if they do not relate to hedges in the area of investments<br />
2) Excluding expenses for the administration of investments and other expenses
2009 1)<br />
Ordinary<br />
investment<br />
income<br />
Amor tization<br />
Gains on<br />
disposal<br />
Losses on<br />
disposal<br />
Notes Notes on the consolidated statement of income<br />
Impairments<br />
Appreciation<br />
Unrealized<br />
gains /<br />
losses 2) Total 3)<br />
Figures in EUR million<br />
Investments in affi liated companies<br />
and participating interests 3 — 1 — — — — 4<br />
Loans and receivables 1,203 64 22 20 31 — — 1,238<br />
Financial assets held to maturity<br />
Financial assets available for sale<br />
100 4 — 3 1 — — 100<br />
Fixed-income securities 965 24 233 81 69 10 — 1,082<br />
Variable-yield securities<br />
Financial assets at fair value through<br />
profi t or loss<br />
Financial assets classifi ed at fair<br />
value through profi t or loss<br />
76 — 131 75 145 — — –13<br />
Fixed-income securities 36 12 6 1 — — –30 23<br />
Variable-yield securities<br />
Financial assets held for trading<br />
— — — 1 — — –7 –8<br />
Fixed-income securities 1 — — — — — — 1<br />
Variable-yield securities 1 — 2 3 — — 1 1<br />
Derivatives<br />
Other invested assets, insofar as they<br />
2 — 106 87 — — 36 57<br />
are fi nancial assets 39 1 — — 88 11 — –37<br />
Other1) 75 3 19 13 20 — 52 116<br />
Investments under own management<br />
Funds held by ceding companies/<br />
2,501 108 520 284 354 21 52 2,564<br />
funds held under reinsurance treaties 240 — — — — — — 240<br />
Total 2,741 108 520 284 354 21 52 2,804<br />
1) For the purposes of reconciliation with the consolidated statement of income, the “Other” item combines the gains on investment property, associated companies and<br />
derivative fi nancial instruments – insofar as the fair values are negative; derivatives held for hedging purposes within the scope of hedge accounting (see item 12 of the<br />
Notes) are not included in the list if they do not relate to hedges in the area of investments<br />
2) The unrealized gains and losses were shown combined in 2009; separate presentation would have required disproportionate eff ort and had therefore been omitted<br />
3) Excluding expenses for the administration of investments and other expenses<br />
The interest income on investments was as follows in the year under review:<br />
Interest income on investments<br />
Figures in EUR million<br />
2010 2009<br />
Loans and receivables 1,344 1,267<br />
Financial assets – held to maturity 120 104<br />
Financial assets – available for sale<br />
Financial assets – at fair value through profi t or loss<br />
1,056 989<br />
Financial assets classifi ed at fair value through profi t or loss 42 48<br />
Financial assets held for trading 4 1<br />
Other 41 44<br />
Total 2,607 2,453<br />
235
236 <strong>Talanx</strong> Group Financial report 2010<br />
2010 1)<br />
(30) Claims and claims expenses<br />
Industrial<br />
Lines<br />
Retail<br />
Germany<br />
Retail<br />
International<br />
Non-Life<br />
Reinsurance<br />
Life/Health<br />
Reinsurance Total<br />
Figures in EUR million<br />
Gross<br />
Claims and claims expenses paid<br />
Change in loss and loss adjustment<br />
1,974 3,721 1,128 3,380 3,157 13,360<br />
expense reserve 73 –2 159 772 174 1,176<br />
Change in benefi t reserve — 1,461 229 — 744 2,434<br />
Expenses for premium refunds 4 824 12 — — 840<br />
Total 2,051 6,004 1,528 4,152 4,075 17,810<br />
Reinsurers’ share<br />
Claims and claims expenses paid<br />
Change in loss and loss adjustment<br />
799 119 43 468 274 1,703<br />
expense reserve –57 68 17 –7 –4 17<br />
Change in benefi t reserve — –53 — — 41 –12<br />
Expenses for premium refunds 1 — 3 — — 4<br />
Total 743 134 63 461 311 1,712<br />
Net<br />
Claims and claims expenses paid<br />
Change in loss and loss adjustment<br />
1,175 3,602 1,085 2,912 2,883 11,657<br />
expense reserve 130 –70 142 779 178 1,159<br />
Change in benefi t reserve — 1,514 229 — 703 2,446<br />
Expenses for premium refunds 3 824 9 — — 836<br />
Total 1,308 5,870 1,465 3,691 3,764 16,098<br />
1) Presentation aft er elimination of intra-Group relations
1), 2) 2009<br />
Industrial<br />
Lines<br />
Retail<br />
Germany<br />
Retail<br />
International<br />
Notes Notes on the consolidated statement of income<br />
Non-Life<br />
Reinsurance<br />
Life/Health<br />
Reinsurance Total<br />
Figures in EUR million<br />
Gross<br />
Claims and claims expenses paid<br />
Change in loss and loss adjustment<br />
2,033 3,791 954 3,440 2,422 12,640<br />
expense reserve –257 –102 63 –31 439 112<br />
Change in benefi t reserve — 1,168 220 — 579 1,967<br />
Expenses for premium refunds 7 366 9 — — 382<br />
Total 1,783 5,223 1,246 3,409 3,440 15,101<br />
Reinsurers’ share<br />
Claims and claims expenses paid<br />
Change in loss and loss adjustment<br />
1,032 254 39 331 164 1,820<br />
expense reserve –387 –60 16 –365 47 –749<br />
Change in benefi t reserve — –47 –1 — 18 –30<br />
Expenses for premium refunds 1 — 1 — — 2<br />
Total 646 147 55 –34 229 1,043<br />
Net<br />
Claims and claims expenses paid<br />
Change in loss and loss adjustment<br />
1,001 3,537 915 3,109 2,258 10,820<br />
expense reserve 130 –42 47 334 392 861<br />
Change in benefi t reserve — 1,215 221 — 561 1,997<br />
Expenses for premium refunds 6 366 8 — — 380<br />
Total 1,137 5,076 1,191 3,443 3,211 14,058<br />
1) Presentation aft er elimination of intra-Group relations<br />
2) Adjusted on the basis of IAS 8<br />
237
238 <strong>Talanx</strong> Group Financial report 2010<br />
2010 1)<br />
(31) Acquisition costs and administrative expenses<br />
Industrial<br />
Lines<br />
Retail<br />
Germany<br />
Retail<br />
International<br />
Non-Life<br />
Reinsurance<br />
Life/Health<br />
Reinsurance Total<br />
Figures in EUR million<br />
Gross<br />
Payments 363 980 374 1,287 821 3,825<br />
Change in deferred acquisition costs –30 –92 161 –14 17 42<br />
Total acquisition costs 333 888 535 1,273 838 3,867<br />
Administrative expenses<br />
Total acquisition costs and<br />
230 389 122 163 116 1,020<br />
administrative expenses 563 1,277 657 1,436 954 4,887<br />
Reinsurers’ share<br />
Payments 213 56 30 91 53 443<br />
Change in deferred acquisition costs –17 23 26 –4 44 72<br />
Total acquisition costs 196 79 56 87 97 515<br />
Net<br />
Payments 150 924 344 1,196 768 3,382<br />
Change in deferred acquisition costs –13 –115 135 –10 –27 –30<br />
Total acquisition costs 137 809 479 1,186 741 3,352<br />
Administrative expenses<br />
Total acquisition costs and<br />
230 389 122 163 116 1,020<br />
administrative expenses 367 1,198 601 1,349 857 4,372<br />
1) Presentation aft er elimination of intra-Group relations
2009 1)<br />
Industrial<br />
Lines<br />
Retail<br />
Germany<br />
Retail<br />
International<br />
Notes Notes on the consolidated statement of income<br />
Non-Life<br />
Reinsurance<br />
Life/Health<br />
Reinsurance Total<br />
Figures in EUR million<br />
Gross<br />
Payments 386 996 312 1,108 777 3,579<br />
Change in deferred acquisition costs 11 195 69 –36 –25 214<br />
Total acquisition costs 397 1,191 381 1,072 752 3,793<br />
Administrative expenses<br />
Total acquisition costs and<br />
220 397 97 152 95 961<br />
administrative expenses 617 1,588 478 1,224 847 4,754<br />
Reinsurers’ share<br />
Payments 238 73 40 37 43 431<br />
Change in deferred acquisition costs 6 201 2 –2 72 279<br />
Total acquisition costs 244 274 42 35 115 710<br />
Net<br />
Payments 148 923 272 1,071 734 3,148<br />
Change in deferred acquisition costs 5 –6 67 –34 –97 –65<br />
Total acquisition costs 153 917 339 1,037 637 3,083<br />
Administrative expenses<br />
Total acquisition costs and<br />
220 397 97 152 95 961<br />
administrative expenses 373 1,314 436 1,189 732 4,044<br />
1) Presentation aft er elimination of intra-Group relations<br />
239
240 <strong>Talanx</strong> Group Financial report 2010<br />
(32) Other income/expenses<br />
2010 2009 1)<br />
Figures in EUR million<br />
Other non-technical income<br />
Exchange gains 262 206<br />
Income from the recognition of negative goodwill — 93<br />
Income from services 164 151<br />
Reversals of impairments on receivables<br />
Income from contracts recognized in accordance with the deposit<br />
98 107<br />
accounting method 50 40<br />
Profi ts from the disposal of property, plant and equipment 9 1<br />
Income from the release of other non-technical provisions 143 24<br />
Interest income 44 36<br />
Commission income 57 47<br />
Rental income 30 32<br />
Income from the repurchase of own securities 4 30<br />
Sundry income 86 200<br />
Total 947 967<br />
Other non-technical expenses<br />
Exchange losses 120 94<br />
Other interest expenses 158 153<br />
Depreciation and impairments 110 153<br />
Expenses for the company as a whole 182 177<br />
Expenses for services 227 167<br />
Other taxes 51 20<br />
Expenses from the recognition of disposal groups 55 —<br />
Sundry expenses 136 241<br />
Total 1,039 1,005<br />
Other income/expenses –92 –38<br />
1) Adjusted on the basis of IAS 8<br />
The sundry income includes a profi t of EUR 9 million from the sale of Euro International Reinsurance<br />
S. A., Luxembourg (see here also our remarks in the section “Consolidation”, page 158).
(33) Goodwill impairments<br />
Notes Notes on the consolidated statement of income<br />
The goodwill impairments totaling EUR 17 (92) million are attributable entirely to the Retail International<br />
segment. For further information please see our remarks in the item of the Notes 1 “Goodwill”,<br />
pages 187 et seqq.<br />
(34) Financing costs<br />
The fi nancing costs of EUR 134 (133) million consist exclusively of interest expenses from the raising<br />
of borrowed capital not directly connected with operational insurance business. These interest expenses<br />
are attributable in an amount of EUR 126 million to our issued subordinated liabilities and<br />
in an amount of EUR 8 million to notes payable and loans.<br />
241
242 <strong>Talanx</strong> Group Financial report 2010<br />
(35) Taxes on income<br />
This item includes domestic income tax as well as comparable taxes on income incurred by foreign<br />
subsidiaries. The determination of the income tax includes the calculation of deferred taxes. The<br />
principles used to recognize deferred taxes are set out in the subsection entitled “Summary of<br />
major accounting policies”. Deferred taxes are established on retained earnings of major affi liated<br />
companies in cases where a distribution is concretely planned.<br />
The actual and deferred taxes on income can be broken down as follows:<br />
Income tax 2010 2009 1)<br />
Figures in EUR million<br />
Actual tax for the year under review 416 370<br />
Actual tax for other periods –79 24<br />
Deferred taxes due to temporary diff erences –27 74<br />
Deferred taxes from loss carry-forwards –82 1<br />
Change in deferred taxes due to changes in tax rates — 2<br />
Recognized tax expenditure 228 471<br />
1) Adjusted on the basis of IAS 8<br />
Domestic/foreign breakdown of recognized tax expenditure/income 2010 2009 1)<br />
Figures in EUR million<br />
Current taxes 337 394<br />
Germany 249 306<br />
Outside Germany 88 88<br />
Deferred taxes –109 77<br />
Germany –123 100<br />
Outside Germany 14 –23<br />
Total 228 471<br />
1) Adjusted on the basis of IAS 8<br />
The revenue authority took the view that not inconsiderable investment income generated by the<br />
Group’s reinsurance subsidiaries domiciled in Ireland was subject to taxation as foreign-sourced income<br />
at the parent company in Germany on the basis of the provisions of the Foreign Transactions<br />
Tax Act. Appeals were fi led against the relevant tax assessments – also with respect to amounts<br />
already recognized as a tax expense. Our opinion that the investment income was not subject to<br />
taxation in Germany was confi rmed in lower court proceedings and in a procedure before the Federal<br />
Fiscal Court (BFH) for the 1996 assessment period. The corresponding basic assessments have<br />
in some cases already been cancelled by the revenue authority, and the remaining cancellation<br />
assessments will be issued shortly.<br />
The actual and deferred taxes recognized directly in equity in the fi nancial year – resulting from<br />
items charged or credited directly to equity – amounted to –EUR 20 (–94) million.
Notes Notes on the consolidated statement of income<br />
The following table presents a reconciliation of the expected expense for income taxes that would<br />
be incurred upon application of the German income tax rate to the pre-tax profi t with the actual<br />
expense for taxes.<br />
2010 2009 1)<br />
Figures in EUR million<br />
Profi t before income taxes 898 1,364<br />
Expected tax rate 31.6% 31.6%<br />
Expected expense for income taxes 284 431<br />
Change in deferred rates of taxation — 1<br />
Taxation diff erences aff ecting foreign subsidiaries –42 –115<br />
Non-deductible expenses 115 152<br />
Tax-exempt income –83 –65<br />
Value adjustment 25 10<br />
Tax expense not attributable to the reporting period –84 45<br />
Other 13 12<br />
Recognized expense for income taxes 228 471<br />
1) Adjusted on the basis of IAS 8<br />
The calculation of the expected expense for income taxes is based on the German income tax rate<br />
of 31.6%. This tax rate is made up of corporate income tax including the German reunifi cation<br />
charge and a mixed trade tax rate.<br />
The tax ratio, i.e. the ratio of the recognized tax expense to the pre-tax profi t, stood at 25.4 (34.5)% in<br />
the year under review. The tax rate corresponds to the average income tax load borne by all Group<br />
companies.<br />
Availability of capitalized loss carry-forwards<br />
No deferred taxes were established on loss carry-forwards of EUR 610 (748) million and deductible<br />
temporary diff erences of EUR 23 (87) million because their realization is not suffi ciently certain. In<br />
addition, tax credits of EUR 6 (22) million that had not been capitalized were available.<br />
Availability of loss carry-forwards and tax credits that have not been capitalized:<br />
1–5 years 6–10 years > 10 years Unlimited Total<br />
Figures in EUR million<br />
Loss carry-forwards 69 — 44 497 610<br />
Temporary diff erences — — — 23 23<br />
Tax credits 6 — — — 6<br />
Total 75 — 44 520 639<br />
Loss carry-forwards not recognized in previous years reduced the deferred expense for taxes by<br />
EUR 12 (2) million in the year under review. The devaluation of deferred tax claims recognized in<br />
previous years led to a deferred tax expense of EUR 12 (2) million in the 2010 fi nancial year.<br />
243
244 <strong>Talanx</strong> Group Financial report 2010<br />
Other information<br />
Staff<br />
The average number of staff employed throughout the year can be broken down as follows:<br />
2010 2009<br />
Primary insurance companies 15,256 14,935<br />
Reinsurance companies 2,130 1,986<br />
Companies in the Corporate Operations segment 394 431<br />
Total excluding apprentices and student trainees 17,780 17,352<br />
Apprentices and student trainees 442 453<br />
Total 18,222 17,805<br />
Expenditures on personnel<br />
Figures in EUR million<br />
Wages and salaries<br />
2010 2009<br />
Expenditures on insurance business 867 819<br />
Expenditures on the administration of investments 58 52<br />
925 871<br />
Social security contributions and expenditure on provisions and assistance<br />
Social security contributions 137 141<br />
Expenditures for pension provision 19 59<br />
Expenditures for assistance 19 12<br />
175 212<br />
Total 1,100 1,083
Related party disclosures<br />
Notes Other information<br />
IAS 24 “Related Party Disclosures” defi nes related parties inter alia as parent companies and subsidiaries,<br />
subsidiaries of a common parent company, associated companies, legal entities under the<br />
infl uence of management and the management of the company itself.<br />
The related entities within the <strong>Talanx</strong> Group are comprised of HDI Haft pfl ichtverband der<br />
Deutschen Industrie Versicherungsverein auf Gegenseitigkeit (HDI V. a. G.), which directly holds<br />
all shares of <strong>Talanx</strong>, as well as all unconsolidated subsidiaries – which essentially encompasses<br />
the subsidiaries not included in the consolidated fi nancial statement due their insignifi cant<br />
status – and the associated companies recognized at equity. In addition, there are the provident<br />
funds that pay benefi ts in favor of employees of <strong>Talanx</strong> AG or one of its related parties aft er termination<br />
of the employment relationship.<br />
The related persons are the members of the Boards of Management and Supervisory Boards of<br />
<strong>Talanx</strong> AG and HDI V. a. G. Transactions between <strong>Talanx</strong> and its subsidiaries or between subsidiaries<br />
of <strong>Talanx</strong> AG are eliminated through consolidation and hence not discussed in the Notes. Business<br />
relations existing with unconsolidated companies or with associated companies are of minor<br />
importance overall.<br />
For details of the remuneration received by the members of the Board of Management and Supervisory<br />
Board of <strong>Talanx</strong> AG please see the remarks on the compensation of the management boards<br />
of the parent company, pages 253 et seq.<br />
245
246 <strong>Talanx</strong> Group Financial report 2010<br />
Share-based payment<br />
With eff ect from 1 January 2000 the Executive Board of Hannover Re, with the consent of the<br />
Supervisory Board, introduced a virtual stock option plan that provides for the granting of stock<br />
appreciation rights to certain managerial staff . The content of the stock option plan is based solely<br />
on the Conditions for the Granting of Stock Appreciation Rights. All the members of the Hannover<br />
Re Group’s senior management are eligible for the award of stock appreciation rights. Exercise<br />
of the stock appreciation rights does not give rise to any entitlement to the delivery of Hannover<br />
Re stock, but merely to payment of a cash amount linked to the performance of the Hannover Re<br />
share. Recognition of transactions involving stock appreciation rights with cash settlement is governed<br />
by the requirements of IFRS 2 “Share-based Payment”.<br />
Stock appreciation rights were fi rst granted for the 2000 fi nancial year and are awarded separately<br />
for each subsequent fi nancial year (allocation year), provided the performance criteria defi ned in<br />
the Conditions for the Granting of Stock Appreciation Rights are satisfi ed.<br />
The internal performance criterion is achievement of the target performance defi ned by the Supervisory<br />
Board, which is expressed in terms of the diluted earnings per share (EPS) calculated in accordance<br />
with IAS 33 “Earnings per Share”. If the target EPS is surpassed or undershot, the provisional<br />
basic number of stock appreciation rights initially granted is increased or reduced accordingly to<br />
produce the EPS basic number. The external performance criterion is the development of the share<br />
price in the allocation year. The benchmark used in this regard is the (weighted) RBS Global Reinsurance<br />
Index. This index encompasses the performance of listed reinsurers worldwide. Depending<br />
upon the outperformance or underperformance of this index, the EPS basic number is increased<br />
– albeit by at most 400% of the EPS basic number – or reduced – although by no more than 50% of<br />
the EPS basic number.<br />
The maximum period of the stock appreciation rights is ten years, commencing at the end of the<br />
year in which they are awarded. Stock appreciation rights which are not exercised by the end of<br />
the 10-year period lapse. Stock appreciation rights may only be exercised aft er a waiting period<br />
and then only within four exercise periods each year. For 40% of the stock appreciation rights (fi rst<br />
tranche of each allocation year) the waiting period is two years, for each additional 20% (tranches<br />
two to four of each allocation year) of the stock appreciation rights the waiting period is extended<br />
by one year. Each exercise period lasts for ten trading days, in each case commencing on the sixth<br />
trading day aft er the date of publication of the quarterly report of Hannover Rückversicherung AG.<br />
On 4 November 2009 the Supervisory Board of Hannover Re decided to extend the waiting period<br />
applicable to members of the Executive Board from two to four years for stock appreciation rights<br />
granted from the 2010 allocation onwards; on 23 November 2009 the Executive Board of Hannover<br />
Re decided to extend the waiting period accordingly for the other members of the Group’s senior<br />
management. Upon expiry of this waiting period a maximum 60% of the stock appreciation rights<br />
awarded for an allocation year may be exercised. The waiting period for each additional 20% of the<br />
stock appreciation rights awarded for this allocation year to a member of the managerial staff is<br />
one year.
Notes Other information<br />
Upon exercise of a stock appreciation right the amount paid out to the entitled party is the diff erence<br />
between the basic price and the current market price of the Hannover Re share at the time of<br />
exercise. In this context, the basic price corresponds to the arithmetical mean of the closing prices<br />
of the Hannover Re share on all trading days of the fi rst full calendar month of the allocation year<br />
in question. The current market price of the Hannover Re share at the time when stock appreciation<br />
rights are exercised is determined by the arithmetical mean of the closing prices of the Hannover<br />
Re share on the last 20 trading days prior to the fi rst day of the relevant exercise period.<br />
The amount paid out is limited to a maximum calculated as a quotient of the total volume of compensation<br />
to be granted in the allocation year and the total number of stock appreciation rights<br />
awarded in the year in question.<br />
In the event of cancellation of the employment relationship or termination of the employment<br />
relationship as a consequence of a termination agreement or a set time limit, a holder of stock<br />
appreciation rights is entitled to exercise all such rights in the fi rst exercise period thereaft er. Stock<br />
appreciation rights not exercised in this period and those in respect of which the waiting period<br />
has not yet expired shall lapse. Retirement, disability or death of the member of management shall<br />
not be deemed to be termination of the employment relationship for the purpose of exercising<br />
stock appreciation rights.<br />
The allocations for the years 2000, 2002 to 2004, 2006, 2007 and 2009 gave rise to the following<br />
commitments in the 2010 fi nancial year. No allocations were made for 2001, 2005 or 2008.<br />
Stock appreciation rights<br />
Allocation year<br />
of Hannover Re<br />
2009 2007 2006 2004 2003 2002 2000<br />
<strong>Award</strong> date 15.03.2010 28.03.2008 13.03.2007 24.03.2005 25.03.2004 11.04.2003 21.06.2001<br />
Period 10 Years 10 Years 10 Years 10 Years 10 Years 10 Years 10 Years<br />
Waiting period 2 Years 2 Years 2 Years 2 Years 2 Years 2 Years 2 Years<br />
Basic price (in EUR) 22.70 34.97 30.89 27.49 24.00 23.74 25.50<br />
Participants in year of issue 137 110 106 109 110 113 95<br />
Number of rights granted 1,569,855 926,565 817,788 211,171 904,234 710,429 1,138,005<br />
Fair value at 31.12.2010 (in EUR) 7.30 7.86 9.77 16.16 8.99 8.79 5.49<br />
Maximum value (in EUR) 8.76 10.79 10.32 24.62 8.99 8.79 5.49<br />
Weighted exercise price<br />
Number of rights existing at<br />
— 1.52 5.32 8.51 8.99 8.79 5.49<br />
31.12.2010<br />
Provisions at 31.12.2010<br />
1,535,600 889,858 691,751 126,622 3,316 2,365 —<br />
(in EUR million)<br />
Amounts paid out in the 2010 fi nancial<br />
3.90 6.10 6.48 2.05 0.03 0.02 —<br />
year (in EUR million)<br />
Expense in the 2010 fi nancial year<br />
— 0.02 0.50 0.25 0.49 0.07 0.01<br />
(in EUR million) 3.90 2.40 2.53 0.59 0.01 — —<br />
247
248 <strong>Talanx</strong> Group Financial report 2010<br />
In the 2010 fi nancial year the waiting period expired for 100% of the stock appreciation rights<br />
awarded in 2000 and 2002 to 2004, 60% of those awarded in 2006 and 40% of those awarded<br />
in 2007. 1,503 stock appreciation rights from the 2000 allocation year, 7,682 stock appreciation<br />
rights from the 2002 allocation year, 52,581 stock appreciation rights from the 2003 allocation year,<br />
29,832 stock appreciation rights from the 2004 allocation year, 95,380 stock appreciation rights<br />
from the 2006 allocation year and 10,399 stock appreciation rights from the 2007 allocation year<br />
were exercised. The total amount paid out stood at EUR 1.3 million.<br />
The stock appreciation rights of Hannover Re developed as follows:<br />
Development of the stock<br />
appreciation rights of Hannover Re/<br />
Allocation year<br />
Number of options<br />
2009 2007 2006 2004 2003 2002 2000<br />
Granted in 2001 — — — — — — 1,138,005<br />
Exercised in 2001 — — — — — — —<br />
Lapsed in 2001 — — — — — — —<br />
Number of options at 31.12.2001 — — — — — — 1,138,005<br />
Granted in 2002 — — — — — — —<br />
Exercised in 2002 — — — — — — —<br />
Lapsed in 2002 — — — — — — 40,770<br />
Number of options at 31.12.2002 — — — — — — 1,097,235<br />
Granted in 2003 — — — — — 710,429 —<br />
Exercised in 2003 — — — — — — —<br />
Lapsed in 2003 — — — — — 23,765 110,400<br />
Number of options at 31.12.2003 — — — — — 686,664 986,835<br />
Granted in 2004 — — — — 904,234 — —<br />
Exercised in 2004 — — — — — — 80,137<br />
Lapsed in 2004 — — — — 59,961 59,836 57,516<br />
Number of options at 31.12.2004 — — — — 844,273 626,828 849,182<br />
Granted in 2005 — — — 211,171 — — —<br />
Exercised in 2005 — — — — — 193,572 647,081<br />
Lapsed in 2005 — — — 6,397 59,834 23,421 25,974<br />
Number of options at 31.12.2005 — — — 204,774 784,439 409,835 176,127<br />
Granted in 2006 — — — — — — —<br />
Exercised in 2006 — — — — 278,257 160,824 153,879<br />
Lapsed in 2006 — — — 14,511 53,578 22,896 10,467<br />
Number of options at 31.12.2006 — — — 190,263 452,604 226,115 11,781<br />
Granted in 2007 — — 817,788 — — — —<br />
Exercised in 2007 — — — 12,956 155,840 110,426 3,753<br />
Lapsed in 2007 — — 8,754 13,019 38,326 10,391 —<br />
Number of options at 31.12.2007 — — 809,034 164,288 258,438 105,298 8,028<br />
Granted in 2008 — 926,565 — — — — —<br />
Exercised in 2008 — — — 1,699 121,117 93,747 —<br />
Lapsed in 2008 — — 3,103 1,443 2,162 944 —<br />
Number of options at 31.12.2008 — 926,565 805,931 161,146 135,159 10,607 8,028<br />
Granted in 2009 — — — — — — —<br />
Exercised in 2009 — — — 1,500 79,262 560 6,525<br />
Lapsed in 2009 — 17,928 16,158 3,192 — — —<br />
Number of options at 31.12.2009 — 908,637 789,773 156,454 55,897 10,047 1,503<br />
Granted in 2010 1,569,855 — — — — — —<br />
Exercised in 2010 — 10,399 95,380 29,832 52,581 7,682 1,503<br />
Lapsed in 2010 34,255 8,380 2,642 — — — —<br />
Number of options at 31.12.2010 1,535,600 889,858 691,751 126,622 3,316 2,365 —
Notes Other information<br />
The existing stock appreciation rights are valued on the basis of the Black/Scholes option pricing<br />
model.<br />
The calculations were based on the year-end closing price of the Hannover Re share of EUR 41.38 as<br />
at 22 December 2010, expected volatility of 39.69% (historical volatility on a fi ve-year basis), a dividend<br />
yield of 5.32% and risk-free interest rates of 1.02% for the 2002 allocation year, 1.39% for the<br />
2003 allocation year, 1.76% for the 2004 allocation year, 2.38% for the 2006 allocation year, 2.64%<br />
for the 2007 allocation year and 3.05% for the 2009 allocation year.<br />
On this basis the aggregate provisions, which are recognized in the sundry non-technical provisions,<br />
amounted to EUR 18.6 (10.5) million for the 2010 fi nancial year. The expense totaled altogether<br />
EUR 9.4 (7.5) million.<br />
249
250 <strong>Talanx</strong> Group Financial report 2010<br />
Lawsuits<br />
As a consequence of the merger with Gerling Konzern Allgemeine Versicherungs-AG, HDI-Gerling<br />
Industrie Versicherung AG – as the acquirer – became party to anti-trust administrative proceedings.<br />
In March 2005 the Federal Cartel Offi ce had imposed a fi ne of EUR 19 million on Gerling<br />
Konzern Allgemeine Versicherungs-AG – along with other German insurers – on account of alleged<br />
cartel agreements in the German industrial insurance market. In January 2010 the Dusseldorf<br />
Higher Regional Court (OLG) cleared HDI-Gerling Industrie Versicherung AG of the cartel accusations<br />
because liability as the legal successor to Gerling Konzern Allgemeine Versicherungs-AG was<br />
out of the question. The chief public prosecutor’s offi ce in Dusseldorf than appealed the ruling, as a<br />
result of which the matter is now before the Federal Court of Justice awaiting a decision.<br />
In the context of the acquisition of Lion Insurance Company, Trenton/USA, by our subsidiary<br />
Hannover Finance, Inc., Wilmington/USA, a legal dispute exists with the former owners of Lion<br />
Insurance Company regarding the release of a trust account in an amount of around USD 14 million<br />
that serves as security for liabilities of the former owners in connection with a particular business<br />
segment.<br />
The proceedings with the revenue authority relating to investment income generated by the<br />
reinsurance subsidiaries of some Group companies domiciled in Ireland were resolved in favor of<br />
the <strong>Talanx</strong> Group in the year under review when the Federal Fiscal Court (BFH) handed down its<br />
decision in October 2010. With regard to the implications we would refer the reader to our explanatory<br />
remarks in the Notes (item 35 “Taxes on income”) pages 242 et seq. and to the corresponding<br />
subsection in the risk report.<br />
With the exception of the aforementioned proceedings, no signifi cant court cases were pending<br />
during the year under review or as at the balance sheet date – with the exception of proceedings<br />
within the scope of ordinary insurance and reinsurance business activities.
Contingent liabilities and other fi nancial commitments<br />
Notes Other information<br />
Hannover Re has placed four subordinated debts on the European capital markets through its<br />
subsidiary Hannover Finance (Luxembourg) S. A. Hannover Re has secured by subordinated guarantee<br />
both the debt issued in 2001, the volume of which now stands at EUR 138 million, and the debts<br />
from fi nancial years 2004 in an amount of EUR 750 million as well as 2005 and 2010 in amounts of<br />
EUR 500 million each (for further information on the subordinated debts please see the item of the<br />
Notes 17 “Subordinated liabilities”, pages 216 et seq.).<br />
The guarantees given by Hannover Re for the subordinated debts take eff ect if the issuer in<br />
question fails to render payments due under the bonds. The guarantees cover the relevant bond<br />
volumes as well as interest due until the repayment dates. Given the fact that interest on the bonds<br />
is partly dependent on the capital market rates applicable at the interest payment dates (fl oating<br />
rates), the maximum undiscounted amounts that can be called cannot be estimated with suffi cient<br />
accuracy. Hannover Re does not have any rights of recourse outside the Group with respect to the<br />
guarantee payments.<br />
<strong>Talanx</strong> AG has provided a subordinated guarantee to the holders of the subordinated debt issued in<br />
February 2005 by its subsidiary <strong>Talanx</strong> Finanz (Luxemburg) S. A. The subordinated guarantee had a<br />
volume of EUR 243 million at the end of the year under review.<br />
Pension commitments to former members of staff give rise to contingent liabilities of EUR 366 million<br />
against Group companies.<br />
As security for technical liabilities to US clients, Hannover Re has established two trust accounts<br />
(master trust and supplemental trust) in the United States. They amounted to EUR 2,576 (2,341) million<br />
and EUR 10 (—) million respectively as at the balance sheet date. The securities held in the trust<br />
accounts are shown as available-for-sale investments. Hannover Re has furnished further collateral<br />
in an amount of EUR 299 (310) million in the form of so-called “single trust funds”.<br />
As part of its business activities Hannover Re holds collateral available outside the United States in<br />
various blocked custody accounts and trust accounts, the total amount of which in relation to the<br />
major companies of the Hannover Re Group was EUR 1,851 (1,588) million as at the balance sheet<br />
date.<br />
HDI-Gerling Industrie Versicherung AG has blocked holdings of EUR 51 (36) million. The securities<br />
held in the master trust are shown as available-for-sale investments.<br />
Outstanding capital commitments with respect to certain special investments exist in the amount<br />
of EUR 295 (351) million. The commitments exist at various Group companies. They involve primarily<br />
private equity funds and venture capital fi rms in the form of private limited companies.<br />
251
252 <strong>Talanx</strong> Group Financial report 2010<br />
As security for technical liabilities, various fi nancial institutions have furnished sureties for us in<br />
the form of letters of credit. The total amount as at the balance sheet date was EUR 2,842 (2,648)<br />
million. The standard market contractual clauses contained in some of the underlying letter of<br />
credit facilities regarding compliance with stipulated conditions are explained in the subsection<br />
“Management of liquidity risks” of the section “Nature of risks associated with insurance contracts<br />
and fi nancial instruments”, pages 184 et seqq.<br />
For liabilities in connection with participating interests in real estate companies and real estate<br />
transactions Hannover Re Real Estate Holdings has furnished the usual collateral under such transactions<br />
to various banks, the amount of which totaled EUR 258 (174) million as at the balance sheet<br />
date.<br />
At some Group companies potential fi nancial obligations relating to investments existed at the<br />
end of the fi nancial year in the amount of altogether EUR 170 million in connection with structured<br />
securities through issuers’ rights to take delivery. The potential amounts that could be drawn upon<br />
totaled EUR 159 million for 2011 and EUR 11 million for 2012.<br />
In addition, other fi nancial commitments existed as at 31 December 2010 for investment volumes<br />
taken up but not yet paid out in an amount of EUR 38 million. Building loans to <strong>policy</strong>holders that<br />
had been awarded but not yet disbursed totaled EUR 1 million.<br />
Commitments for contractually agreed future services in connection with IT outsourcing contracts<br />
amounted to altogether EUR 174 (102) million as at 31 December 2010.<br />
Contractual obligations in an amount of EUR 12 million existed on the basis of various service<br />
agreements that had been concluded.<br />
Further fi nancial commitments exist on the basis of guarantee facilities (EUR 7 million) and other<br />
contractual relationships (EUR 28 million).<br />
As guarantor institutions for Gerling Versorgungskasse VVaG, various Group companies are liable<br />
pro rata for any defi cits that may be incurred by Gerling Versorgungskasse.<br />
The Group’s life insurance companies are members of the Security Fund for Life Insurers pursuant<br />
to §§124 et seq. Insurance Supervision Act (VAG). On the basis of the Security Fund Financing Ordinance<br />
(Life), the Security Fund collects annual contributions of at most 0.2 per mille of the total<br />
net technical provisions until security funds of 1 per mille of the total net technical provisions have<br />
been accumulated. In addition, the Security Fund may collect special contributions in an amount<br />
of a further 1 per mille of the total net technical provisions. Furthermore, the companies have<br />
undertaken to make fi nancial resources available to the Security Fund or alternatively to Protektor<br />
Lebensversicherung AG, Berlin, insofar as the resources of the Security Fund are not suffi cient<br />
if a company has to be rehabilitated. The commitment amounts to 1% of the total net technical<br />
provisions (German Commercial Code) aft er allowance for the contributions already made to the<br />
Security Fund at this point in time. When the aforementioned payment commitments from the<br />
contributions payable to the Security Fund are taken into account, the total commitment of the<br />
companies stands at EUR 372 million.<br />
Several Group companies are members of the association for the reinsurance of pharmaceutical<br />
risks, the association for the insurance of German nuclear reactors and the traffi c accident pool<br />
Verkehrsopferhilfe e.V. In the event of one of the other pool members failing to meets its liabilities,<br />
an obligation exists to take over such other member’s share within the framework of the quota<br />
participation.
Rents and leases<br />
Leases under which Group companies are the lessee<br />
Notes Other information<br />
Outstanding commitments from non-cancellable contractual relationships existed in an amount<br />
of EUR 492 million as at the balance sheet date.<br />
Future rental and leasing commitments<br />
Figures in EUR million<br />
2011 2012 2013 2014 2015<br />
Subsequent<br />
years<br />
Payments 51 43 41 39 37 281<br />
Operating leasing contracts produced expenditures of EUR 51 (22) million in the year under review.<br />
Multi-year lease contracts existed above all with respect to subsidiaries of Hannover Re in Africa<br />
and the United States. Further commitments refer to multi-year lease contracts entered into by<br />
primary insurance companies in Germany.<br />
Leases under which Group companies are the lessor<br />
The total amount of rental income due under non-cancellable contracts in subsequent years is<br />
EUR 340 million.<br />
Future rental income<br />
Figures in EUR million<br />
2011 2012 2013 2014 2015<br />
Subsequent<br />
years<br />
Payments to be received 62 57 58 58 55 50<br />
Rental income in the year under review totaled EUR 65 million. It resulted principally from the renting<br />
out of properties by a US-based real estate company in the Non-Life Reinsurance segment as<br />
well as from the renting out of properties in Germany by primary insurance companies.<br />
Remuneration of the management boards of the<br />
parent company<br />
Total remuneration of EUR 6,224 (8,399) thousand was paid to the Board of Management.<br />
The total remuneration paid to the Supervisory Board amounted to EUR 1,857 (1,148) thousand.<br />
Former members of the Board of Management and their surviving dependants received total remuneration<br />
of EUR 790 (399) thousand. An amount of EUR 11,747 (6,678) thousand was set aside to<br />
cover projected benefi t obligations due to former members of the Board of Management and their<br />
surviving dependants.<br />
No advances or loans were extended to members of the management boards in the year under<br />
review.<br />
253
254 <strong>Talanx</strong> Group Financial report 2010<br />
IAS 24 provides for detailed presentation of the remuneration components received by members of<br />
management in key positions. Specifi cally, this group of persons encompasses the members of the<br />
Board of Management and Supervisory Board of <strong>Talanx</strong> AG. The aforementioned group of persons<br />
received the following remuneration components:<br />
2010 2009<br />
Figures in EUR thousand<br />
Salaries and other remuneration due in the short term 8,081 9,547<br />
Expenses for retirement provision 4,616 3,088<br />
Granting of equities and other equity-based remuneration — —<br />
Total 12,697 12,635<br />
Fee paid to the auditor<br />
The appointed auditor of the <strong>Talanx</strong> Group’s consolidated fi nancial statement is KPMG AG<br />
Wirtschaft sprüfungsgesellschaft (KPMG AG).<br />
The fees expensed by KPMG AG and its affi liated companies* in the 2010 fi nancial year within the<br />
meaning of § 318 German Commercial Code (HGB) amounted to EUR 12.7 (13.7) million. The amount<br />
includes a fee of EUR 9.2 (8.1) million for the auditing of the fi nancial statement, EUR 0.1 (1.0) million<br />
for other appraisals and valuations, EUR 0.9 (0.9) million for tax consultancy services and<br />
EUR 2.5 (3.7) million for consultancy and other services performed for the parent or subsidiary<br />
companies.<br />
Declaration of conformity pursuant to § 161<br />
German Stock Corporation Act (AktG)<br />
On 8 November 2010 the Executive Board and Supervisory Board of our listed subsidiary Hannover<br />
Rückversicherung AG (Hannover Re) submitted the declaration of conformity regarding the recommendations<br />
made by the Government Commission on the German Corporate Governance Code<br />
that is required pursuant to § 161 German Stock Corporation Act (AktG) and made this declaration<br />
available to the shareholders by publishing it in its annual report. The present and all previous<br />
Declarations of Conformity of the company are published on Hannover Re’s website (http://www.<br />
hannover-re.com/about/corporate/declaration/index.html).<br />
Events aft er the balance sheet date<br />
Catastrophe losses and major claims<br />
We anticipate a net burden of losses in the range of EUR 40 million to EUR 100 million from the<br />
fl ooding that occurred in the Australian city of Brisbane in January 2011.<br />
On 22 February 2011 an earthquake with a magnitude of 6.3 occurred in New Zealand. This was the<br />
second quake to hit Christchurch in the space of fi ve months. We anticipate a net burden of losses<br />
in the order of EUR 150–160 million in primary and reinsurance business from this latest earthquake<br />
in New Zealand.<br />
* As at 31 December 2009 KPMG AG and its affi liated companies encompassed the KPMG companies in Germany, the United<br />
Kingdom, Spain, Switzerland, Belgium, the Netherlands, Luxembourg and Turkey. The KPMG companies in the CIS countries<br />
of Russia, Ukraine, Kazakhstan, Kyrgyzstan, Georgia and Armenia were added eff ective 1 February 2010. Fees relating to<br />
2009 were adjusted accordingly.
Notes Other information<br />
The magnitude 9.0 earthquake that struck Japan on 11 March 2011 will impact our account through<br />
our worldwide industrial and reinsurance activities. In view of the complexity of the event, reliable<br />
information on the total market loss for the insurance industry is not yet available. Any assessment<br />
of the loss amount is therefore still subject to considerable uncertainty. Based on initial<br />
treaty analyses, we currently anticipate a total net burden of losses for the Group in the order of<br />
EUR 300 million before taxes.<br />
Other events<br />
In a press release dated 20 January 2011 our subsidiary HDI-Gerling Industrie Versicherung AG,<br />
Hannover, announced that it had acquired the Dutch property/casualty insurer Nassau Verzekering<br />
Maatschappij N.V. with retroactive eff ect from 30 September 2010 for a purchase price of<br />
EUR 195 million. Since the closing is expected in the second quarter of 2011 disclosures pursuant to<br />
IFRS 3 have been omitted. It is intended that the acquired company will subsequently be merged<br />
with retroactive eff ect from 1 January 2011 into the Dutch insurer HDI Verzekeringen N.V. The latter<br />
company is a wholly owned subsidiary of HDI-Gerling Industrie Versicherung AG.<br />
HDI-Gerling Lebensversicherung AG is currently considering the possible sale of a real estate portfolio.<br />
It is aiming for disposal in 2011. The relevant assets were not carried as “held for sale” because<br />
the requirements of IFRS 5 had not been fully satisfi ed as at the balance sheet date (see also the<br />
section “Non-current assets held for sale and disposal groups”, pages 164 et seq.).<br />
The subordinated debt of EUR 350 million issued in 2001 by Hannover Finance (Luxembourg) S. A.<br />
can be called for the fi rst time on 14 March 2011 and has a remaining volume of EUR 138.1 million<br />
aft er the off er made in 2005 to existing issue holders to exchange into a new bond. As announced<br />
on 1 February 2011, the issuer exercised its call option and repaid the outstanding bond volume in<br />
full eff ective 14 March 2011. Further details of the debt are provided in item 17 of the Notes “Subordinated<br />
liabilities”, pages 216 et seq.<br />
In a press release dated 11 January 2011 the Executive Board of Hannover Re advised that the New<br />
York State Insurance Department had allowed Hannover Re to qualify as a so-called “Eligible Reinsurer”.<br />
Under this regulation the collateral requirements for our non-life reinsurance business written<br />
in the state of New York are reduced. Whereas it had previously been necessary to post collateral<br />
for 100% of the technical reserves, the required collateral level now stands at just 20%.<br />
In October 2010 the Federal Fiscal Court (BFH) confi rmed a decision of the lower court according to<br />
which investment income of Irish subsidiaries is not subject to taxation of foreign-sourced income.<br />
Since tax assessments were amended accordingly or the amendment thereof was announced by<br />
the revenue authority in February 2011, the refund of prepaid taxes and interest in a substantial<br />
amount is anticipated for the Hannover Re subgroup in the 2011 fi nancial year. The eff ect on net<br />
income is likely to be in the order of EUR 100 to 120 million.<br />
In a press release dated 22 December 2010 the Executive Board of Hannover Re reported that<br />
Hannover Re had reached agreement on the sale of all operational companies of its US subsidiary<br />
Clarendon Insurance Group, Inc., New York, to the Bermuda-based Enstar Group Ltd., Hamilton.<br />
Since this transaction was still subject to the customary regulatory approvals at the time when the<br />
consolidated fi nancial statement was released for publication, it remains our expectation that the<br />
sale will be closed in the second quarter of 2011. Please see our remarks in the section “Non-current<br />
assets held for sale and disposal groups”.<br />
255
256 <strong>Talanx</strong> Group Financial report 2010<br />
List of shareholdings for the consolidated fi nancial<br />
statement of <strong>Talanx</strong> AG pursuant to § 313 (2)<br />
Commercial Code (HGB)<br />
1. Subsidiaries<br />
Companies included in the IFRS consolidated fi nancial statement<br />
Calculated<br />
share of<br />
capital 1) in %<br />
Capital and<br />
reserves 2) in<br />
EUR thousand<br />
Result before<br />
profi t/loss<br />
transfer 2) in<br />
EUR thousand<br />
Industrial Lines<br />
Gerling Insurance Agency, Inc., Chicago, USA 7) 100.00 USD — USD —<br />
HDI Gerling Insurance of South Africa Ltd., Johannesburg, South Africa<br />
HDI HANNOVER International Espana, CÍa de Seguros y Reaseguros S. A.,<br />
100.00 ZAR 39,989 ZAR 1,688<br />
Madrid, Spain 18) 100.00 44,898 4,911<br />
HDI Versicherung AG, Vienna, Austria 18) 100.00 41,930 7,512<br />
HDI-Gerling America Insurance Company, Chicago, USA 100.00 USD 124,801 USD 11,928<br />
HDI-Gerling Assurances S. A., Brussels, Belgium 18) 100.00 36,637 4,602<br />
HDI-Gerling Australia Insurance Company Pty. Ltd., Sydney, Australia 100.00 AUD 23,796 AUD –802<br />
HDI-Gerling de Mexico Seguros S. A., Mexico City, Mexico 18) 100.00 MXN 53,101 MXN –921<br />
HDI-Gerling Industrie Versicherung AG, Hannover, Germany 3) 100.00 406,536 130,813<br />
HDI-Gerling Verzekeringen N.V., Rotterdam, Netherlands 18) 100.00 70,885 15,932<br />
HDI-Gerling Welt Service AG, Hannover, Germany 3) 100.00 90,986 5,231<br />
HG Sach AltInvest GmbH & Co. KG, Cologne, Germany 13), 19) 100.00 37,699 1,123<br />
IVEC Institutional Venture and Equity Capital AG, Cologne, Germany 13) 100.00 178,003 21,171<br />
Riethorst Grundstückgesellschaft mbH, Hannover, Germany 13), 18) 100.00 43,246 –137<br />
Retail Germany<br />
Alstertor Zweite Beteiligungs- und Investitionssteuerungs-GmbH & Co. KG,<br />
Hamburg 100.00 30,596 –24<br />
CiV Grundstücksgesellschaft mbH & Co. KG, Hilden 18) 100.00 25,565 530<br />
Clarus AG, Wiesbaden (formerly: DTPVO Deutsche Privatvorsorge AG, Darmstadt) 3) 100.00 222 –25,189<br />
Erste Credit Life International AG, Hilden 100.00 264 –1,772<br />
GERLING Pensionsenthaftungs- und Rentenmanagement GmbH, Cologne 100.00 5,458 –2,023<br />
HDI Direkt Versicherung AG, Hannover 3) 100.00 162,088 4,657<br />
HDI-GERLING Financial Service GmbH, Vienna, Austria 100.00 781 112<br />
HDI-Gerling Firmen und Privat Versicherung AG, Hannover 3) 100.00 154,926 –56,373<br />
HDI-Gerling Friedrich Wilhelm Rückversicherung AG, Cologne 3) 100.00 39,619 111,006<br />
HDI-Gerling Leben Betriebsservice GmbH, Cologne 3), 16) 100.00 171 130<br />
HDI-Gerling Leben Vertriebsservice AG, Cologne 3), 16) 100.00 4,028 —<br />
HDI-Gerling Lebensversicherung AG, Cologne 100.00 234,593 15,000<br />
HDI-Gerling Pensionsfonds AG, Cologne 100.00 5,278 133<br />
HDI-Gerling Pensionskasse AG, Cologne 100.00 28,248 —<br />
HDI-Gerling Pensionsmanagement AG, Cologne 3), 16) 100.00 6,414 –1,462<br />
HDI-Gerling Rechtsschutz Schadenregulierungs-GmbH, Hannover 3), 16) 100.00 288 –27<br />
HDI-Gerling Rechtsschutz Versicherung AG, Hannover 3) 100.00 18,951 –21,664<br />
HDI-Gerling Vertrieb Firmen und Privat AG, Hannover 3), 16) 100.00 55 –2,806<br />
HNG Hannover National Grundstücksverwaltung GmbH & Co. KG, Hannover 18) 100.00 37,957 3,871<br />
neue leben Holding AG, Hamburg 67.50 75,960 20,456<br />
neue leben Lebensversicherung AG, Hamburg 67.50 64,566 17,800<br />
neue leben Unfallversicherung AG, Hamburg 3) 67.50 3,596 3,814<br />
PARTNER OFFICE AG, Cologne 3), 16) 100.00 3,041 –16,189<br />
PB Lebensversicherung AG, Hilden 100.00 31,587 14,739<br />
PB Pensionsfonds AG, Hilden 3) 100.00 5,038 235<br />
PB Pensionskasse AG, Hilden 100.00 6,030 79<br />
PB Versicherung AG, Hilden 100.00 10,473 4,003<br />
PBV Lebensversicherung AG, Hilden 100.00 46,987 10,772
1. Subsidiaries<br />
Companies included in the IFRS consolidated fi nancial statement<br />
Notes List of shareholdings for the consolidated fi nancial statement<br />
Calculated<br />
share of<br />
capital 1) in %<br />
Capital and<br />
reserves 2) in<br />
EUR thousand<br />
Result before<br />
profi t/loss<br />
transfer 2) in<br />
EUR thousand<br />
Proactiv Communication Center GmbH, Hilden 3) 100.00 630 538<br />
Proactiv IT Servicegesellschaft mbH, Munich 3) 100.00 50 453<br />
Proactiv Servicegesellschaft mbH, Hilden 3) <strong>Talanx</strong> Deutschland AG, Hannover<br />
100.00 7,025 2,176<br />
(formerly: HDI-Gerling Leben Serviceholding AG, Cologne) 3) 100.00 2,899,468 –428,051<br />
TARGO Lebensversicherung AG, Hilden 100.00 73,774 40,119<br />
TARGO Versicherung AG, Hilden 3) 100.00 27,106 16,751<br />
Zweite Credit Life International AG, Hilden 100.00 1,854 –684<br />
Retail International<br />
ASPECTA Assurance International AG, Vaduz, Liechtenstein 12) 100.00 CHF 1,054 CHF –3,427<br />
ASPECTA Assurance International Luxembourg S. A., Luxembourg, Luxembourg 12) 100.00 273 –16,798<br />
CiV Hayat Sigorta A. Ş., Istanbul, Turkey 12) 100.00 TRY 14,152 TRY –3,698<br />
HDI Asekuracja Towarzystwo Ubezpieczen S. A., Warsaw, Poland 12) 100.00 PLN 273,770 PLN –34,996<br />
HDI Assicurazioni S. p. A., Rome, Italy 12) 100.00 170,116 8,736<br />
HDI Immobiliare S. r. L., Rome, Italy 12) 100.00 63,033 343<br />
HDI Seguros S. A. de C.V., León, Mexico 12) 99.48 MXN 276,970 MXN 29,347<br />
HDI Seguros S. A., Santiago, Chile 12) 99.93 CLP 7,145,291 CLP –1,534,363<br />
HDI Seguros S. A., São Paulo, Brazil 12) 100.00 BRL 367,740 BRL 58,972<br />
HDI Sigorta A. Ş., Istanbul, Turkey 12) 100.00 TRY 58,191 TRY 106,698<br />
HDI STRAKHUVANNYA (Ukraine), Kiev, Ukraine 12) 99.22 UAH 40,537 UAH –16,242<br />
HDI Zahstrahovane AD, Sofi a, Bulgaria 12) 94.00 BGN 8,134 BGN 254<br />
HDI-Gerling Zycie Towarzystwo Ubezpieczen S. A., Warsaw, Poland 12) 100.00 PLN 31,226 PLN –8,385<br />
InChiaro Assicurazioni S. p. A., Rome, Italy 12) 51.00 7,888 –962<br />
InLinea S. p. A., Rome, Italy 12) 70.00 591 145<br />
Inversiones HDI Limitada, Santiago, Chile 12) 100.00 CLP 13,011,024 CLP 186,548<br />
Magyar Posta Biztosító Részvénytársaság, Budapest, Hungary 12) 66.93 HUF 1,738,292 HUF –457,831<br />
Magyar Posta Életbiztosító Részvénytársaság, Budapest, Hungary 12) 66.93 HUF 3,006,804 HUF 35,383<br />
OOO Strakhovaya Kompaniya “HDI Strakhovanie”, Moscow, Russia 12) 100.00 RUB 49,186 RUB 1,535<br />
OOO Strakhovaya Kompaniya CiV Life, Moscow, Russia 12) <strong>Talanx</strong> International AG<br />
100.00 RUB 26,262 RUB –69,937<br />
(formerly: HDI-Gerling International Holding AG), Hannover, Germany 3) 100.00 595,337 21,449<br />
Non-Life Reinsurance<br />
300 S. Orange Avenue LLC, Wilmington, USA 6), 12) 47.71 USD 55,392 USD 1,743<br />
402 Santa Monica Blvd. LLC, Wilmington, USA 6), 12) 47.71 USD 31,673 USD 1,139<br />
465 Broadway LLC, Wilmington, USA 6), 12) 47.71 USD 42,394 USD 1,088<br />
5115 Sedge Boulevard LP, Chicago, USA 6), 12) 40.12 USD 1,012 USD 231<br />
5115 Sedge Corporation, Chicago, USA 6), 12) 47.76 USD 2,582 USD 277<br />
Atlantic Capital Corporation, Wilmington, USA 4), 21) 50.22 USD –113,387 USD —<br />
Cargo Transit Insurance (Pty) Ltd., Helderkruin, South Africa 5), 11) 20.49 ZAR –269 ZAR –769<br />
Clarendon America Insurance Company, Trenton, USA 4), 10), 11) 50.22 USD 131,093 USD –7,999<br />
Clarendon Insurance Group Inc., Wilmington, USA 4), 10), 11) 50.22 USD –46,297 USD –36,624<br />
Clarendon National Insurance Company, Trenton, USA 4), 10), 11) 50.22 USD –46,580 USD –33,254<br />
Clarendon Select Insurance Company, Tallahassee, USA 4), 10), 11) 50.22 USD 13,412 USD –867<br />
Compass Insurance Company Limited, Johannesburg, South Africa 5) 50.22 ZAR 111,083 ZAR –13,847<br />
Construction Guarantee (Pty.) Ltd., Parktown, South Africa 5) 13.06 ZAR 1,476 ZAR 1,152<br />
E+S Rückversicherung AG, Hannover, Germany 14) 31.98 683,413 176,000<br />
257
258 <strong>Talanx</strong> Group Financial report 2010<br />
1. Subsidiaries<br />
Companies included in the IFRS consolidated fi nancial statement<br />
Calculated<br />
share of<br />
capital 1) in %<br />
Capital and<br />
reserves 2) in<br />
EUR thousand<br />
Result before<br />
profi t/loss<br />
transfer 2) in<br />
EUR thousand<br />
Envirosure Underwriting Managers (Pty.) Ltd., Durban, South Africa 5) 15.37 ZAR –1,849 ZAR –618<br />
Film & Entertainment Underwriters SA (Pty). Ltd., Northcliff , South Africa 5), 11) 13.06 ZAR –610 ZAR –860<br />
Funis GmbH & Co. KG, Hannover, Germany 19) 50.22 7,996 –4<br />
Garagesure Consultants and Acceptances (Pty) Ltd., Johannesburg, South Africa 5) 20.49 ZAR 1,926 ZAR 220<br />
Gem & Jewel Acceptances (Pty) Ltd., Johannesburg, South Africa 5), 11) 17.93 ZAR 459 ZAR 393<br />
GLL HRE CORE PROPERTIES LP, Wilmington, USA 6), 12) 47.71 USD 111,270 USD 2,058<br />
GLL Terry Francois Blvd. LLC, Wilmington, USA 6), 12) 24.32 USD 24,801 USD 1,768<br />
Hannover America Private Equity Partners II GmbH & Co. KG, Cologne, Germany 19) 47.85 167,582 5,832<br />
Hannover Euro Private Equity Partners II GmbH & Co. KG, Cologne, Germany 13), 19) 58.52 5,747 454<br />
Hannover Euro Private Equity Partners III GmbH & Co. KG, Cologne, Germany 13), 15), 19) 51.73 62,438 4,723<br />
Hannover Euro Private Equity Partners IV GmbH & Co. KG, Cologne, Germany 13), 15), 19) 53.82 72,582 8,946<br />
Hannover Finance (Luxembourg) S. A., Luxembourg, Luxembourg 11) 50.22 31,244 –2,331<br />
Hannover Finance (UK) Limited, Virginia Water, United Kingdom 11) 50.22 GBP 131,095 GBP –12<br />
Hannover Finance Inc., Wilmington, USA 9), 11) 50.22 USD 307,866 USD –34,956<br />
Hannover Insurance-Linked Securities GmbH & Co. KG, Hannover, Germany 19) 50.22 65,883 8,585<br />
Hannover Life Reassurance Africa Ltd., Johannesburg, South Africa 5), 11) 50.22 ZAR 411,113 ZAR 69,634<br />
Hannover Re (Bermuda) Ltd., Hamilton, Bermuda 11) 50.22 920,679 27,287<br />
Hannover Re Advanced Solutions Ltd., Dublin, Ireland 22) 50.22 31 —<br />
Hannover Re Euro PE Holdings GmbH & Co. KG, Cologne, Germany 19) 45.66 25,979 691<br />
Hannover Re Euro RE Holdings GmbH, Cologne, Germany 19) 41.10 56,057 –305<br />
Hannover Re Real Estate Holdings Inc., Orlando, USA 9), 12) 47.76 USD 254,774 USD 2,838<br />
Hannover Reinsurance (Ireland) Ltd., Dublin, Ireland 11) 50.22 462,537 46,010<br />
Hannover Reinsurance Africa Ltd., Johannesburg, South Africa 5), 11) 50.22 ZAR 726,038 ZAR 151,044<br />
Hannover Reinsurance Group Africa (Pty) Ltd., Johannesburg, South Africa 9), 11), 14) 50.22 ZAR 155,813 ZAR 138,961<br />
Hannover Reinsurance Mauritius Ltd., Port Louis, Mauritius 5) 50.22 MUR 50,613 MUR 2,824<br />
Hannover ReTakaful B. S. C (c), Manama, Bahrain 11), 14) 50.22 BHD 28,198 BHD 6,208<br />
Hannover Rück Beteiligung Verwaltungs-GmbH, Hannover, Germany 3), 14) 50.22 2,621,855 164,970<br />
Hannover Rückversicherung AG, Hannover, Germany 14) 50.22 1,682,903 302,000<br />
Hannover Services (UK) Ltd., Virginia Water, United Kingdom 11) 50.22 GBP 763 GBP –17<br />
HAPEP II Holding GmbH, Cologne, Germany 19) 47.85 41,565 1,702<br />
Harbor Specialty Insurance Company, Trenton, USA 4), 10), 11) 50.22 USD 37,840 USD 1,804<br />
HEPEP II Holding GmbH, Cologne, Germany 13), 19) 58.52 2,944 483<br />
HEPEP III Holding GmbH, Cologne, Germany 13), 15), 19) 51.73 11,925 56<br />
HILSP Komplementär GmbH, Hannover, Germany 19) Hospitality Industries Underwriting Consultants (Pty) Ltd.,<br />
50.22 22 —<br />
Johannesburg, South Africa 5) 18.77 ZAR 3,071 ZAR 2,763<br />
Indoc Holdings S. A., Luxembourg, Luxembourg 5), 21) 50.22 CHF — CHF —<br />
Inter Hannover (No. 1) Ltd., London, United Kingdom 11) 50.22 GBP 1 GBP —<br />
International Insurance Company of Hannover Ltd., Bracknell, United Kingdom 11) 50.22 GBP 119,353 GBP 9,134<br />
Landmark Underwriting Agency (Pty) Ltd., Bloemfontein, South Africa 5) 20.62 ZAR 1,873 ZAR 374<br />
Lireas Holdings (Pty) Ltd., Johannesburg, South Africa 5) 25.61 ZAR 185,175 ZAR 36,888<br />
Micawber 185 (Pty) Ltd., Johannesburg, South Africa 5) 50.22 ZAR 18,257 ZAR 3,225<br />
MUA Insurance Acceptances (Pty) Ltd., Cape Town, South Africa 5) 25.61 ZAR 3,751 ZAR 4,696<br />
MUA Insurance Company Ltd., Cape Town, South Africa 5) 25.61 ZAR 19,673 ZAR 5,655<br />
One Winthrop Square LLC, Wilmington, USA 6), 12) 47.71 USD 23,123 USD 1,078<br />
Oval Offi ce Grundstücks GmbH, Hannover, Germany 11), 13) 75.11 57,789 1,878<br />
Peachtree (Pty) Ltd., Johannesburg, South Africa 5), 21) 50.22 ZAR — ZAR —<br />
Secquaero ILS Fund Ltd., Georgetown, Grand Cayman, Cayman Islands 11), 12) 50.22 USD 51,472 USD 26<br />
SUM Holdings (Pty) Ltd., Johannesburg, South Africa 5) 18.77 ZAR 21,469 ZAR 478<br />
Thatch Risk Acceptances (Pty) Ltd., Cape Town, South Africa 5) 16.89 ZAR 764 ZAR 1,008<br />
Transit Underwriting Managers (Pty) Ltd., Cape Town, South Africa 5) 25.61 ZAR 1,332 ZAR 2,552<br />
Woodworking Risk Acceptances (Pty) Ltd., Pietermaritzburg, South Africa 5) 15.37 ZAR 1,001 ZAR 209
1. Subsidiaries<br />
Companies included in the IFRS consolidated fi nancial statement<br />
Notes List of shareholdings for the consolidated fi nancial statement<br />
Calculated<br />
share of<br />
capital 1) in %<br />
Capital and<br />
reserves 2) in<br />
EUR thousand<br />
Result before<br />
profi t/loss<br />
transfer 2) in<br />
EUR thousand<br />
Life/Health Reinsurance<br />
Hannover Life Re AG, Hannover, Germany 3) 50.22 1,032,596 23,499<br />
Hannover Life Re of Australasia Ltd., Sydney, Australia 11) 50.22 AUD 251,641 AUD 27,673<br />
Hannover Life Reassurance (Ireland) Ltd., Dublin, Ireland 11) 50.22 922,025 84,505<br />
Hannover Life Reassurance (UK) Ltd., Virginia Water, United Kingdom 11) 50.22 GBP 40,509 GBP –461<br />
Hannover Life Reassurance Bermuda Ltd., Hamilton, Bermuda 12) 50.22 163,387 15,451<br />
Hannover Life Reassurance Company of America, Orlando, USA 11) 50.22 USD 166,599 USD 217<br />
Corporate Operations<br />
Alstertor Erste Beteiligungs- und Investitionssteuerungs-GmbH & Co. KG,<br />
Hamburg, Germany 18) 100.00 5,263 578<br />
AmpegaGerling Asset Management GmbH, Cologne, Germany 3) 100.00 83,600 39,918<br />
AmpegaGerling Immobilien Management GmbH, Cologne, Germany 3) 100.00 2,837 –2,029<br />
AmpegaGerling Investment GmbH, Cologne, Germany 3) 100.00 16,936 7,258<br />
GERLING Beteiligungs-GmbH, Cologne, Germany 100.00 4,792 –582<br />
HAPEP II Komplementär GmbH, Cologne, Germany 19) 100.00 26 1<br />
HDI Reinsurance (Ireland) Ltd., Dublin, Ireland 18) 100.00 5,102 102<br />
HEPEP II Komplementär GmbH, Cologne, Germany 19) 100.00 27 –1<br />
HEPEP III Komplementär GmbH, Cologne, Germany 19) 100.00 21 –1<br />
HEPEP IV Komplementär GmbH, Cologne, Germany 19) 100.00 22 –1<br />
Protection Reinsurance Intermediaries AG, Hannover, Germany 3) 100.00 389 7,575<br />
<strong>Talanx</strong> Beteiligungs-GmbH & Co. KG, Hannover, Germany 8) 100.00 146,024 1,242<br />
<strong>Talanx</strong> Finanz (Luxemburg) S. A., Luxembourg, Luxembourg<br />
<strong>Talanx</strong> Service AG<br />
100.00 8,260 2,201<br />
(vormals: HDI-Gerling Sach Serviceholding AG), Hannover, Germany 3), 16) <strong>Talanx</strong> Systeme AG, Hannover<br />
100.00 1,605 –2,593<br />
(formerly: HDI-Gerling Gesellschaft für IT-Dienstleistungen AG, Cologne), Germany 3) 100.00 130 7<br />
259
260 <strong>Talanx</strong> Group Financial report 2010<br />
2. Special purpose entities and special funds<br />
a) Special funds included in the consolidated fi nancial statement<br />
pursuant to IAS 27/SIC 12<br />
Share of fund<br />
assets 1) in %<br />
Fund assets 2) in<br />
EUR thousand<br />
Change in fund<br />
assets incl. cash<br />
infl ows and<br />
outfl ows 2) in<br />
EUR thousand<br />
Industrial Lines<br />
Ampega-Vienna-Bonds-Fonds, Vienna, Austria 100.00 264,297 53,762<br />
GERLING EURO-RENT 3, Cologne, Germany 18) 100.00 594,660 169,873<br />
HDI Gerling-Sach Industrials, Cologne, Germany 13), 18) 100.00 171,287 –149,415<br />
Retail Germany<br />
Ampega-nl-Balanced-Fonds, Cologne 18) 67.50 54,571 –121,927<br />
Ampega-nl-Euro-DIM-Fonds, Cologne 18) 67.50 437,366 24,385<br />
Ampega-nl-Global-Fonds, Cologne 18) 67.50 47,187 2,293<br />
Ampega-nl-Rent-Fonds, Cologne 18) 67.50 780,130 64,371<br />
Ampega-TAL-A-Fonds, Cologne 18) 100.00 93,583 7,263<br />
Gerling Immo Spezial 1, Cologne 18) 100.00 269,383 2,674<br />
GKL SPEZIAL RENTEN, Cologne 18) 100.00 599,516 50,720<br />
HGLV-Corporates, Cologne 18) 100.00 1,081,286 278,276<br />
HGLV-Financial, Cologne 18) 100.00 1,047,099 117,219<br />
PBVL-Aktien, Cologne 18) 100.00 52,062 8,127<br />
PBVL-Corporate, Cologne 18) 100.00 106,927 58,335<br />
terrAssisi Aktien I AMI, Cologne 69.02 7,408 505<br />
Retail International<br />
BNP-HDI Credit FI Renda Fixa Credito Privado, São Paulo, Brazil 100.00 BRL 66,468 BRL 24,727<br />
Credit Suisse HDI RF Créditor, São Paulo, Brazil 100.00 BRL 61,131 BRL 5,482<br />
CSHG Hannover FI Multimercado Credito Privado, São Paulo, Brazil 100.00 BRL 20,190 BRL 20,190<br />
HSBC FI Renda Fixa Hannover, São Paulo, Brazil 100.00 BRL 95,963 BRL –38,307<br />
HSBC Performance HDI RF Crédito, São Paulo, Brazil 100.00 BRL 70,121 BRL 11,020<br />
UBS Pactual HDI RF Crédito, São Paulo, Brazil 100.00 BRL 65,392 BRL 11,222<br />
Non-Life Reinsurance<br />
FRACOM FCP, Paris, France 18) 49.90 708,449 116,703<br />
2. Special purpose entities and special funds<br />
b) Special purpose entities included in the consolidated fi nancial statement<br />
pursuant to IAS 27/SIC 12<br />
Calculated<br />
share of<br />
capital 1) in %<br />
Capital and<br />
reserves 2) in<br />
EUR thousand<br />
Result before<br />
profi t/loss<br />
transfer 2) in<br />
EUR thousand<br />
Non-Life Reinsurance<br />
Hannover Re (Guernsey) PCC Ltd., St. Peter Port, United Kingdom 11) 50.22 261 –42<br />
Kaith Re Ltd., Hamilton, Bermuda 11), 12) 44.19 USD 640 USD –441
Notes List of shareholdings for the consolidated fi nancial statement<br />
Calculated<br />
share of<br />
3. Associated companies recognized at equity in the consolidated fi nancial statement capital1) Capital and<br />
reserves<br />
in %<br />
2) Result before<br />
profi t/loss<br />
in<br />
transfer<br />
EUR thousand<br />
2) in<br />
EUR thousand<br />
Apulia Prontoprestito S. p. A., Rome, Italy 17), 18) 10.60 236,795 35<br />
Aviation Insurance Company Limited, Johannesburg, South Africa 5), 11) 8.01 ZAR 6,270 ZAR –140<br />
C-QUADRAT Investment AG, Vienna, Austria 19) 25.10 33,111 9,342<br />
Carmargue Underwriting Managers (Pty) Ltd., Parktown, South Africa 5) Clarendon Transport Underwriting Managers (Pty) Ltd., Johannesburg,<br />
6.66 ZAR 9,012 ZAR 1,666<br />
South Africa 5), 11) 9.56 ZAR 3,880 ZAR 30,190<br />
Commercial & Industrial Acceptances (Pty) Ltd., Johannesburg, South Africa 5), 11) 10.24 ZAR 5,147 ZAR 15,703<br />
Flexible Accident & Sickness Acceptances (Pty) Ltd., Johannesburg, South Africa 5) 10.24 ZAR 1,811 ZAR 2,995<br />
Hannover Finanz GmbH, Hannover, Germany 18) 12.56 69,093 5,617<br />
ITAS Vita S. p. A., Trento, Italy 18) 17.52 75,355 5,572<br />
neue leben Pensionsverwaltung AG, Hamburg, Germany 33.08 15,176 408<br />
Takafol South Africa (Pty) Ltd., Johannesburg, South Africa 5) 12.55 ZAR 825 ZAR 351<br />
WeHaCo Unternehmensbeteiligungs-GmbH, Hannover, Germany 18) 16.44 73,950 192<br />
4. Associated companies not recognized at equity in the consolidated fi nancial<br />
statement owing to subordinate importance<br />
Calculated<br />
share of<br />
capital 1) in %<br />
Capital and<br />
reserves 2) in<br />
EUR thousand<br />
Result before<br />
profi t/loss<br />
transfer 2) in<br />
EUR thousand<br />
Energi Holding Inc., Peabody, USA 18) 14.31 USD 4,805 USD –190<br />
Hannover Care AB, Stockholm, Sweden 18) Hannoversch-Kölnische Handels-Beteiligungsgesellschaft mbH & Co. KG,<br />
15.07 SEK 570 SEK –2,657<br />
Hannover, Germany 18) 50.00 28,326 2,564<br />
PlaNet Guarantee (SAS), Saint-Ouen, France 11) 11.84 1,069 –927<br />
Sciemus Power MGA Limited, London, United Kingdom 18) 12.55 GBP 1 GBP —<br />
XS Direct Holding Ltd., Dublin, Ireland 18) 12.55 658 16<br />
Calculated<br />
share of<br />
5. Joint ventures included in the consolidated fi nancial statement pursuant to IFRS capital1) Capital and<br />
reserves<br />
in %<br />
2) Result before<br />
profi t/loss<br />
in<br />
transfer<br />
EUR thousand<br />
2) in<br />
EUR thousand<br />
Credit Life International Services GmbH, Neuss, Germany 50.00 64 38<br />
261
262 <strong>Talanx</strong> Group Financial report 2010<br />
6. Affi liated companies not included in the consolidated fi nancial statement<br />
pursuant to IFRS<br />
Calculated<br />
share of<br />
capital 1) in %<br />
Capital and<br />
reserves 2) in<br />
EUR thousand<br />
Result before<br />
profi t/loss<br />
transfer 2) in<br />
EUR thousand<br />
Bureau für Versicherungswesen Robert Gerling & Co. GmbH, Cologne, Germany 3) 100.00 26 –5<br />
CiV Immobilien GmbH, Hilden, Germany 18) 100.00 28 1<br />
Clarendon Services of New Jersey, Inc., Trenton, USA 10), 11), 21) 50.22 USD — USD —<br />
Clarenfi n (Pty) Ldt., Johannesburg, South Africa 22) 9.56 ZAR — ZAR —<br />
Desarollo de Consultores Profesionales en Seguros S. A. de CV, León, Mexico 7) 99.47 MXN — MXN —<br />
Gente Compania de Soluciones Profesionales de Mexico, S. A. de C. V., León, Mexico 12) 100.00 MXN 12,840 MXN 2,744<br />
Gerling Norge A/S, Oslo, Norway 18) 100.00 NOK 228 NOK 21<br />
GERLING Sustainable Development Project-GmbH, Cologne, Germany 100.00 55 –6<br />
Gerling-Konzern Panamericana Ltda., São Paulo, Brazil 18) 100.00 BRL 629 BRL –67<br />
H. J. Roelofs Assuradeuren B. V., Rotterdam, Netherlands 18) 100.00 718 8<br />
Hannover Life Re Consultants, Inc., Orlando, USA 18) 50.22 USD 181 USD 37<br />
Hannover Re Consulting Services India Private Limited, Mumbai, India 20) 50.22 INR 45,643 INR 5,643<br />
Hannover Re Services Italy S. r. L., Milan, Italy 11) 50.04 313 91<br />
Hannover Re Services Japan, Tokyo, Japan 50.22 JPY 90,297 JPY 3,690<br />
Hannover Re Services USA, Inc., Itasca, USA 50.22 USD 794 USD 78<br />
Hannover Risk Consultants B. V., Rotterdam, Netherlands 18) Hannover Rückversicherung AG Escritorio de Representação no Brasil Ltda.,<br />
100.00 349 7<br />
Rio de Janeiro, Brazil 18) 50.22 BRL 35 BRL 107<br />
Hannover Services (Mexico) S. A. de C. V., Mexico City, Mexico 11) 50.22 MXN 11,022 MXN 1,031<br />
Hannoversch-Kölnische Beteiligungsgesellschaft mbH, Hannover, Germany 7) 50.00 — —<br />
HDI Direkt Service GmbH, Hannover, Germany 3) HDI-Gerling Beschäftigungs-und Qualifi zierungsgesellschaft mbH,<br />
100.00 51 –319<br />
Hannover, Germany 3) 100.00 25 –22<br />
HDI-Gerling Services S. A., Brussels, Belgium 18) 100.00 143 31<br />
HDI-Gerling Sicherheitstechnik GmbH, Hannover, Germany 100.00 1,875 1,233<br />
HDI-Gerling Versicherungs-Service AG, Zurich, Switzerland 18) 100.00 CHF 1,346 CHF –61<br />
HR Hannover Re Correduria de Reaseguros S. A., Madrid, Spain 11) 50.22 198 30<br />
International Mining Industry Underwriters Ltd., London, United Kingdom 11) Kommanditgesellschaft Trans Leben Grundstücksverwaltungs-GmbH & Co.,<br />
50.22 GBP 358 GBP 57<br />
Hamburg, Germany 18) 100.00 1 –356<br />
LRA Superannuation Plan Pty Ltd., Sydney, Australia 22) 50.22 AUD — AUD —<br />
Mediterranean Reinsurance Services Ltd., Hong Kong, China 21) 50.22 USD — USD —<br />
Paetau Sports Versicherungsmakler GmbH, Berlin, Germany 99.00 344 11<br />
Scandinavian Marine Agency AS, Oslo, Norway 18) 52.00 NOK 5,196 NOK 1,483<br />
Shamrock Marine-Insurance Agency GmbH, Hamburg, Germany 3) 100.00 25 –5<br />
SSV Schadenschutzverband GmbH, Hannover, Germany 3) 100.00 200 234<br />
Svedea AB, Stockholm, Sweden 23) 37.77 SEK — SEK —<br />
THS Services Versicherungsvermittlungs GmbH, Berlin, Germany 99.00 13 15<br />
THV Versicherungsmakler GmbH, Berlin, Germany<br />
VES Gesellschaft f. Mathematik, Verwaltung und EDV mbH,<br />
99.00 2,014 251<br />
Gevelsberg, Germany 3) 100.00 195 –950
Notes List of shareholdings for the consolidated fi nancial statement<br />
Calculated<br />
share of<br />
7. Participating interests<br />
capital1) Capital and<br />
reserves<br />
in %<br />
2) Result before<br />
profi t/loss<br />
in<br />
transfer<br />
EUR thousand<br />
2) in<br />
EUR thousand<br />
DFA Capital Management, Inc., Wilmington, USA 18) 25.40 USD 1,177 USD –1,928<br />
IGEPA Gewerbepark GmbH & Co. Vermietungs KG, Munich, Germany 18) 37.50 –11,272 8,764<br />
8. Participating interests of Hannover Re in large public limited companies in<br />
respect of which the participation exceeds 5% of the voting rights in %<br />
Capital and<br />
reserves 2) in<br />
EUR thousand<br />
Result before<br />
profi t/loss<br />
transfer 2) in<br />
EUR thousand<br />
Acte Vie S. A. Compagnie d’Assurances sur la Vie et de Capitalisation,<br />
Strasbourg, France 18) 9.38 8,118 136<br />
1) In the case of participating interests held in part indirectly, the calculated shares have been specifi ed<br />
2) The fi gures correspond to the annual fi nancial statements of the companies according to the applicable local law or international accounting;<br />
diverging currencies are indicated<br />
3) A profi t/loss transfer agreement exists<br />
4) Subgroup accounts: included in the fi gures for Hannover Finance Inc.<br />
5) Subgroup accounts: included in the fi gures for Hannover Reinsurance Group Afr ica (Pty) Ltd.<br />
6) Subgroup accounts: included in the fi gures for Hannover Re Real Estate Holdings Inc.<br />
7) No data pursuant to § 286 Para. 3 Commercial Code (HGB)<br />
8) The exemption aff orded by § 264 b Commercial Code (HGB) was utilized<br />
9) The company prepares its own subgroup accounts<br />
10) Certain equity items are not counted under IFRS, as a consequence of which the amount of capital and reserves can be negative here. According to the local accounting<br />
practice relevant for supervisory purposes, the company is adequately capitalized.<br />
11) Provisional/unaudited fi gures<br />
12) Figures as per IFRS<br />
13) Also allocated to the Retail Germany segment<br />
14) Also allocated to the Life/Health Reinsurance segment<br />
15) Also allocated to the Industrial Lines segment<br />
16) The facilities aff orded by § 264 Para. 3 Commercial Code (HGB) were utilized<br />
17) Signifi cant infl uence evidenced by board representation pursuant to IAS 28.7 (a)<br />
18) Figures at fi nancial year-end 2009<br />
19) Figures as at 30 September 2010<br />
20) Figures at fi nancial year-end 31 March 2010<br />
21) Company is in liquidation<br />
22) Company is inactive and does not compile an annual report<br />
23) Company was newly established in 2010; an annual fi nancial statement is not yet available<br />
Drawn up and released for publication in Hannover, 28 March 2011<br />
Hannover, 28 March 2011<br />
Board of Management<br />
Haas Dr. Hinsch Leue Dr. Noth<br />
Dr. Querner Dr. Roß Wallin<br />
263
264 <strong>Talanx</strong> Group Annual report 2010<br />
Auditors’ report<br />
We have audited the consolidated fi nancial statements prepared by <strong>Talanx</strong> Aktiengesellschaft , Hannover,<br />
comprising the consolidated balance sheet, consolidated income statement, consolidated<br />
statement of comprehensive income, consolidated statement of changes in equity, cash fl ow statement<br />
and notes to the consolidated fi nancial statements, together with the group management<br />
report for the business year from 1 January to 31 December 2010. The preparation of the consolidated<br />
fi nancial statements and the group management report in accordance with IFRS, as adopted by<br />
the EU, and the additional requirements of German commercial law pursuant to § 315a Para 1 HGB<br />
and supplementary provisions of the Articles of Incorporation are the responsibility of the parent<br />
company’s management. Our responsibility is to express an opinion on the consolidated fi nancial<br />
statements and on the group management report based on our audit.<br />
We conducted our audit of the consolidated fi nancial statements in accordance with § 317 HGB and<br />
German generally accepted standards for the audit of fi nancial statements promulgated by the Institut<br />
der Wirtschaft sprüfer (IDW). Those standards require that we plan and perform the audit such<br />
that misstatements materially aff ecting the presentation of the net assets, fi nancial position and<br />
results of operations in the consolidated fi nancial statements in accordance with the applicable<br />
fi nancial reporting framework and in the group management report are detected with reasonable<br />
assurance. Knowledge of the business activities and the economic and legal environment of the<br />
Group and expectations as to possible misstatements are taken into account in the determination<br />
of audit procedures. The eff ectiveness of the accounting-related internal control system and the<br />
evidence supporting the disclosures in the consolidated fi nancial statements and the group management<br />
report are examined primarily on a test basis within the framework of the audit. The audit<br />
includes assessing the annual fi nancial statements of those entities included in consolidation,<br />
the determination of entities to be included in consolidation, the accounting and consolidation<br />
principles used and signifi cant estimates made by management, as well as evaluating the overall<br />
presentation of the consolidated fi nancial statements and group management report. We believe<br />
that our audit provides a reasonable basis for our opinion.<br />
Our audit has not led to any reservations.<br />
In our opinion, based on the fi ndings of our audit, the consolidated fi nancial statements comply<br />
with IFRS, as adopted by the EU, the additional requirements of German commercial law pursuant<br />
to § 315a Para. 1 HGB and the supplementary provisions of the Articles of Incorporation and give<br />
a true and fair view of the net assets, fi nancial position and results of operations of the Group in<br />
accordance with these requirements. The group management report is consistent with the consolidated<br />
fi nancial statements and as a whole provides a suitable view of the Group’s position and<br />
appropriately presents the opportunities and risks of future development.<br />
Hannover, 28 March 2011<br />
KPMG AG<br />
Wirtschaft sprüfungsgesellschaft<br />
Dr. Ellenbürger Husch<br />
(German Public Auditor) (German Public Auditor)
Our locations<br />
Australia<br />
Hannover Life Re of Australasia Ltd<br />
Level 7<br />
70 Phillip Street<br />
Sydney NSW 2000<br />
Telephone +61 2 9251-6911<br />
Fax +61 2 9251-6862<br />
Hannover Rückversicherung AG<br />
Australian Branch – Chief Agency<br />
The Re Centre, Level 21<br />
Australia Square<br />
264 George Street<br />
Sydney NSW 2000<br />
Telephone +61 2 9274-3000<br />
Fax +61 2 9274-3033<br />
■ HDI-Gerling Australia Insurance<br />
■ HDI-Gerling Industrie Versicherung AG,<br />
Australia Branch<br />
44 Pitt Street, Level 4<br />
Sydney NSW 2000<br />
Telephone +61 2 8274-4200<br />
Fax +61 2 9247-1711<br />
Austria<br />
HDI-Gerling Lebensversicherung AG<br />
Galaxy 21<br />
Praterstr. 31<br />
1020 Vienna<br />
Telephone +43 120 709-220<br />
Fax +43 120 709-900<br />
HDI Versicherung AG<br />
Edelsinnstr. 7–11<br />
1120 Vienna<br />
Telephone +43 50 905 501-0<br />
Fax +43 50 902 502-0<br />
Bahrain<br />
■ Hannover ReTakaful B.S.C. (c)<br />
■ Hannover Rückversicherung AG,<br />
Bahrain Branch<br />
Al Zamil Tower<br />
17 th floor<br />
Government Avenue<br />
Manama Center 305<br />
Manama<br />
Telephone +973 17 214-766<br />
Fax +973 17 214-667<br />
Belgium<br />
HDI-Gerling Verzekeringen N.V./<br />
HDI-Gerling Assurances S. A.<br />
Avenue de Tervuren 273 B1<br />
1150 Brussels<br />
Telephone +32 2 7730-811<br />
Fax +32 2 7730-950<br />
Bermuda<br />
Hannover Life Reassurance Bermuda Ltd.<br />
Victoria Place, 2 nd floor,<br />
31 Victoria Street<br />
Hamilton, HM 10<br />
Telephone +1 441 2952827<br />
Fax +1 441 2952844<br />
Hannover Re (Bermuda) Ltd.<br />
Victoria Place, 2 nd floor,<br />
31 Victoria Street<br />
Hamilton, HM 10<br />
Telephone +1 441 2943110<br />
Fax +1 441 2967568<br />
Brazil<br />
Hannover Rückversicherung AG<br />
EscritÓrio de Representação no Brasil Ltda.<br />
Praça Floriano, 19/1701<br />
CEP 20 031 050<br />
Rio de Janeiro<br />
Telephone +55 21 2217 9500<br />
Fax +55 21 2217 9515<br />
HDI Seguros S. A.<br />
Avenida Eng. Luís Carlos Berrini<br />
901–5° andar<br />
04571-010 São Paulo-SP<br />
Telephone +55 11 550 519-95<br />
Fax +55 11 550 515-11<br />
Bulgaria<br />
HDI Zahstrahovane AD<br />
G.S. Rakovski No 99<br />
1000 Sofia<br />
Telephone +359 2 930-9050<br />
Fax +359 2 987-9167<br />
Canada<br />
Hannover Rückversicherung AG<br />
Canadian Branch – Chief Agency<br />
3650 Victoria Park Avenue, Suite 201<br />
Toronto, Ontario M2H 3P7<br />
Telephone +1 416 496-1148<br />
Fax +1 416 496-1089<br />
Hannover Rückversicherung AG<br />
Canadian Branch – Facultative Office<br />
130 King St, West, Suite 2125<br />
Toronto, Ontario M5X 1A4<br />
Telephone +1 416 867-9712<br />
Fax +1 416 867-9728<br />
Chile<br />
HDI Seguros S. A.<br />
Encomenderos 113<br />
Las Condes/Santiago<br />
Telephone +56 2 422 9000<br />
Fax +56 2 422 9400<br />
China<br />
Hannover Rückversicherung AG<br />
Hong Kong Branch<br />
2008 Sun Hung Kai Centre<br />
30 Harbour Road<br />
Wan Chai, Hong Kong<br />
Telephone +852 2519 3208<br />
Fax +852 2588 1136<br />
Hannover Rückversicherung AG<br />
Shanghai Branch<br />
Suite 3307, China Fortune Tower<br />
1568 Century Boulevard<br />
Pudong<br />
200122 Shanghai<br />
Telephone +86 21 5081-9585<br />
Fax +86 21 5820-9396<br />
HDI-Gerling Industrie Versicherung AG<br />
Hong Kong Branch<br />
Room 5202, Central Plaza<br />
18, Harbour Road<br />
Wan Chai, Hong Kong<br />
Telephone +852 25 98-8338<br />
Fax +852 25 98-8838<br />
Colombia<br />
Hannover Rückversicherung AG<br />
Bogotá Representative Office<br />
Facultative Business<br />
Calle 98 No. 21–50<br />
Office Number 901<br />
Centro Empresarial 98<br />
Bogotá<br />
Telephone +57 1 6420066-200<br />
Fax +57 1 6420273<br />
Auditors’ report. Adresses 265
266<br />
<strong>Talanx</strong> Group Other information<br />
Czech Republic<br />
HDI Versicherung AG<br />
Czech Republic Branch<br />
Jugoslávská 620/29<br />
120 00 Praha 2<br />
Telephone +420 2 2019 0203<br />
Fax +420 2 2019 0299<br />
France<br />
Hannover Rückversicherung AG<br />
Succursale Française<br />
109 rue de la Boétie<br />
(Entrance 52 avenue de Champs Elysées)<br />
75008 Paris<br />
Telephone +33 1 4561 73-00 (life)<br />
Telephone +33 1 4561 73-40 (non-life)<br />
Fax +33 1 4561 73-60<br />
HDI-Gerling Industrie Versicherung AG<br />
France Branch<br />
Tour Opus 12 – La Défense 9<br />
77 Esplanade du Générale de Gaulle<br />
92914 Paris La Défense Cedex<br />
Telephone +33 1 44 0556-00<br />
Fax +33 1 44 0556-66<br />
Germany<br />
■ AmpegaGerling<br />
Investment GmbH<br />
■ <strong>Talanx</strong> Asset<br />
Management GmbH<br />
■ <strong>Talanx</strong> Immobilien<br />
Management GmbH<br />
Charles-de-Gaulle-Platz 1<br />
50679 Cologne<br />
Telephone +49 221 790799-0<br />
Fax +49 221 790799-999<br />
E+S Rückversicherung AG<br />
Karl-Wiechert-Allee 50<br />
30625 Hannover<br />
Telephone +49 511 5604-0<br />
Fax +49 511 5604-1188<br />
Hannover Rückversicherung AG<br />
Karl-Wiechert-Allee 50<br />
30625 Hannover<br />
Telephone +49 511 5604-0<br />
Fax +49 511 5604-1188<br />
■ HDI Direkt Versicherung AG<br />
■ HDI-Gerling Firmen und Privat<br />
Versicherung AG<br />
■ HDI-Gerling Industrie Versicherung AG<br />
Riethorst 2<br />
30659 Hannover<br />
Telephone +49 511 645-0<br />
Fax +49 511 645-4545<br />
HDI-Gerling Lebensversicherung AG<br />
HDI-Gerling Pensionsfonds für die<br />
Wirtschaft AG<br />
HDI-Gerling Pensionskasse AG<br />
Charles-de-Gaulle-Platz 1<br />
50679 Cologne<br />
Telephone +49 221 144-0<br />
Fax +49 221 144-3833<br />
HDI-Gerling Pensionsmanagement AG<br />
Charles-de-Gaulle-Platz 1<br />
50679 Cologne<br />
Telephone +49 221 144-69200<br />
HDI-Gerling Sicherheitstechnik GmbH<br />
Riethorst 2<br />
30659 Hannover<br />
Telephone +49 511 645-4126<br />
Fax +49 511 645-4545<br />
■ Neue Leben Holding AG<br />
■ Neue Leben Lebensversicherung AG<br />
■ Neue Leben Unfallversicherung AG<br />
Sachsenstrasse 8<br />
20097 Hamburg<br />
Telephone +49 40 23891-0<br />
Fax +49 40 23891-333<br />
PB Versicherungen<br />
Proactiv-Platz 1<br />
40721 Hilden<br />
Telephone +49 2103 34-5100<br />
Fax +49 2103 34-5109<br />
Protection Reinsurance Intermediaries AG<br />
Karl-Wiechert-Allee 57<br />
30625 Hannover<br />
Telephone +49 511 54223-0<br />
Fax +49 511 54223-200<br />
■ <strong>Talanx</strong> AG<br />
■ <strong>Talanx</strong> Deutschland AG<br />
■ <strong>Talanx</strong> Service AG<br />
■ <strong>Talanx</strong> Systeme AG<br />
Riethorst 2<br />
30659 Hannover<br />
Telephone +49 511 3747-0<br />
Fax +49 511 3747-2525<br />
<strong>Talanx</strong> International AG<br />
Riethorst 2<br />
30659 Hannover<br />
Telephone +49 511 645-0<br />
Fax +49 511 645-4545<br />
TARGO Versicherungen<br />
Proactiv-Platz 1<br />
40721 Hilden<br />
Telephone +49 2103 34-7100<br />
Fax +49 2103 34-7109<br />
Greece<br />
HDI-Gerling Industrie Versicherung AG<br />
Greece Branch<br />
11 Omirou & 1 Vissarionos Street<br />
10672 Athens<br />
Telephone +30 210 7259-181<br />
Fax +30 210 7259-177<br />
Hungary<br />
HDI Versicherung AG<br />
Hungary Branch<br />
Batthyany u. 65<br />
1015 Budapest<br />
Telephone +36 1 2482-820<br />
Fax +36 1 2482-829<br />
■ Magyar Posta Életbiztosító Zrt.<br />
■ Magyar Posta Biztosító Zrt.<br />
Bégutca 3-5<br />
1022 Budapest<br />
Telephone +36 1 4234-200<br />
Fax +36 1 4234-210<br />
India<br />
Hannover Re Consulting Services<br />
India Private Limited<br />
215 Atrium<br />
‚C‘ Wing, Unit 616, 6 th floor<br />
Andheri-Kurla Rd.<br />
Andheri (East)<br />
Mumbai 400069<br />
Telephone +91 22 613808-08<br />
Fax +91 22 613808-10<br />
Ireland<br />
Hannover Life Reassurance (Ireland) Limited<br />
No. 4 Custom House Plaza, IFSC<br />
Dublin 1<br />
Telephone +353 1 612-5718<br />
Fax +353 1 673-6917<br />
Hannover Reinsurance (Ireland) Ltd.<br />
No. 2 Custom House Plaza, IFSC<br />
Dublin 1<br />
Telephone +353 1 612-5700<br />
Fax +353 1 829-1400
Italy<br />
Hannover Re Services Italy S.r.l.<br />
Via Dogana, 1<br />
20123 Milan<br />
Telephone +39 02 8068 1311<br />
Fax +39 02 8068 1349<br />
HDI Assicurazioni S.p.A.<br />
Via Abruzzi 10 b<br />
00187 Rome<br />
Telephone +39 06 42103-1<br />
Fax +39 06 42103-500<br />
HDI-Gerling Industrie Versicherung AG<br />
Italy Branch<br />
Via Franco Russoli, 5<br />
20143 Milan<br />
Telephone +39 02 83113-400<br />
Fax +39 02 83113-202<br />
Japan<br />
Hannover Re Services Japan KK<br />
7 th floor, Hakuyo Building<br />
3–10 Nibancho Chiyoda-ku<br />
Tokyo 102-0084<br />
Telephone +81 3 5214-1101<br />
Fax +81 3 5214-1105<br />
HDI-Gerling Industrie Versicherung AG<br />
Japan Branch<br />
Sanbancho KS Building 7F<br />
2 Banchi, Sanbancho Chiyoda-ku<br />
Tokyo 102-0075<br />
Telephone +81 3 5214-1361<br />
Fax +81 3 5214-1365<br />
Korea<br />
Hannover Rückversicherung AG<br />
Korea Branch<br />
Room 414, 4 th floor<br />
Gwanghwamoon Officia B/D<br />
163, Shinmunro-1ga, Jongro-gu<br />
Seoul 110-999<br />
Telephone +82 2 3700 0600<br />
Fax +82 2 3700 0699<br />
Luxembourg<br />
Euro International Reinsurance S. A.<br />
43, Boulevard du Prince Henri<br />
1724 Luxembourg<br />
Telephone +35 224-1842<br />
Fax +35 224-1853<br />
<strong>Talanx</strong> Finanz (Luxemburg) S. A.<br />
5, Rue Eugène Ruppert<br />
2453 Luxembourg<br />
Telephone +35 224-1842<br />
Fax +35 224-1853<br />
Malaysia<br />
Hannover Rückversicherung AG<br />
Malaysian Branch<br />
Suite 31-1, 31 st floor<br />
Wisma UOA II<br />
No. 21 Jalan Pinang<br />
50450 Kuala Lumpur<br />
Telephone +60 3 2687 3600<br />
Fax +60 3 2687 3760<br />
Mexico<br />
Hannover Services (México) S. A. de C. V.<br />
German Centre, Oficina 4-4-28<br />
Av. Santa Fé No. 170<br />
Col. Lomas de Santa Fé<br />
C.P. 01210 Mexico-City, D.F.<br />
Telephone +52 55 9140 0800<br />
Fax +52 55 9140 0815<br />
HDI-Gerling de México Seguros S. A.<br />
Av. Paseo de las Palmas N. 239–104<br />
Col. Lomas de Chapultepec<br />
11000 Mexico-City, D.F.<br />
Telephone +52 55 5202-7534<br />
Fax +52 55 5202-9679<br />
HDI Seguros S. A. de C. V.<br />
Paseo de los Insurgentes 1701<br />
Col. Granada<br />
León, Guanajuato<br />
Telephone +52 477 7104764<br />
Fax +52 477 7104786<br />
Netherlands<br />
HDI-Gerling Verzekeringen N. V.<br />
Westblaak 14<br />
3012 KL Rotterdam<br />
Telephone +31 10 403-6100<br />
Fax +31 10 403-6275<br />
Norway<br />
HDI-Gerling Industrie Versicherung AG<br />
Norway Branch<br />
C. J. Hambros plass 2D<br />
0164 Oslo<br />
Telephone +47 232 136-50<br />
Fax +47 232 136-51<br />
Poland<br />
HDI Asekuracja TU S. A.<br />
ul. Plocka 11/13<br />
01-231 Warsaw<br />
Telephone +48 22 534-4000<br />
Fax +48 22 534-4001<br />
HDI-Gerling Życie TU S. A.<br />
ul. Hrubieszowska 2<br />
01-209 Warsaw<br />
Telephone +48 22 537-2450<br />
Fax +48 22 537-2001<br />
Russia<br />
OOO Strakhovaya Kompaniya<br />
“CiV Life”<br />
30/1 Obrucheva street<br />
Moscow, 117485<br />
Telephone +7 495 967 9 267<br />
Fax +7 495 967 9 260<br />
OOO Strakhovaya Kompaniya<br />
“HDI Strakhovanie”<br />
30/1 Obrucheva street<br />
Moscow, 117485<br />
Telephone +7 495 967 9 257<br />
Fax +7 495 967 9 260<br />
Slovak Republic<br />
HDI Versicherung AG<br />
Slovak Republic Branch<br />
Štúrova 11<br />
811 02 Bratislava<br />
Telephone +421 2 5 710 8611<br />
Fax +421 2 5 710 8618<br />
Adresses 267
268<br />
<strong>Talanx</strong> Group Other information<br />
South Africa<br />
Compass Insurance Company Limited<br />
P. O. Box 37226<br />
Birnam Park 2015<br />
Johannesburg<br />
Telephone +27 11 7458-333<br />
Fax +27 11 7458-444<br />
■ Hannover Life Reassurance Africa Limited<br />
■ Hannover Reinsurance Africa Limited<br />
■ Hannover Reinsurance Group Africa<br />
(Pty) Ltd.<br />
P. O. Box 85321<br />
Emmarentia 2029<br />
Johannesburg<br />
Telephone +27 11 4816-500<br />
Fax +27 11 4843330/32<br />
HDI-Gerling Insurance of South Africa Ltd.<br />
P. O. Box 66<br />
Saxonwold<br />
2132 Johannesburg<br />
Telephone +27 11 340-0100<br />
Fax +27 11 447-4981<br />
Spain<br />
HDI HANNOVER International España<br />
Cía de Seguros y Reaseguros S. A.<br />
c/Luchana, 23–6°<br />
28010 Madrid<br />
Telephone +34 91 444-2000<br />
Fax +34 91 444-2019<br />
HDI HANNOVER International España<br />
Cía de Seguros y Reaseguros S. A.<br />
c/Rosellón, 216–09°<br />
08008 Barcelona<br />
Telephone +34 93 272 10-00<br />
Fax +34 93 238 76-70<br />
HR Hannover Re<br />
Correduría de Reaseguros, S. A.<br />
Paseo del General Martínez Campos 46<br />
28010 Madrid<br />
Telephone +34 91 319-0049<br />
Fax +34 91 319-9378<br />
Sweden<br />
Hannover Rückversicherung AG,<br />
Tyskland filial<br />
Hantverkargatan 25<br />
P. O. Box 22085<br />
10422 Stockholm<br />
Telephone +46 8 617 5400<br />
Fax +46 8 617 5597 (life)<br />
Fax +46 8 617 5593 (non-life)<br />
International Insurance Company<br />
of Hannover Ltd., England filial<br />
Hantverkargatan 25<br />
P. O. Box 22085<br />
10422 Stockholm<br />
Telephone +46 8 617 5400<br />
Fax +46 8 617 5592<br />
Switzerland<br />
HDI-Gerling Industrie Versicherung AG<br />
Switzerland Branch<br />
Dufourstrasse 46<br />
8034 Zurich<br />
Telephone +41 44 265-4747<br />
Fax +41 44 265-4748<br />
Taiwan<br />
Hannover Rückversicherung AG<br />
Taipei Representative Office<br />
Rm. 902, 9F, No. 129, Sec. 3<br />
Misheng E. Road<br />
Taipeh<br />
Telephone +886 2 8770-7792<br />
Fax +886 2 8770-7735<br />
Turkey<br />
CiV Hayat Sigorta A.Ş.<br />
Saray Mah. Ö. Faik Atakan Caddesi<br />
Yılmaz Plaza No: 3<br />
34768 Ümraniye, Istanbul<br />
Telephone +90 216 633-1700<br />
Fax +90 216 633-1709<br />
HDI Sigorta A. Ş.<br />
Büyükdere Caddesi<br />
C.E.M. Iş Merkezi No: 23 Kat: 7-8-9<br />
34381 Şişli/Istanbul<br />
Telephone +90 212 368-6000<br />
Fax +90 212 368-6010<br />
Ukraine<br />
HDI Strakhuvannya<br />
102, Chervonoarmiyska Str.<br />
03150 Kiev<br />
Telephone +38 44 247 4477<br />
Fax +38 44 529 0894<br />
United Kingdom<br />
■ Hannover Life Reassurance (UK) Limited<br />
■ Hannover Services (UK) Limited<br />
Hannover House<br />
Virginia Water<br />
Surrey GU25 4AA<br />
Telephone +44 1344 845-282<br />
Fax +44 1344 845-383<br />
HDI-Gerling Industrie Versicherung AG<br />
United Kingdom Branch<br />
1 Great Tower Street<br />
London EC3R 5AA<br />
Telephone +44 20 7696-8099<br />
Fax +44 20 7696-8444<br />
International Insurance Company of<br />
Hannover Limited<br />
1 Arlington Square<br />
Bracknell<br />
Berkshire RG12 1WA<br />
Telephone +44 1344 397600<br />
Fax +44 1344 397601<br />
London office:<br />
10 Fenchurch Street<br />
London EC3M 3BE<br />
Telephone +44 20 7015-4000<br />
Fax +44 20 7017-4001<br />
USA<br />
Hannover Life Reassurance Company<br />
of America<br />
800 N. Magnolia Avenue<br />
Suite 1400<br />
Orlando, FL 32803-3268<br />
Telephone +1 407 649-8411<br />
Fax +1 407 649-8322<br />
Hannover Re Services USA, Inc.<br />
500 Park Blvd., Suite 1360<br />
Itasca, IL 60143<br />
Telephone +1 630 250-5517<br />
Fax +1 630 250-5527<br />
HDI-Gerling America Insurance Company<br />
150 North Wacker Drive, 29 th floor<br />
Chicago, IL 60606<br />
Telephone +1 312 580-1900<br />
Fax +1 312 580-0700
Glossary. A–C<br />
Accumulation risk<br />
Underwriting risk that a single trigger event (e.g. an earthquake<br />
or hurricane) can lead to an accumulation of claims within a ><br />
portfolio.<br />
Acquisition costs<br />
Costs incurred by an insurance company when insurance policies<br />
are taken out or renewed (e.g. new business commission, costs of<br />
proposal assessment or underwriting).<br />
Actuary<br />
Mathematician who deals with questions relating to insurance,<br />
investments and retirement provision.<br />
Administrative expenses<br />
Costs of current administration connected with the production of<br />
insurance coverage.<br />
Annual Premium Equivalent – APE<br />
Industry standard for measuring new business income in life<br />
insurance.<br />
Asset management<br />
Supervision and management of investments according to risk<br />
and return considerations.<br />
Associated company<br />
Company included in the consolidated financial statement not<br />
through full or proportionate consolidation but normally using<br />
the > equity method and over whose business or company <strong>policy</strong><br />
a company included in the consolidated financial statement<br />
exerts a significant influence.<br />
Bancassurance<br />
Partnership between a bank/postal service partner and an<br />
insurance company for the purpose of selling insurance products<br />
through the banking/postal service partner’s branches. The linkage<br />
between insurer and bank often takes the form of a capital<br />
participation or a long-term strategic cooperation between the<br />
two partners.<br />
Benefit reserve<br />
Value arrived at using mathematical methods for future liabilities<br />
(present value of future liabilities minus present value of future<br />
incoming premiums), especially in life and health insurance.<br />
Black/Scholes option pricing model<br />
Analytical model used to calculate theoretical option prices. It<br />
makes allowance for the current price of the underlying stock,<br />
the risk-free interest rate, the remaining time until option expiration,<br />
the > volatility and possible dividend payments within the<br />
remaining period.<br />
Cash flow statement<br />
Statement on the origin and utilization of cash and cash equivalents<br />
during the accounting period. It shows the changes in liquid<br />
funds separated into cash flows from operating, investing and<br />
financing activities.<br />
Catastrophe bond (also: cat bond)<br />
Instrument used to transfer catastrophe risks of a (re)insurer to<br />
the capital market.<br />
Cedant (also: ceding company)<br />
Primary insurer or reinsurer that passes on (cedes) shares of its<br />
insured risks to a reinsurer in exchange for a premium.<br />
Claims equalization reserve<br />
> equalization reserve<br />
Adresses. Glossary 269<br />
Coinsurance funds withheld treaty<br />
Type of coinsurance contract where the ceding company retains<br />
a portion of the original premium at least equal to the ceded<br />
reserves. Similar to a > Modified coinsurance contract, the interest<br />
payment to the reinsurer reflects the investment return on<br />
the underlying asset portfolio.<br />
Combined ratio<br />
Sum of the > loss ratio and > expense ratio plus interest income<br />
on funds withheld and contract deposits in relation to earned<br />
premiums. When calculating the adjusted combined ratio, the<br />
claims and claims expenses are adjusted so as to eliminate the<br />
effect of interest income on funds withheld and contract deposits.<br />
This ratio is used by both property/casualty insurers and nonlife<br />
reinsurers.<br />
Commission<br />
Remuneration paid by a primary insurer to agents, brokers and<br />
other professional intermediaries.<br />
Compliance<br />
Statutory regulations and undertaking-specific rules governing<br />
the responsible and lawful actions of an undertaking and its<br />
employees.<br />
Consolidation<br />
In accounting practice: combining of the individual financial<br />
statements of several companies belonging to one group into a<br />
consolidated financial statement. In so doing, internal transactions<br />
within the group are eliminated.<br />
Corporate Governance<br />
System that serves to ensure responsible management and<br />
supervision of enterprises and is intended to foster the trust of<br />
investors, clients, employees and the general public in companies.<br />
Credit status<br />
Also creditworthiness. Ability of a debtor to meet its payment<br />
commit ments.
270<br />
<strong>Talanx</strong> Group Other information<br />
D–H<br />
Deferred taxes<br />
Term denoting the difference between the taxes calculated on<br />
the profit reported in the commercial balance sheet and those<br />
carried in the tax balance sheet, which then evens out in subsequent<br />
months. Deferred taxes are recognized in order to offset<br />
this difference in those cases where it is evident that it will be<br />
eliminated over time.<br />
Deposit accounting<br />
An accounting method originating in US accounting principles for<br />
the recognition of short-term and multi-year insurance and reinsurance<br />
contracts with no significant underwriting risk transfer.<br />
Derivative<br />
Financial products derived from underlying primary instruments<br />
such as equities, fixed-income securities and foreign exchange<br />
instruments, the fair value of which is determined inter alia on<br />
the basis of the underlying security or other reference asset.<br />
Derivatives include swaps, options and futures.<br />
Due diligence audit<br />
Auditing of a participating interest in the run-up to acquisition or<br />
merger. It encompasses, in particular, a systematic analysis of the<br />
strengths and weaknesses of the proposition, analysis of the risks<br />
associated with the acquisition and a well-founded valuation of<br />
the item in question.<br />
Duration<br />
Ratio in investment mathematics that represents the average<br />
commitment period of the cash value of a financial instrument.<br />
The duration can thus also be considered a measure of the interest<br />
rate risk associated with a financial instrument.<br />
Earned premiums<br />
Proportion of written premiums attributable to the insurance<br />
protection in the financial year.<br />
EBIT<br />
Earnings before interest and tax. > operating profit<br />
Embedded value<br />
Benchmark used to measure the performance of life insurance<br />
enter prises. It is composed of the sum total of free assets (net<br />
asset value) plus the present value of the projected stream of<br />
future after-tax profits on the in-force insurance portfolio.<br />
Equalization reserve<br />
Provision constituted to offset significant fluctuations in the loss<br />
experience of individual lines over a number of years.<br />
Equity method<br />
Method of accounting used to measure equity investments<br />
(associated companies) in the consolidated financial statement.<br />
Expenditures on insurance business<br />
(acquisition costs and administrative expenses)<br />
Sum total of commissions, sales, personnel and material costs as<br />
well as regular administrative expenses.<br />
Expense ratio<br />
Ratio of acquisition costs and administrative expenses (net) to<br />
net premium earned.<br />
Exposure<br />
Level of danger inherent in a risk or portfolio of risks.<br />
Facultative reinsurance<br />
Participation on the part of the reinsurer in a particular individual<br />
risk assumed by the primary insurer.<br />
Fair value<br />
Fair value is the amount for which an asset could be exchanged,<br />
or a liability settled, between knowledgeable, willing parties in an<br />
arm’s length transaction.<br />
Funds held by ceding companies/<br />
funds held under reinsurance treaties<br />
Collateral provided to cover insurance liabilities which an insurer<br />
retains from the liquid funds which it is to pay to a reinsurer<br />
under a reinsurance treaty. In this case, the insurer shows funds<br />
held under a reinsurance treaty, while the reinsurer shows funds<br />
held by a ceding company. Interest is payable on such funds held.<br />
Fund held by ceding companies are also referred to as an investment<br />
surrogate.<br />
Goodwill<br />
The amount that a purchaser is prepared to pay – in light of<br />
future profit expectations – above and beyond the value of all<br />
tangible and intangible assets after deduction of liabilities.<br />
Gross<br />
In insurance: before deduction of reinsurance.<br />
Hybrid capital<br />
Capital in the form of subordinated debt and surplus debenture<br />
that exhibits a hybrid character of equity and debt.
I–P<br />
Impairment<br />
Unscheduled write-down taken if the present value of the<br />
estimated future cash flows of an asset falls below the carrying<br />
amount.<br />
Insurance-linked securities<br />
Financial instruments used to securitize risks under which the<br />
payment of interest and/or nominal value is dependent upon the<br />
occurrence and magnitude of an insured event.<br />
Investment grade<br />
Rating of BBB or better awarded to an entity on account of its low<br />
risk of default.<br />
Issuer<br />
Public entity or private enterprise that issues securities, e.g. the<br />
federal government in the case of German Treasury Bonds or a<br />
joint-stock corporation in the case of shares.<br />
Letter of credit – LoC<br />
Bank guarantee. In the United States, for example, a common way<br />
of furnishing collateral in reinsurance business.<br />
Life/health insurance<br />
Lines of business concerned with the insurance of persons, i.e.<br />
life, annuity, health and personal accident.<br />
Life insurance<br />
Collective term covering those types of insurance which are<br />
concerned in a broader sense with risks associated with the<br />
uncertainties of life expectancy and life planning. These include<br />
death and disability, retirement provision as well as marriage and<br />
education.<br />
Loss ratio<br />
Net loss ratio shown in the balance sheet: percentage ratio of<br />
claims expenditure (net) including other technical income (net),<br />
but excluding any consolidation differences for technical items<br />
– including amortization of the shareholders’ portion of the PVFP –<br />
to net premium earned. > Present value of future profits<br />
Major claim (also: major loss)<br />
Claim that reaches an exceptional amount compared to the average<br />
claim for the risk group in question and exceeds a defined<br />
claims amount.<br />
Matching currency cover<br />
Coverage of technical liabilities in foreign currencies by means of<br />
corresponding investments in the same currency in order to avoid<br />
exchange-rate risks.<br />
Modified coinsurance (ModCo) treaty<br />
Type of reinsurance treaty where the ceding company retains the<br />
assets supporting the reinsured reserves by withholding a fund,<br />
thereby creating an obligation to render payments to the reinsurer<br />
at a later date. Such payments include a proportional share<br />
of the gross premium plus a return on the assets.<br />
Morbidity<br />
Incidence rate of disease relative to a given population group.<br />
Mortality<br />
Proportion of the total population dying within a given time<br />
interval.<br />
Net<br />
In insurance: used primarily to mean after deduction of reinsurance.<br />
Non-proportional reinsurance<br />
Reinsurance treaty under which the reinsurer assumes the loss<br />
expenditure or sum insured in excess of a defined amount.<br />
Operating profit (EBIT)<br />
Sum of the result of non-underwriting business and the underwriting<br />
result before the change (allocation or withdrawal) in the<br />
(claims) equalization reserve.<br />
OTC<br />
Over the counter. In the case of securities: not traded on a stock<br />
exchange.<br />
Passive reinsurance<br />
Existing reinsurance programs of primary insurers for their own<br />
protection against underwriting risks.<br />
Personal lines<br />
> Life/health insurance<br />
Policyholders’ surplus<br />
Total amount of shareholders’ equity excluding minority interests,<br />
which is comprised of the common shares, additional paid-in<br />
capital, retained earnings and cumulative other comprehensive<br />
income, as well as the minority interests in shareholders’ equity<br />
and so-called hybrid capital, as equity-replacing debt capital that<br />
encompasses the subordinated liabilities.<br />
Portfolio<br />
a) All risks assumed by a primary insurer or reinsurer as a totality<br />
or in a defined segment.<br />
b) Group of investments categorized according to specific criteria.<br />
Premiums<br />
Agreed compensation for the risks accepted by the insurer.<br />
Present value of future profits – PVFP<br />
Intangible asset primarily arising in particular from the purchase<br />
of life and health insurance companies or individual portfolios.<br />
The present value of expected future profits from the portfolio<br />
assumed is capitalized and amortized according to schedule.<br />
Impairments are taken on the basis of annual impairment tests.<br />
Glossary 271
272<br />
<strong>Talanx</strong> Group Other information<br />
P–R<br />
Primary (also: direct) insurer<br />
Company which accepts risks in exchange for an insurance premium<br />
and which has a direct contractual relationship with the<br />
<strong>policy</strong>holder (private individual, company, organization).<br />
Private equity<br />
Investment capital raised by private investors in contrast to public<br />
equity, i.e. capital raised on the stock exchange.<br />
Projected benefit obligation<br />
The present value of the earned portion of commitments from a<br />
defined benefit obligation.<br />
Property/casualty insurance<br />
All insurance lines with the exception of life insurance and health<br />
insurance: all lines in which the insured event does not trigger<br />
payment of an agreed fixed amount, but rather the incurred loss<br />
is reimbursed.<br />
Provision<br />
Liability item as at the balance sheet date to discharge obligations<br />
which exist but whose extent and/or due date is/are not<br />
known. Technical provisions, for example, are for claims which<br />
have already occurred but which have not yet been settled, or<br />
have only been partially settled (= provision for outstanding<br />
claims, abbreviated to: loss reserve)<br />
Purchase cost, amortized<br />
Cost of acquiring an asset item including all ancillary and incidental<br />
purchasing costs; in the case of wasting assets less scheduled<br />
and/or special amortization.<br />
PVFP<br />
> Present value of future profits<br />
Quota share reinsurance<br />
Form of reinsurance under which the percentage share of the<br />
written risk and the premium is contractually agreed. The administrative<br />
expenditure for the reinsurer is very low.<br />
Rate<br />
Percentage (normally applied to the subject premium) of a reinsured<br />
portfolio, which under a > non-proportional reinsurance<br />
treaty produces the reinsurance premium payable to the reinsurer.<br />
Rating<br />
Systematic evaluation of companies by a rating agency or bank<br />
with respect to their > credit status.<br />
Reinsurer<br />
Company that accepts risks or portfolio segments from a<br />
> primary insurer or another reinsurer in exchange for an<br />
agreed premium.<br />
Renewal<br />
Contractual relationships between insurers and reinsurers are<br />
main tained over long periods of time. The treaty terms and conditions<br />
are normally modified annually in so-called renewal negotiations,<br />
and the treaties are renewed accordingly.<br />
Retail business<br />
a) In general: business with private customers<br />
b) AmpegaGerling: business involving investment funds that are<br />
designed essentially for private, non-institutional investors,<br />
although such funds are also open for investments of group<br />
companies.<br />
Retention<br />
The part of the accepted risks which an insurer/reinsurer does not<br />
reinsure, i.e. carries for > net. Net written premium in relation to<br />
gross written premium (excluding savings elements of premium<br />
under unit-linked life and annuity insurance policies).<br />
Retrocession<br />
Ceding by a reinsurer of its risks or shares in its risks to other<br />
reinsurers.<br />
Retrocessionaire<br />
> Cedant, insofar as the ceded business involves reinsurance.<br />
Risk management system<br />
The complete set of rules and measures used to monitor and protect<br />
against risks.<br />
Run-off<br />
Fulfillment of liabilities for which reserves have been constituted.
S–V<br />
Segment reporting<br />
Presentation of asset and income data broken down into business<br />
segments and regions.<br />
Shareholders’ equity<br />
Funds provided by the owners of an enterprise for its internal<br />
financing or left within the company as earned profit (realized/<br />
unrealized). The capital providers are entitled to a share of the<br />
profit, e.g. in the form of a dividend, in return for making the<br />
shareholders’ equity available. Shareholders’ equity is equal to<br />
the total assets of the company less its total liabilities.<br />
Soft capital<br />
Capital components that are economically available but not yet<br />
recognized in the balance sheet: the loss reserve discount and the<br />
present value of future profits in life business that has not been<br />
capitalized, and on the company level the excess loss reserves.<br />
Soft market<br />
Market phase with oversupply of insurance, resulting in premiums<br />
that are not commensurate with the risk; this is in contrast<br />
to > hard market.<br />
Solvency<br />
Level of available unencumbered capital and reserves required to<br />
ensure that contracts can be fulfilled at all times.<br />
Solvency II<br />
Project of the European Commission to reform and harmonize<br />
European insurance regulations.<br />
Specialty lines<br />
a) In general: specialty insurance for niche business such as<br />
non-standard motor covers, fine arts insurance etc.<br />
b) Hannover Re: segment of the non-life reinsurance business<br />
group, encompassing marine and aviation business, credit/<br />
surety, structured products, ILS (insurance-linked securities),<br />
the London Market and direct business.<br />
Stress test<br />
Form of scenario analysis used to be able to make quantitative<br />
statements about the loss potential of portfolios in the event of<br />
extreme market fluctuations.<br />
Surplus participation<br />
Legally required, annually determined participation of <strong>policy</strong>holders<br />
in the surpluses generated by life insurers.<br />
Swap<br />
Agreement between two counterparties to swap payments at<br />
contractually defined conditions and times. Virtually any type of<br />
cash flow can be exchanged. This makes it possible to systematically<br />
hedge financial risks associated with a portfolio or to add<br />
new risks to a portfolio in order to optimize returns.<br />
Glossary<br />
Swaption<br />
Option contract which enables the buyer to enter into an interest<br />
rate swap (> swap) on or until a specific point in time in return for<br />
payment of a once-only premium. It facilitates hedging against<br />
rising interest rates without forfeiting the opportunity to obtain<br />
funding more reasonably if interest rates fall.<br />
Technical result<br />
Balance of income and expenditure allocated to the insurance<br />
business: balance of net premium earned and other technical<br />
income (net) as well as claims expenditure (net), acquisition costs<br />
and administrative expenses (net) and other technical expenses<br />
(net), including amortization of the shareholders’ portion of the<br />
PVFP but excluding consolidation differences from debt consolidation.<br />
> Present value of future profits<br />
Underlying<br />
Underlying instrument of a forward transaction, futures contract<br />
or option contract that serves as the basis for settlement and<br />
measure ment of the contract.<br />
Underwriting<br />
Process of examining and assessing (re)insurance risks in order to<br />
determine a commensurate premium for the risk in question. The<br />
purpose of underwriting is to diversify the underwriting risk in<br />
such a way that it is fair and equitable for the (re)insured and at<br />
the same time profitable for the (re)insurer.<br />
Unearned premium reserve<br />
Premiums written in a financial year which are to be allocated to<br />
the following period on an accrual basis.<br />
Unit-linked life insurance<br />
Life insurance under which the level of benefits depends on the<br />
performance of an investment fund allocated to the <strong>policy</strong> in<br />
question.<br />
Value at Risk<br />
Potential losses that with a certain probability will not be exceeded<br />
in a given period.<br />
Volatility<br />
Measure of variability with respect to stock/bond prices,<br />
exchange rates and interest rates, and also insurance lines that<br />
can have a sharply fluctuating claims experience.<br />
273
274<br />
<strong>Talanx</strong> Group Other information<br />
Index of key terms<br />
Advancement of woman 74<br />
Affiliated companies 195, 203<br />
Agents, independent 45, 77, 89, 91, 94, 172<br />
AmpegaGerling 24, 54, 55, 76, 105<br />
Annual Premium Equivalent (APE) 46<br />
Asset/liability management (ALM) 65, 178<br />
Asset management 54, 65<br />
Bancassurance 96, 97, 104<br />
Benefit reserve 63, 64, 138, 218<br />
Bonds 5, 25, 62, 70, 71<br />
Brokers 2, 47, 77, 96, 172<br />
Cash flow hedges 68, 209<br />
Combined ratio 39, 42–47, 49–51<br />
Cooperations 24, 42, 48, 53, 96, 103<br />
Corporate Operations 30, 54, 105, 121, 145<br />
Credit Life 97, 157, 162<br />
Derivatives 59, 125, 132, 172, 207–210<br />
Disposal groups 56, 57, 62, 65, 70, 137, 164, 165<br />
Diversification 52, 58<br />
E+S Rück 3, 51, 104<br />
Financial/economic crisis 36–40, 43–47, 49, 52, 61, 68, 86, 94, 96, 98<br />
Group EBIT 41, 42, 145<br />
Group structure (chart) 29<br />
Hannover Life Re 51, 52, 105, 258, 259<br />
Hannover Re Group<br />
Asia incl. China 53<br />
Germany > E+S Rück<br />
North America 50, 51<br />
United Kingdom 52<br />
HDI Direkt 3, 97, 103<br />
HDI V. a. G. 28, 31, 115<br />
IFRS 31, 86, 116–120, 127, 128<br />
Impairment test 126, 154, 188, 191<br />
Impairments 49, 60, 61, 122, 128–131, 241<br />
Industrial Lines 28, 43–45, 75, 102, 103, 144<br />
Insurance-Linked Securities (ILS) 51, 105, 159, 161<br />
Investment income (Group) 41, 42, 53, 232–235<br />
Investments 50, 54–60, 65, 69, 105, 203<br />
Life insurance 4, 39, 40, 42, 45, 46, 89, 90, 94, 97, 100, 101<br />
Life and Health Reinsurance > Hannover Life Re<br />
Loss ratio 44, 168<br />
Loss reserve 62–64, 88, 219–222<br />
Major claims 26, 38, 39, 50, 101, 168, 254, 255<br />
Market Consistent Embedded Value (MCEV) 35, 87, 91, 171, 191<br />
Motor insurance 47, 76<br />
Multi-brand strategy 2, 30, 77, 115<br />
Natural catastrophes 38, 39, 50, 89, 160<br />
Net income (Group) 4, 5, 26, 41, 42<br />
Neue Leben Group 3, 45, 104<br />
New business 38–40, 44–46, 48, 49, 52, 53, 73, 90, 100<br />
Non-Life Reinsurance 38, 42, 49–51, 65, 101, 105, 145<br />
Operating profit > Group EBIT<br />
PB Versicherungen 3, 46<br />
Protection Re 2, 30, 55, 105, 174<br />
Provision for pensions 223–226<br />
Provision for premium refunds 57, 63, 222<br />
Rating<br />
of Group companies 24, 25, 71–73, 83<br />
of investments 31, 57, 60, 93<br />
Reinsurance 28, 30, 44, 55, 60, 73, 76, 96, 160<br />
Restructuring of the Group 26, 42, 48, 54, 95, 96<br />
Retail customers 5, 41, 44, 54, 95, 100, 104<br />
Retail Germany 5, 28, 42, 45, 102–104, 145<br />
Retail International 30, 47, 102, 104, 145<br />
Retakaful 51, 53<br />
Retention 46, 48, 50, 53, 167, 170<br />
Retirement provision, individual 38, 96, 100<br />
Retirement provision, occupational 80, 83, 96<br />
Return on equity 31, 35, 68, 81, 103<br />
Risk capital 31, 33, 57, 66, 67, 84<br />
Sales channels 3, 47, 55, 77, 90, 96<br />
Securitizations 159, 160<br />
Shareholders’ equity 5, 56, 62, 67–69, 112, 137, 214<br />
Shareholdings 256–263<br />
Solvency II 40, 52, 84, 94, 99–102<br />
Structured reinsurance 105<br />
<strong>Talanx</strong> International 47<br />
Benelux (HDI-Gerling Verzekeringen/Assurances) 43<br />
Central and Eastern Europe 30, 45, 47, 50, 104<br />
Italy (HDI Assicurazioni) 48, 49<br />
Latin America (HDI Seguros) 42, 48, 53, 101, 104, 105<br />
Spain (HDI Seguros) 44<br />
Turkey (HDI Sigorta) 48, 49<br />
<strong>Talanx</strong> Service AG 18, 30, 54<br />
<strong>Talanx</strong> Systeme AG 18, 30, 54<br />
Targo Versicherungen 3, 25, 97<br />
Tax expenditure 242<br />
Taxes on income 120, 136, 142, 145, 242<br />
Technical provisions 51, 56, 62–64, 90<br />
Training 22, 75–77<br />
Underwriting <strong>policy</strong> 88, 89, 168<br />
Underwriting result 42, 44–47, 49–51<br />
Unit-linked products 42, 90, 100, 172<br />
Value-based management 34, 35, 66, 104, 215
Contact information<br />
<strong>Talanx</strong> AG<br />
Riethorst 2<br />
30659 Hannover<br />
Germany<br />
Telephone +49 511 3747-0<br />
Fax +49 511 3747-2525<br />
E-mail info@talanx.com<br />
www.talanx.com<br />
Corporate Communications<br />
Thomas von Mallinckrodt<br />
Telephone +49 511 3747-2020<br />
Fax +49 511 3747-2025<br />
E-mail thomas.mallinckrodt@talanx.com<br />
This publication went to press on 28 March 2011<br />
Published on 23 May 2011<br />
This is a translation of the original German text; the<br />
German version shall be authoritative in case of any<br />
discrepancies in the translation.<br />
Annual Report online:<br />
http://annualreport2010.talanx.com<br />
climate neutral<br />
print product<br />
CO2 emissions from this product have been<br />
offset with emission reduction certificates.<br />
Certificate Number: 543-53394-0511-1041<br />
www.climatepartner.com
Our worldwide dwide network<br />
America<br />
BM Bermuda.<br />
Hannover Life Re Bermuda, Hamilton<br />
Hannover Re Bermuda, Hamilton<br />
BR Brazil.<br />
Hannover Re (Representative Office), Rio de Janeiro<br />
HDI Seguros, São Paulo<br />
CA Canada.<br />
Hannover Re (Branch), Toronto<br />
CL Chile.<br />
HDI Seguros, Santiago<br />
CO Colombia.<br />
Hannover Re (Representative Office), Bogotá<br />
MX Mexico.<br />
Hannover Services (México), Mexico City<br />
HDI-Gerling de México Seguros, Mexico City<br />
HDI Seguros, León<br />
US USA.<br />
Hannover Life Re America, Orlando<br />
Hannover Re Services USA, Itasca/Chicago<br />
HDI-Gerling America Insurance Company, Chicago<br />
* Subject to regulatory approval<br />
Europe<br />
AT Austria.<br />
HDI-Gerling Lebensversicherung, Vienna<br />
HDI Versicherung, Vienna<br />
BE Belgium.<br />
HDI-Gerling Assurances/Verzekeringen, Brussels<br />
BG Bulgaria.<br />
HDI Zahstrahovane, Sofia<br />
CH Switzerland.<br />
HDI-Gerling Industrie (Branch), Zurich<br />
CZ Czech Republic.<br />
HDI Versicherung (Branch), Prague<br />
DE Germany.<br />
AmpegaGerling, Cologne<br />
E+S Rück, Hannover<br />
Hannover Re, Hannover<br />
HDI Direkt, Hannover<br />
HDI-Gerling, Hannover/Cologne<br />
Neue Leben, Hamburg<br />
PB Versicherungen, Hilden<br />
Protection Re, Hannover<br />
<strong>Talanx</strong>, Hannover<br />
Targo Versicherungen, Hilden<br />
ES Spain.<br />
HDI Seguros, Madrid/Barcelona<br />
HR Hannover Re, Madrid<br />
FR France.<br />
Hannover Re (Branch), Paris<br />
HDI-Gerling Industrie (Branch), Paris<br />
GR Greece.<br />
HDI-Gerling Industrie (Branch), Athens<br />
HU Hungary.<br />
HDI Versicherung (Branch), Budapest<br />
Magyar Posta Biztosító, Budapest<br />
Magyar Posta Életbiztosító, Budapest<br />
IE Ireland.<br />
Hannover Life Re (Ireland), Dublin<br />
Hannover Re (Ireland), Dublin<br />
HDI Reinsurance, Dublin
IT Italy.<br />
Hannover Re Services Italy, Milan<br />
HDI Assicurazioni, Rome<br />
HDI-Gerling Industrie (Branch), Milan<br />
LU Luxembourg.<br />
Euro International Re, Luxembourg<br />
Hannover Finance, Luxembourg<br />
<strong>Talanx</strong> Finanz, Luxembourg<br />
NL Netherlands.<br />
HDI-Gerling Verzekeringen, Rotterdam<br />
NO Norway.<br />
HDI-Gerling Industrie (Branch), Oslo<br />
PL Poland.<br />
HDI Asekuracja, Warsaw<br />
HDI-Gerling Życie, Warsaw<br />
SE Sweden.<br />
Hannover Re (Branch), Stockholm<br />
International Insurance Company of Hannover<br />
(Branch), Stockholm<br />
SK Slovak Republic.<br />
HDI Versicherung (Branch), Bratislava<br />
TR Turkey.<br />
CiV Hayat Sigorta, Istanbul<br />
HDI Sigorta, Istanbul<br />
UA Ukraine.<br />
HDI Strakhuvannya, Kiev<br />
UK United Kingdom.<br />
Hannover Life Re UK, Virginia Water<br />
Hannover Services UK, Virginia Water<br />
HDI-Gerling Industrie (Branch), London<br />
International Insurance Company of Hannover,<br />
Bracknell/London<br />
Africa<br />
ZA South Africa.<br />
Compass Insurance Company, Johannesburg<br />
Hannover Life Re Africa, Johannesburg<br />
Hannover Re Africa, Johannesburg<br />
HDI-Gerling Insurance South Africa, Johannesburg<br />
Australia<br />
AU Australia.<br />
Hannover Life Re Australasia, Sydney<br />
Hannover Rück (Branch), Sydney<br />
HDI-Gerling Australia Insurance Company, Sydney<br />
HDI-Gerling Industrie (Branch), Sydney<br />
Asia/Pacific<br />
BH Bahrain.<br />
Hannover ReTakaful, Manama<br />
Hannover Re (Branch), Manama<br />
CN China.<br />
Hannover Re (Hong Kong Branch)<br />
Hannover Re (Shanghai Branch)<br />
HDI-Gerling Industrie (Branch), Hong Kong<br />
IN India.<br />
Hannover Re Consulting Services, Mumbai<br />
Magma HDI General Insurance, Kolkata*<br />
JP Japan.<br />
Hannover Re Services Japan, Tokyo<br />
HDI-Gerling Industrie (Niederlassung), Tokyo<br />
KR Korea.<br />
Hannover Re (Branch), Seoul<br />
MY Malaysia.<br />
Hannover Re (Branch), Kuala Lumpur<br />
RU Russia.<br />
CiV Life, Moscow<br />
HDI Strakhovanie, Moscow<br />
TW Taiwan.<br />
Hannover Re (Representative Office), Taipei<br />
Valid: April 2011
<strong>Talanx</strong> AG<br />
Riethorst 2<br />
30659 Hannover<br />
Germany<br />
Telephone +49 511 3747-0<br />
Fax +49 511 3747-2525<br />
E-mail info@talanx.com<br />
www.talanx.com<br />
400-GB039