Chapter 5: t test for independent samples - Heather Lench, Ph.D.
Chapter 5: t test for independent samples - Heather Lench, Ph.D.
Chapter 5: t test for independent samples - Heather Lench, Ph.D.
Create successful ePaper yourself
Turn your PDF publications into a flip-book with our unique Google optimized e-Paper software.
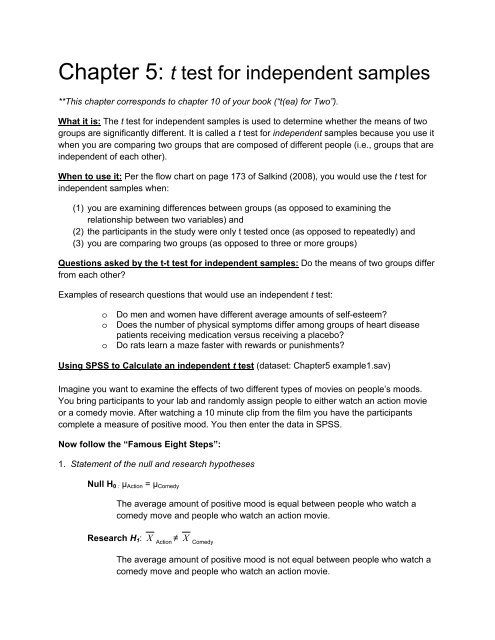
Next, you must define the groups. This tells SPSS what numbers you used to designateyour groups in the data set. To do this, click “Group(? ?)”, then click the “DefineGroups…” button. This will bring up the Define Groups pop-up window. Now, enter thenumbers you used to designate your groups in the two boxes next to “group 1” and“group 2”. Recall that <strong>for</strong> our example, we used a 1 <strong>for</strong> the action movie group and a 2<strong>for</strong> the comedy movie group. Your screen should look like the picture below:Finally, click continue, and then click OK. Now navigate to the output window to find yourresults. The output will look like this:
Group StatisticsGroup N Mean Std. Deviation Std. Error MeanPositiveMood 1.00 10 3.2600 .53375 .168792.00 10 4.3200 .96816 .30616This box gives you important summarystatistics (the group sample sizes,means, and standard deviations) that willbe helpful when you write up your results.Independent Samples T <strong>test</strong>Levene's T <strong>test</strong> <strong>for</strong>Equality of Variancest<strong>test</strong> <strong>for</strong> Equality of MeansF Sig. t dfSig. (2-tailed)95% ConfidenceInterval of theDifferenceMean Std. ErrorDifference Difference Lower UpperPositiveM Equal variancesood assumedEqual variancesnot assumed3.422 .081 -3.032 18 .007 -1.06000 .34960 -1.79449 -.32551-3.032 14.008 .009 -1.06000 .34960 -1.80978 -.31022This tells you whether thevariances between the twogroups differ. See part A of thenext section <strong>for</strong> more info.Use the results of Levene’s<strong>test</strong> to tell you which line touse here. See part B of thenext section.You can ignore thispart of the output.
Now, back to the eight steps:5. Determination of the value needed <strong>for</strong> rejection of the null hypothesisIf we were doing this example by hand, then this is the point when we would look at thetable of critical values <strong>for</strong> t (Salkind, 2008, pgs 333-334). Recall that we look up thecritical value to tell us the smallest value of t needed to reject the null hypothesis. Thecritical value is the t that corresponds to a p of .05 <strong>for</strong> that degrees of freedom. Becausep gets smaller as t gets bigger, we know that if our obtained value is bigger than thatcritical value, then the p is less than .05. However, SPSS gives us an exact p-value! Thismeans we don’t have to find the critical value on our own when we use SPSS.6. Comparison of the obtained value and the critical value is madeBecause SPSS gives us a p-value, all we have to do now is see whether that p-valuegiven to us (in the output) is greater or less than .05 (the level of risk we are willing totake). In this example, the output tells us that the p-value <strong>for</strong> our t <strong>test</strong> is .007 (which isless than .05). Put another way, this means there is only a .7% chance that we wouldobtain this pattern of results if the null hypothesis was true and there was no differencein mood between people who watch action movies and comedy movies.7/8. Making a DecisionBecause our p-value (.007) is less than .05, we reject the null hypothesis and concludethat there is a significant difference between the groups.Interpretation of the FindingsNow you report your results. Here’s an example of how these results would be reported in ajournal article:A t-<strong>test</strong> <strong>for</strong> <strong>independent</strong> <strong>samples</strong> revealed a significant difference in positive moodbetween participants that watched clips from different movie genres (t (18) = -3.03, p
Practice Problem # 1 <strong>for</strong> SPSS (answer in Appendix)A researcher wants to know whether violent video games influence aggression. She recruited10 people, 5 played Grand Theft Auto <strong>for</strong> 20 minutes (Group 1), and the other 5 played PacMan (Group 2). She then measured aggressive tendencies (higher scores represent moreaggression). Use SPSS and the following data set to determine whether there is a significantdifference in aggression between the two groups.Group Aggression1 5.31 5.61 4.51 2.31 3.02 4.22 5.22 5.32 6.42 2.8A. What is the null and research hypothesis (in both words and statistical <strong>for</strong>mat)?B. What is the level of risk associated with the null hypothesis?C. What is the appropriate <strong>test</strong> statistic and WHY?D. What is the obtained value <strong>for</strong> the t <strong>test</strong> and what is its associated p-value? Is thedifference between the two groups statistically significant?E. What do you conclude about the effect of video game type on aggression? Write up yourresults as you would <strong>for</strong> a journal article.F. Write up your results as you would <strong>for</strong> an intelligent person who doesn’t know stats.
Practice Problem #2 <strong>for</strong> Hand Calculation (answer in Appendix)A researcher is examining the effectiveness of a new pain relief drug. She recruits 30 people toparticipate in the study. 15 participants took the drug, 15 participants took a placebo. After anhour, she asked the participants how much pain they were experiencing on a 1 (no pain) to 10(extreme pain) scale. The results <strong>for</strong> the two groups are below. Answer each of the questionsbelow to determine if there is an effect of the drug on pain. Do all calculations by hand.Took Drug Took PlaceboMean 3.2 5.5Standard Deviation 1.6 2.8n 15 15A. What is the null and research hypothesis (in both words and statistical <strong>for</strong>mat)?B. What is the level of risk associated with the null hypothesis?C. What is the appropriate t <strong>test</strong> statistic and WHY?D. What is the value needed <strong>for</strong> rejection of the null hypothesis (i.e. the critical value)?E. What is the obtained value? Is it greater than the critical value?F. Can you reject the null hypothesis? What do you conclude about the effectiveness of thepain relief drug? Write up the results as you would <strong>for</strong> a journal article.G. Write up your results as you would <strong>for</strong> an intelligent person who doesn’t know stats.
Practice Problem #3 <strong>for</strong> Hand Calculation and SPSS (answer in Appendix)A researcher is interested in gender differences in cortisol production (a measure of stressreactions) under conditions of sleep deprivation. She asks participants to stay awake <strong>for</strong> 24hours then measures their cortisol (higher numbers = more cortisol). Use the data below todetermine if there is indeed a gender difference (Males = 0, Females = 1). Hand calculate theanalysis using the data below and then use SPSS to check your answer. Write up your resultsas you would <strong>for</strong> a journal article.Gender Cortisol0 5.90 6.30 4.20 5.51 41 3.81 4.51 51 4.6


