Biogeography of the Greater Portland-Vancouver ... - The Intertwine
Biogeography of the Greater Portland-Vancouver ... - The Intertwine
Biogeography of the Greater Portland-Vancouver ... - The Intertwine

You also want an ePaper? Increase the reach of your titles
YUMPU automatically turns print PDFs into web optimized ePapers that Google loves.
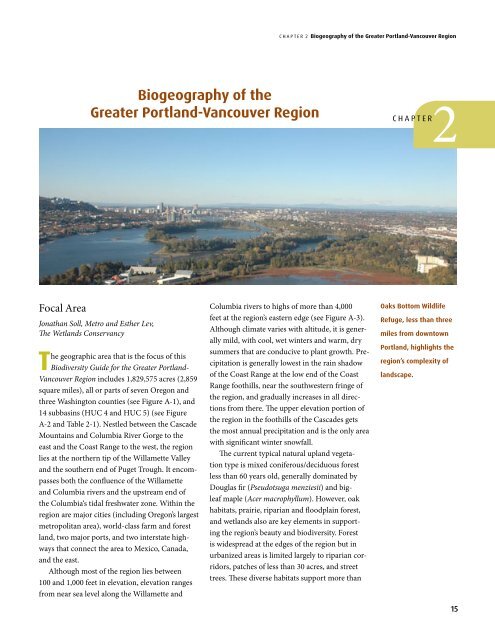
egional conservation strategybiodiversity guideChapter 2 <strong>Biogeography</strong> <strong>of</strong> <strong>the</strong> <strong>Greater</strong> <strong>Portland</strong>-<strong>Vancouver</strong> RegionTable 2-1Subbasins Used for Analysis <strong>of</strong> Vegetation ChangeNumber Basin Acres1 Abernethy Creek-Willamette River 87,1052 Cathlamet Channel-Columbia River 21,9443 Chehalem Creek-Willamette River 78,1574 Clackamas River 158,2385 Johnson Creek 60,1106 Lewis River 220,7367 Molalla River 180,8668 Salmon Creek-Frontal Columbia River 137,3419 Sandy River 67,12310 Scappoose Creek-Frontal Columbia River 125,28711 Tualatin River 452,98112 Washougal (City)-Columbia River 47,69613 Washougal River 102,12814 Willamette River-Frontal Columbia River 89,032Total 1,828,745runs roughly east through <strong>the</strong> sou<strong>the</strong>rn portion<strong>of</strong> <strong>the</strong> region and <strong>the</strong>n turns north after passingWilsonville, before joining <strong>the</strong> Columbia north<strong>of</strong> <strong>Portland</strong>. <strong>The</strong> foothills <strong>of</strong> <strong>the</strong> Cascade Rangedefine <strong>the</strong> eastern portion <strong>of</strong> <strong>the</strong> region, while<strong>the</strong> Coast Range foothills define <strong>the</strong> northwest.<strong>The</strong> Tualatin Mountains form a forested spinethrough <strong>the</strong> city <strong>of</strong> <strong>Portland</strong>, running sou<strong>the</strong>astnorthwestfrom Lake Oswego to <strong>the</strong> Coast Rangeabove Scappoose. <strong>The</strong> Chehalem Mountainsextend west and <strong>the</strong>n northwest from Sherwoodto Forest Grove. A series <strong>of</strong> geologically recentvolcanic cones collectively named <strong>the</strong> East Buttesdot sou<strong>the</strong>ast <strong>Portland</strong> and <strong>the</strong> lower Clackamaswatershed.Near <strong>the</strong> end <strong>of</strong> <strong>the</strong> last ice age (approximately12,000 years ago), <strong>the</strong> Missoula Floods carvedout <strong>the</strong> Columbia River Gorge, flooded what isnow <strong>the</strong> <strong>Portland</strong>-<strong>Vancouver</strong> area, altered rivercourses, and deposited rocks and rich sedimentsonto <strong>the</strong> valley floor.<strong>The</strong> greater metropolitan areas <strong>of</strong> <strong>Vancouver</strong>,Washington, and <strong>Portland</strong>, Oregon, are hometo <strong>the</strong> lion’s share <strong>of</strong> <strong>the</strong> region’s residents: 2.1million, as <strong>of</strong> 2010, with approximately 1 millionmore residents expected over <strong>the</strong> next 25 years.Although urban areas extend throughout <strong>the</strong>region, development is densest near its center,roughly at <strong>the</strong> confluence <strong>of</strong> <strong>the</strong> Willametteand Columbia rivers. <strong>The</strong> population generallybecomes sparser toward <strong>the</strong> perimeter. Oregoncities include Beaverton, Canby, Estacada, ForestGrove, Gresham, Hillsboro, Lake Oswego,Milwaukie, Newberg, <strong>Portland</strong>, Scappoose, St.Helens, Sherwood, Troutdale, Wilsonville, andWoodburn. Washington cities include BattleGround, Camas, La Center, Ridgefield, <strong>Vancouver</strong>,Washougal, and Woodland.As in much <strong>of</strong> <strong>the</strong> Willamette Valley, butin contrast to much <strong>of</strong> <strong>the</strong> rest <strong>of</strong> Oregon andWashington, <strong>the</strong> region’s land base has littlefederal land ownership. However, 239,352 acres(13.1 percent <strong>of</strong> <strong>the</strong> region) are in public ownership,with significant areas owned by Metro,<strong>the</strong> states <strong>of</strong> Oregon and Washington, and localjurisdictions (see Figure A-5). Federal ownershipis restricted mostly to three wildlife refuges andsome areas on <strong>the</strong> fringe <strong>of</strong> <strong>the</strong> region, such as <strong>the</strong>western end <strong>of</strong> <strong>the</strong> Columbia River Gorge ScenicArea. Some important natural areas are listedin Table 2-2. In addition, <strong>the</strong> states <strong>of</strong> Oregonand Washington manage substantial forestedareas—in <strong>the</strong> Coast Range foothills and Cascadefoothills, respectively—for income for schooltrusts and o<strong>the</strong>r public benefits.<strong>The</strong> south/southwest portion <strong>of</strong> <strong>the</strong> region ispart <strong>of</strong> <strong>the</strong> Willamette Valley proper. Like most <strong>of</strong><strong>the</strong> valley, this former prairie and savanna area isdominated by agriculture, with significant acreagein grass seed. <strong>The</strong> lower, flatter, undevelopedareas <strong>of</strong> <strong>the</strong> Tualatin Basin also are predominantlyagricultural, as are <strong>the</strong> Columbia River lowlands(excluding <strong>Vancouver</strong> and o<strong>the</strong>r urban areas) andmuch <strong>of</strong> Sauvie Island. Vineyards have extended<strong>the</strong> reach <strong>of</strong> agriculture to steeper slopes inwarmer microclimates, especially in <strong>the</strong> rainshadow <strong>of</strong> <strong>the</strong> Coast Range at <strong>the</strong> western edge <strong>of</strong><strong>the</strong> Willamette Valley. Nurseries occupy significantareas in <strong>the</strong> mid-elevation portions <strong>of</strong> ruralMultnomah, Clackamas, and Clark counties andelsewhere. Forests and forestry dominate undevelopedlandscapes elsewhere, particularly above<strong>the</strong> 1,000-foot level.With this unique geographic and culturalsetting, <strong>the</strong> region understandably hasunique and diverse flora and fauna, andcorrespondingly unique conservation challengesand opportunities.Habitat Change in <strong>the</strong> Region,1850-2010John A. Christy, Oregon Biodiversity InformationCenter, <strong>Portland</strong> State University 1Analysis <strong>of</strong> changing land cover in <strong>the</strong> greater<strong>Portland</strong>-<strong>Vancouver</strong> region since 1850 indicateswhich habitats have sustained <strong>the</strong> greatestimpacts from settlement, and by proxy, whichTable 2-2Important Natural Areas in <strong>the</strong> <strong>Greater</strong> <strong>Portland</strong>-<strong>Vancouver</strong> Region409 species <strong>of</strong> native wildlife, including at least 47fish species, 18 amphibians, 14 reptiles, 219 birds,AreaOwner/Manager66 mammals, and 59 types <strong>of</strong> butterflies. <strong>The</strong>seTualatin, Ridgefield, Steigerwald Lake, Franz Lake, U.S. Fish and Wildlife Servicenumbers exclude thousands <strong>of</strong> o<strong>the</strong>r invertebrateand Pierce Lake National Wildlife Refugesspecies (see Appendices E, G and H).<strong>The</strong> region is blessed with several major rivers—<strong>the</strong>Clackamas, Columbia, Lewis, Molalla,Sauvie Island, Multnomah Channel, and Palensky State Oregon Department <strong>of</strong> Fish and Wildlife,Wildlife Areas (Palensky Wildlife Area isMetro, and Bonneville Power AdministrationSalmon, Sandy, Tualatin, Washougal, and Willamette—andwithin Burlington Bottoms)many smaller rivers, creeks, andsloughs. Lakes are few and mostly have beenForest ParkCity <strong>of</strong> <strong>Portland</strong>altered for water supply and flood control; <strong>the</strong>yinclude Sturgeon, Smith, Bybee, <strong>Vancouver</strong>,Molalla River State Park, <strong>the</strong> Lower Sandy River Gorge, Multiple ownersLacamas and Hagg lakes; Lake Oswego; and<strong>the</strong> Lower Clackamas RiverKellogg, Merwin and Scroggins reservoirs. <strong>The</strong>sewater bodies support at least two dozen nativeWillamette NarrowsMetro and Oregon Parks andfish species, including iconic runs <strong>of</strong> salmon andRecreation Departmentsteelhead.Shillapoo Wildlife AreaWashington Department <strong>of</strong> Fish and<strong>The</strong> Willamette and Columbia rivers divideWildlife<strong>the</strong> region roughly into thirds (see Figure A-1).<strong>The</strong> Columbia runs west, dividing Oregon andWashington before heading north as it passes1 This section is abstracted from <strong>the</strong> report Changing Habitats in <strong>the</strong> <strong>Portland</strong>-<strong>Vancouver</strong> Metro Area, 1850-2010, produced by Johnthrough <strong>Portland</strong> and <strong>Vancouver</strong>. <strong>The</strong> WillametteA. Christy <strong>of</strong> <strong>the</strong> Oregon Biodiversity Information Center for <strong>the</strong> Regional Conservation Strategy and Biodiversity Guide project.Details on analytic methods are found in <strong>the</strong> full report, which is available on request from Metro’s Natural Areas Program).16 171
egional conservation strategybiodiversity guideChapter 2 <strong>Biogeography</strong> <strong>of</strong> <strong>the</strong> <strong>Greater</strong> <strong>Portland</strong>-<strong>Vancouver</strong> RegionPre-settlement mappingefforts did not map orgrossly under-representedhabitats that existedas smaller patches(non-matrix types).As a result, data foremergent wetalnd,riparian forest, shrubswamp and shrublandlikely grossly under-estimate <strong>the</strong> degree <strong>of</strong>loss since 1850.Table 2-3Acreage, Percent <strong>of</strong> Total Area, and Percent Change for 11 Land Cover Types in <strong>the</strong> Regionspecies assemblages are most at risk. In orderto provide information at both <strong>the</strong> regional andsubwatershed scales, data were analyzed for <strong>the</strong>region as a whole and for 14 separate subbasins(HUC 4 and HUC 5 and Table 2-1). <strong>The</strong> mainsources <strong>of</strong> data were General Land Office landsurvey data from <strong>the</strong> 1850s, U.S. Forest Servicemaps <strong>of</strong> forest type from <strong>the</strong> 1930s, and— for2010 vegetation—ecological system life form datacreated for <strong>the</strong> U.S. Geological Survey’s gap analysisprogram. Eleven land cover types(Table 2-3) were used to analyze changes inhabitat. (For methods, see “Data Sources andMethods,” below.)Results indicate that agriculture and urbandevelopment have caused <strong>the</strong> greatest changesin land cover in <strong>the</strong> region, and oak, prairie,and savanna habitats have sustained <strong>the</strong> greatestlosses. Changes at <strong>the</strong> subbasin level vary widely,depending mostly on <strong>the</strong> location <strong>of</strong> subbasinrelative to urban development and farmland.Extensive areas <strong>of</strong> commercial forest at <strong>the</strong> edges<strong>of</strong> <strong>the</strong> region keep overall forest cover high;1850 2010Land Cover Type Acreage % <strong>of</strong> Total Acreage % <strong>of</strong> Total % ChangeAgriculture 0 0.00 500,174 27.35 n/aEmergent wetland 7,164 0.39 21,457 1.17 199.50Mixed forest 1,205,245 65.90 778,118 42.55 -35.44Oak 198,995 10.88 49,244 2.69 -75.25Prairie and savanna 266,296 14.56 1,494 0.08 -99.44Riparian and wet forest 80,016 4.38 83,046 4.54 3.79Shrub swamp 7,721 0.42 6,562 0.36 -15.02Shrubland 428 0.02 3,265 0.18 662.94Unvegetated 669 0.04 1,573 0.09 135.14Urban 0 0.00 328,838 17.98 n/aWater 62,205 3.40 54,976 3.01 -11.62TOTAL 1,828,740 100 1,828,745 100although more urbanized subbasins have lostsubstantial forest cover.Limitations <strong>of</strong> <strong>the</strong> DataSource data are generally accurate for large-scalefeatures but commonly misclassify or underestimatethose types occurring in small areas. Consequently,less emphasis should be placed on figuresfor small-patch cover types, including emergentwetland, riparian forest, shrub swamp, shrubland,and unvegetated land. <strong>The</strong> use <strong>of</strong> small-patchcover types here is limited to analysis <strong>of</strong> whathistorical types were converted to agriculture andurban cover.Vegetation Change over <strong>the</strong> RegionHistorically, about 50 percent <strong>of</strong> <strong>the</strong> region wascovered by conifer/mixed forest and 16 percentwas burned forest, with most <strong>of</strong> <strong>the</strong> remainingarea covered in prairie or savanna (14.6 percent),and oak (10.9 percent). By 2010, nearly half <strong>of</strong> <strong>the</strong>region had been converted to ei<strong>the</strong>r agriculture(27.4 percent) or urban and suburban development(18 percent). Prairie, savanna, and burnedforest had essentially disappeared, and oak wasreduced to 2.7 percent. Combined non-oak forestcover declined about 35 percent. Changes in <strong>the</strong>six small-patch cover types (Table 2-3) in <strong>the</strong>study area are difficult to explain and to a largedegree represent differences in classification in<strong>the</strong> underlying data sets.More detailed vegetation change by subbasinis presented in each subbasin description (seeAppendix I).Vegetation Change by Subbasin<strong>The</strong> 14 subbasins vary greatly in size, historicaland current species composition, and relativeamounts <strong>of</strong> agricultural and urban development(see Table 2-3). Changes in <strong>the</strong> subbasins largelyreflect differences in <strong>the</strong> history <strong>of</strong> settlementand development. Basin-by-basin changes in <strong>the</strong>four cover types <strong>of</strong> greatest conservation concernare shown in Figure 2-2. Prairie/savanna andoak showed consistent losses across all subbasinsexcept <strong>the</strong> Sandy River (this exception probablyis attributable to misclassification in <strong>the</strong> data set),averaging 85 percent and 63 percent, respectively.Mixed forest declined an average <strong>of</strong> 35percent in all subbasins except for <strong>the</strong> Chehalem,where it showed an 81 percent gain, presumablybecause—in <strong>the</strong> absence <strong>of</strong> fire—Douglasfir and o<strong>the</strong>r upland forest trees invaded prairie/savanna and oak habitats. Water showed declinesin <strong>the</strong> Cathlamet, Salmon, Scappoose, and Willamettesubbasins but increases in <strong>the</strong> Clackamasand Molalla subbasins. Losses in <strong>the</strong> formerpresumably are due to drainage and diking foragriculture, while <strong>the</strong> gains in <strong>the</strong> Clackamasand Molalla subbasins may be attributable to <strong>the</strong>creation <strong>of</strong> gravel pits. <strong>The</strong> large increase in waterin <strong>the</strong> Lewis River subbasin is attributable to <strong>the</strong>construction <strong>of</strong> flood control reservoirs after1931. Agriculture and urban forest were excludedfrom Figure 2-1 because <strong>the</strong>y were not presentin 1850.Historically, <strong>the</strong> following basins consisted <strong>of</strong>more than 20 percent prairie or savanna habitat:Molalla River (37 percent), Chehalem Creek(29 percent), Clackamas River (27 percent), AbernethyCreek (26 percent), and Cathlamet Channel(25 percent). With <strong>the</strong> exception <strong>of</strong> <strong>the</strong> CathlametChannel subbasin, prairies in Washington weresmall and scattered but relatively numerous. Veryfew are left today in <strong>the</strong> region, and prairies are <strong>of</strong>great conservation concern. Oak habitat coveredmore than 20 percent <strong>of</strong> two subbasins—Chehalem Creek (60 percent) and Tualatin River(20 percent)—but never was extensive in <strong>the</strong>Washington portion <strong>of</strong> <strong>the</strong> region.Today, urbanized land represents more than20 percent <strong>of</strong> <strong>the</strong> following subbasins: JohnsonCreek (69 percent), Willamette (62 percent),Salmon Creek (32 percent), Abernethy Creek(26 percent), and Tualatin River (21 percent). Innine basins, agriculture represents more than 20percent <strong>of</strong> <strong>the</strong> land; <strong>the</strong>se basins are ChehalemCreek (67 percent), Molalla River (51 percent),FIGURE 2-3Relative Percent Change <strong>of</strong> Major Land Covers, 1850-2010,forfigure<strong>the</strong> Region2-1Excludes Relative Emergent Percent Wetland Change and <strong>of</strong> Shrubland Major Land Because Covers, <strong>of</strong> Differences 1850-2010, in Data Setsfor <strong>the</strong> RegionExcludes Emergent Wetland and Shrubland Because <strong>of</strong> Differences in Data Sets18 191000-100AgricultureMixed forestOakPrarie andSavannahRiparian andWet ForestShrub swampUnvegetatedUrbanWater
egional conservation strategybiodiversity guideChapter 2 <strong>Biogeography</strong> <strong>of</strong> <strong>the</strong> <strong>Greater</strong> <strong>Portland</strong>-<strong>Vancouver</strong> Regiontable 2-4Regional Biodiversity Assessments Conducted since 1990Plan or Project Geography and Project Leader and CommentsPurposeKey ParticipantsPlan or Project Geography and Purpose Project Leader and CommentsPurposeKey ParticipantsClark County Legacy Lands <strong>Greater</strong> <strong>Vancouver</strong>Clark County and a coalition <strong>of</strong> public Expert opinion-based effort; for informationWashington Conservation Washington stateOregon Department <strong>of</strong> Fish and No specific conservation opportunity areasabout projects and data contact pat-Strategy, 2006Washington Department <strong>of</strong> Fish and are identified. Scale is too large to provideProject, 1992 and onward metropolitan regionagencies, nonpr<strong>of</strong>it conservationIdentified priority species andorganizations, private landowners, rick.lee@clark.wa.gov or see http://www.Wildlife and many stakeholders <strong>the</strong> level <strong>of</strong> detail needed in <strong>the</strong> greaterIdentify and implementhabitats; conservation opportunityareas as in Oregon’sand <strong>the</strong> communityco.clark.wa.us/legacylands/index.html<strong>Portland</strong>-<strong>Vancouver</strong> region.actions to protect, conserve,and restore <strong>the</strong> system <strong>of</strong>strategy were not mappednatural areas, trails, andopen spacesNature Conservancy Pacific Oregon and Washington <strong>The</strong> Nature Conservancy with<strong>The</strong> Biodiversity Guide links to <strong>the</strong>seNorthwest Coast Ecoregional Coast Rangestakeholders and expert review by assessments, for <strong>the</strong> most part notOregon Biodiversity Project, Oregon statewideDefenders <strong>of</strong> Wildlife and many Identified about 18% <strong>of</strong> <strong>the</strong> state. <strong>The</strong>Assessment, 2006Identified focal area formany agencies and organizations overlapping with <strong>the</strong>m.1993-1999stakeholdersvalue <strong>of</strong> urban areas largely is overlookedHigh-priority conservationbiodiversity conservationat that scale.areas in OregonNatural Features Project, Addressed much <strong>of</strong> <strong>the</strong> Coalition <strong>of</strong> government agency and Expert opinion-based effort, polygonsWillamette Basin Alternative Willamette BasinPacific Northwest EcosystemDoes not include Washington portions <strong>of</strong>2006greater <strong>Portland</strong>-<strong>Vancouver</strong> nonpr<strong>of</strong>it organizations under <strong>the</strong> are not delineated, and <strong>the</strong>re are noFutures: Conservation andResearch Consortium, led by <strong>the</strong> <strong>the</strong> greater <strong>Portland</strong>-<strong>Vancouver</strong> regionregion (excluding Washington) auspices <strong>of</strong> Metro Greenspaces Policy attributes.Presented an achievableRestoration Option, 2002University <strong>of</strong> Oregon and OregonAdvisory Committeevision <strong>of</strong> conservation andState University, with many partnersrestoration opportunity areasand many stakeholders providingNature Conservancy East Oregon, Washington, and <strong>The</strong> Nature Conservancy with stakeholdersand expert review by many assessments, for <strong>the</strong> most part not<strong>The</strong> Biodiversity Guide links to <strong>the</strong>sethat would still allow forfeedbackand West Cascade Mts. EcoregionalAssessment, 2007agencies and organizationsoverlapping with <strong>the</strong>m.Nor<strong>the</strong>rn Californiaanticipated growthIdentified focal areas forMetro Title 13 Regionally Extends to one mile outside Metro staff, jurisdictions, Department Focused on a smaller watershed-specificbiodiversity conservationSignificant Fish and Wildlife <strong>the</strong> urban growth boundary <strong>of</strong> Land Conservation and Development,scale. Oregon portion <strong>of</strong> <strong>the</strong> region only.and stakeholder steeringWillamette Syn<strong>the</strong>sis Project, Willamette Basin<strong>The</strong> Nature Conservancy with stake-Provides a good starting point; however,Habitat Inventory, 2005Used to provide scientificcommittee2009holders and review by many agencies as with <strong>the</strong> state conservation strategies,context for meeting Oregon’sIntegrated previous assessmentsand updated state <strong>of</strong>and organizations<strong>the</strong> scale is too large to provide <strong>the</strong> levelland use Goal 5 requirements<strong>of</strong> detail needed in our region.Oregon conservation opportunityActions for Watershed Health: City <strong>of</strong> <strong>Portland</strong>City <strong>of</strong> <strong>Portland</strong> Bureau <strong>of</strong>City <strong>of</strong> <strong>Portland</strong> boundary.areas with better data<strong>Portland</strong> Watershed ManagementPlan, 2005Oregon and Washington Lower Columbia watersheds ODFW in Oregon and Lower Columbia Information from this plan is used in <strong>the</strong>Environmental ServicesGuides City decisions andprojects by providing aRecovery Plans for Lower <strong>of</strong> Oregon and Washington Fish Recovery Board in Washington, Biodiversity Guide.comprehensive approach toColumbia River Salmon andwith participation by many stakeholdersrestoring watershed health.Set programmatic and geographicpriorities for salmonSteelhead, 2010Framework for Integrated City <strong>of</strong> <strong>Portland</strong>City <strong>of</strong> <strong>Portland</strong> Bureau <strong>of</strong>City <strong>of</strong> <strong>Portland</strong> boundary. Includes annualand steelhead recoveryManagement <strong>of</strong> WatershedEnvironmental ServicesreportsScience to guide City decisionsthat affect watershedHealth, 2006U.S. Fish and Wildlife Service, Willamette Valley and Institute for Applied Ecology for U.S. Information from <strong>the</strong> recovery plan isRecovery Plan for <strong>the</strong> Prairie sou<strong>the</strong>rn Puget Trough Fish and Wildlife Service; many partnersprovided inputused in <strong>the</strong> Biodiversity Guide.health; ensures cross-bureauSpecies <strong>of</strong> Western Oregonconsistency; establishesIdentified actions and goalsand Southwestern Washington,2010goals, objectives, indicatorsfor prairie and savanna<strong>of</strong> success.conservation to benefit listedspeciesOregon ConservationOregon statewideOregon Department <strong>of</strong> Fish and Limited information on urban areas. <strong>The</strong>Strategy, 2006Identified priority species andWildlife and many stakeholders scale is very coarse.Watershed-based AssessmentsPlans and assessments Developed by watershed councils and Factored into <strong>the</strong> Biodiversity Guide.habitats and conservation<strong>The</strong> strategy will be updated in <strong>the</strong> nextand Plans (various). typically tied to watershed or similar groups or agenciesopportunity areasfew years. Conservation opportunity areassubwatershed boundariesin <strong>the</strong> greater <strong>Portland</strong>-<strong>Vancouver</strong> areawill be based on work <strong>of</strong> <strong>the</strong> WillametteSyn<strong>the</strong>sis project.22 23