KEY STATISTICS FOR ELLACOMBE WARD - Torbay Council
KEY STATISTICS FOR ELLACOMBE WARD - Torbay Council
KEY STATISTICS FOR ELLACOMBE WARD - Torbay Council

You also want an ePaper? Increase the reach of your titles
YUMPU automatically turns print PDFs into web optimized ePapers that Google loves.
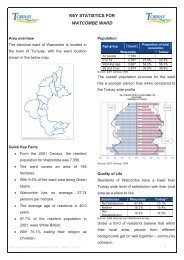
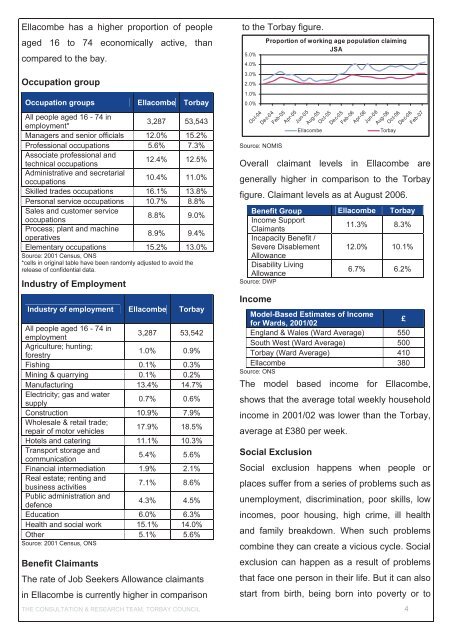
Ellacombe has a higher proportion of peopleaged 16 to 74 economically active, thancompared to the bay.Occupation groupOccupation groups Ellacombe <strong>Torbay</strong>All people aged 16 - 74 inemployment*3,287 53,543Managers and senior officials 12.0% 15.2%Professional occupations 5.6% 7.3%Associate professional andtechnical occupations12.4% 12.5%Administrative and secretarialoccupations10.4% 11.0%Skilled trades occupations 16.1% 13.8%Personal service occupations 10.7% 8.8%Sales and customer serviceoccupations8.8% 9.0%Process; plant and machineoperatives8.9% 9.4%Elementary occupations 15.2% 13.0%Source: 2001 Census, ONS*cells in original table have been randomly adjusted to avoid therelease of confidential data.Industry of EmploymentIndustry of employment Ellacombe <strong>Torbay</strong>All people aged 16 - 74 inemployment3,287 53,542Agriculture; hunting;forestry1.0% 0.9%Fishing 0.1% 0.3%Mining & quarrying 0.1% 0.2%Manufacturing 13.4% 14.7%Electricity; gas and watersupply0.7% 0.6%Construction 10.9% 7.9%Wholesale & retail trade;repair of motor vehicles17.9% 18.5%Hotels and catering 11.1% 10.3%Transport storage andcommunication5.4% 5.6%Financial intermediation 1.9% 2.1%Real estate; renting andbusiness activities7.1% 8.6%Public administration anddefence4.3% 4.5%Education 6.0% 6.3%Health and social work 15.1% 14.0%Other 5.1% 5.6%Source: 2001 Census, ONSBenefit ClaimantsThe rate of Job Seekers Allowance claimantsin Ellacombe is currently higher in comparisonto the <strong>Torbay</strong> figure.Proportion of working age population claimingJSATHE CONSULTATION & RESEARCH TEAM, TORBAY COUNCIL 45.0%4.0%3.0%2.0%1.0%0.0%Source: NOMISOct-04Dec-04Feb-05Apr-05Jun-05EllacombeAug-05Oct-05Dec-05Feb-06Apr-06Jun-06Aug-06<strong>Torbay</strong>Oct-06Dec-06Feb-07Overall claimant levels in Ellacombe aregenerally higher in comparison to the <strong>Torbay</strong>figure. Claimant levels as at August 2006.Benefit Group Ellacombe <strong>Torbay</strong>Income SupportClaimants11.3% 8.3%Incapacity Benefit /Severe Disablement 12.0% 10.1%AllowanceDisability LivingAllowance6.7% 6.2%Source: DWPIncomeModel-Based Estimates of Incomefor Wards, 2001/02£England & Wales (Ward Average) 550South West (Ward Average) 500<strong>Torbay</strong> (Ward Average) 410Ellacombe 380Source: ONSThe model based income for Ellacombe,shows that the average total weekly householdincome in 2001/02 was lower than the <strong>Torbay</strong>,average at £380 per week.Social ExclusionSocial exclusion happens when people orplaces suffer from a series of problems such asunemployment, discrimination, poor skills, lowincomes, poor housing, high crime, ill healthand family breakdown. When such problemscombine they can create a vicious cycle. Socialexclusion can happen as a result of problemsthat face one person in their life. But it can alsostart from birth, being born into poverty or to