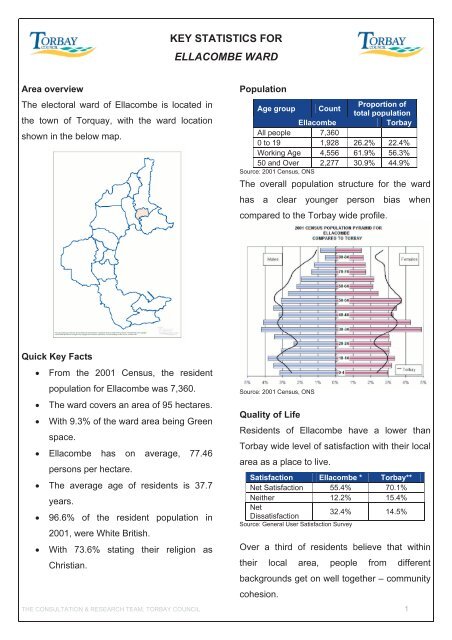
KEY STATISTICS FOR ELLACOMBE WARD - Torbay Council
KEY STATISTICS FOR ELLACOMBE WARD - Torbay Council
KEY STATISTICS FOR ELLACOMBE WARD - Torbay Council

You also want an ePaper? Increase the reach of your titles
YUMPU automatically turns print PDFs into web optimized ePapers that Google loves.
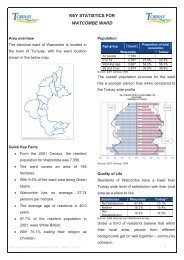
<strong>KEY</strong> <strong>STATISTICS</strong> <strong>FOR</strong><strong>ELLACOMBE</strong> <strong>WARD</strong>Area overviewThe electoral ward of Ellacombe is located inthe town of Torquay, with the ward locationshown in the below map.PopulationAge group CountProportion oftotal populationEllacombe<strong>Torbay</strong>All people 7,3600 to 19 1,928 26.2% 22.4%Working Age 4,556 61.9% 56.3%50 and Over 2,277 30.9% 44.9%Source: 2001 Census, ONSThe overall population structure for the wardhas a clear younger person bias whencompared to the <strong>Torbay</strong> wide profile.Quick Key Facts• From the 2001 Census, the residentpopulation for Ellacombe was 7,360.• The ward covers an area of 95 hectares.• With 9.3% of the ward area being Greenspace.• Ellacombe has on average, 77.46persons per hectare.• The average age of residents is 37.7years.• 96.6% of the resident population in2001, were White British.• With 73.6% stating their religion asChristian.Source: 2001 Census, ONSQuality of LifeResidents of Ellacombe have a lower than<strong>Torbay</strong> wide level of satisfaction with their localarea as a place to live.Satisfaction Ellacombe * <strong>Torbay</strong>**Net Satisfaction 55.4% 70.1%Neither 12.2% 15.4%NetDissatisfaction32.4% 14.5%Source: General User Satisfaction SurveyOver a third of residents believe that withintheir local area, people from differentbackgrounds get on well together – communitycohesion.THE CONSULTATION & RESEARCH TEAM, TORBAY COUNCIL 1
CommunityCohesionEllacombe * <strong>Torbay</strong>**Agree 37.8% 44.8%Don't know 21.6% 27.2%Disagree 21.6% 14.4%Too few people inlocal area10.8% 7.5%All the same background8.1% 6.2%* unweighted count of 74 residents** weighted response for <strong>Torbay</strong>Source: 2006 General User Satisfaction SurveyLocal Authorities have a statutory obligation toundertake a general user satisfaction surveyevery three years. These surveys allow LocalAuthorities to monitor key issues affectingresidents. Two questions from the surveyspecifically asked about quality of life and whatmakes somewhere a good place to live, andwhat most needs improving, allowingcomparison with previous survey results.Most important in making somewhere agood place to live20062003The level of crime (13.2%)Clean streets (8.8%)Wage levels & local cost of living (8.4%)Health services (8.1%)Affordable decent housing (7.7%)Low level of crime (13.2%)Clean streets (9.3%)Job prospects (8.6%)Affordable decent housing (7.9%)Education provision (7.3%)• In both surveys, a low level of crime isconsidered most important in makingsomewhere a good place to live.Most needs improving20062003Activities for teenagers (9.8%)Affordable decent housing (8.2%)The level of crime (8.2%)Job prospects (7.8%)Clean streets (7.5%)Wage levels & local cost of living (11.7%)Clean streets (10.2%)Low level of crime (9.5%)Road and pavement repairs (9.5%)Affordable decent housing (8.8%)• Activities for teenagers most need1151101051009590improving for the residents of Ellacombe.Percentages are based on responses to amultiple choice question, and are unweighted.Crime / Fire Rates<strong>Torbay</strong> is a safe place to live, and the numberof recorded offences per ‘000 residentpopulation for Ellacombe is above that of the<strong>Torbay</strong> figure. The number of recordedoffences over the period has dropped by 1.8%in Ellacombe. The following graph illustratesthe rate of recorded offences compared to<strong>Torbay</strong>.Source: Amethyst3.02.52.01.51.00.50.0Total recorded offences per '000 residentpopulation2004/2005 2005/2006Ellacombe<strong>Torbay</strong>In 2004 there were 21 primary fires attendedby the Devon Fire and Rescue service inEllacombe, or just under 3 fires attended per‘000 resident population.Source: ONSFires attended per '000 resident populationJan02-Dec02 Jan03-Dec03 Jan04-Dec04Ellacombe<strong>Torbay</strong>THE CONSULTATION & RESEARCH TEAM, TORBAY COUNCIL 2
Limiting Long Term Illness (LLTI)Limiting long-term illness covers any long-termillness; health problem or disability which limitsdaily activities or work.LLTIAllpeoplePeoplewithLLTIProportion ofpopulationwith LLTIEllacombe 7,360 1,482 20.14%<strong>Torbay</strong> 129,706 29,867 23.0%Source: 2001 Census, ONSLife ExpectancyLife expectancy at birth for person inEllacombe ward is 77.5 years, compared to the<strong>Torbay</strong> average of 79.2 years (ward average).Source: SWPHOLiving Arrangements - HouseholdsJust over a half of households are occupied bymarried or cohabiting couples, there is a higherthan bay wide proportion of divorced /separated households.LivingarrangementsEllacombe <strong>Torbay</strong>Married or Cohabiting 55.2% 60.6%Not living in a couple 25.7% 19.8%Divorced / Separated 12.3% 9.9%Widowed 6.9% 9.7%Source: 2001 Census, ONSHousing TenureOver two thirds of households are owneroccupied – either outright, mortgaged orshared ownership, just under a quarter ofhouseholds are private rented.Tenure Ellacombe <strong>Torbay</strong>All Occupiedhouseholds3,225 57,420Owner Occupied 68.1% 74.0%Housing Association 4.7% 8.2%Private Rent 24.1% 15.1%Other 3.1% 2.7%Source: 2001 Census, ONSLone ParentsLoneparents60%50%40%30%20%10%0%VacantSecond HomesDetachedEllacombeSource: 2001 Census, ONS35%30%25%20%15%10%5%0%Proportion of household spaces:lone parent with dependentchildrenEllacombe 10.2%<strong>Torbay</strong> 6.6%Source: 2001 Census, ONSHousehold SpacesOver half the properties in the ward areterraced, noticeably higher than the bayproportion.QualificationsAccomodation typeSemi-DetachedTerracedFlat/Maisonette<strong>Torbay</strong>Qualifications - Resident population aged 16 to 74M obileOverall, residents in Ellacombe have a similarlevel of qualification than the <strong>Torbay</strong> widefigure. 12.2% having NVQ level 4+ (HND,degree or higher).No NV Q level 1 NVQ level 2 NV Q level 3 NVQ level 4+ Otherqualif icationsEllacombeSource: 2001 Census, ONSEconomically Active<strong>Torbay</strong>Economically Active Ellacombe <strong>Torbay</strong>All people aged 16 to 74 5,252 90,852Economically active 3,572 68.0% 63.3%In employment 3,180 60.5% 57.0%Employees 2,644 50.3% 46.3%Self employed 536 10.2% 10.8%Unemployed 265 5.0% 4.1%Source: 2001 Census, ONSTHE CONSULTATION & RESEARCH TEAM, TORBAY COUNCIL 3
Ellacombe has a higher proportion of peopleaged 16 to 74 economically active, thancompared to the bay.Occupation groupOccupation groups Ellacombe <strong>Torbay</strong>All people aged 16 - 74 inemployment*3,287 53,543Managers and senior officials 12.0% 15.2%Professional occupations 5.6% 7.3%Associate professional andtechnical occupations12.4% 12.5%Administrative and secretarialoccupations10.4% 11.0%Skilled trades occupations 16.1% 13.8%Personal service occupations 10.7% 8.8%Sales and customer serviceoccupations8.8% 9.0%Process; plant and machineoperatives8.9% 9.4%Elementary occupations 15.2% 13.0%Source: 2001 Census, ONS*cells in original table have been randomly adjusted to avoid therelease of confidential data.Industry of EmploymentIndustry of employment Ellacombe <strong>Torbay</strong>All people aged 16 - 74 inemployment3,287 53,542Agriculture; hunting;forestry1.0% 0.9%Fishing 0.1% 0.3%Mining & quarrying 0.1% 0.2%Manufacturing 13.4% 14.7%Electricity; gas and watersupply0.7% 0.6%Construction 10.9% 7.9%Wholesale & retail trade;repair of motor vehicles17.9% 18.5%Hotels and catering 11.1% 10.3%Transport storage andcommunication5.4% 5.6%Financial intermediation 1.9% 2.1%Real estate; renting andbusiness activities7.1% 8.6%Public administration anddefence4.3% 4.5%Education 6.0% 6.3%Health and social work 15.1% 14.0%Other 5.1% 5.6%Source: 2001 Census, ONSBenefit ClaimantsThe rate of Job Seekers Allowance claimantsin Ellacombe is currently higher in comparisonto the <strong>Torbay</strong> figure.Proportion of working age population claimingJSATHE CONSULTATION & RESEARCH TEAM, TORBAY COUNCIL 45.0%4.0%3.0%2.0%1.0%0.0%Source: NOMISOct-04Dec-04Feb-05Apr-05Jun-05EllacombeAug-05Oct-05Dec-05Feb-06Apr-06Jun-06Aug-06<strong>Torbay</strong>Oct-06Dec-06Feb-07Overall claimant levels in Ellacombe aregenerally higher in comparison to the <strong>Torbay</strong>figure. Claimant levels as at August 2006.Benefit Group Ellacombe <strong>Torbay</strong>Income SupportClaimants11.3% 8.3%Incapacity Benefit /Severe Disablement 12.0% 10.1%AllowanceDisability LivingAllowance6.7% 6.2%Source: DWPIncomeModel-Based Estimates of Incomefor Wards, 2001/02£England & Wales (Ward Average) 550South West (Ward Average) 500<strong>Torbay</strong> (Ward Average) 410Ellacombe 380Source: ONSThe model based income for Ellacombe,shows that the average total weekly householdincome in 2001/02 was lower than the <strong>Torbay</strong>,average at £380 per week.Social ExclusionSocial exclusion happens when people orplaces suffer from a series of problems such asunemployment, discrimination, poor skills, lowincomes, poor housing, high crime, ill healthand family breakdown. When such problemscombine they can create a vicious cycle. Socialexclusion can happen as a result of problemsthat face one person in their life. But it can alsostart from birth, being born into poverty or to
parents with low skills still has a majorinfluence on future life chances. The EnglishIndices of Deprivation 2004 (revised) go someway to identifying hotspots of deprivation. Theoverall ‘Index of Multiple Deprivation’ is amodel based on 7 domains covering theaforementioned social exclusion topics.What was the Office of the Deputy PrimeMinister, now the Department for Communitiesand Local Government published in 2004 a setof deprivation indices that were modelled oncomparative social and economic datasets.The index of multiple deprivation is used widelyto compare varying areas with associatedlevels of deprivation / social exclusion. Withinthe index, <strong>Torbay</strong> has areas of severedeprivation within the top 10% most deprived inEngland. The below map illustrates the areas(in red) in the top 10% most deprived inEngland.Index of Multiple DeprivationFrom the 2004 Indices of multiple deprivationthere are a series of sub-domains that whenaggregated together give the actual 7 domainsthat in turn lead to the Index of MultipleDeprivation.The following maps illustrate the ranking withinEngland for areas in <strong>Torbay</strong> for the followingindicators:• Income deprivation affecting older people.• Road distance to a Post Office.• Road distance to a super market orconvenience store.• Road distance to a GP premises.• Road distance to a primary school.Further information of the English Indices ofDeprivation 2004 can be obtained using thecontact details at the end of this paper.Income deprivation affecting older peopleTHE CONSULTATION & RESEARCH TEAM, TORBAY COUNCIL 5
Road distance to a Post OfficeRoad distance to a GP premisesRoad distance to a super market orconvenience storeRoad distance to a primary schoolTHE CONSULTATION & RESEARCH TEAM, TORBAY COUNCIL 6
<strong>ELLACOMBE</strong> <strong>WARD</strong>Below the electoral geography of a ward, there existsfurther statistical geography. The most recognisedand well used geographies are Super Output Areas(SOAs). SOAs are based in data from the 2001census and have, on average, 650 households within.The SOA boundaries do NOT reflect neighbourhoods,they are purely for statistical comparison, and areused as a mechanism for publishing data to arelatively small area.The map to the right shows the SOA structure forEllacombe, whilst the below table details the nationalranking for the specific SOA in the Index of MultipleDeprivation and the 7 associated domains plus twofurther sub-domains.The English Indices of Deprivation 2004 (revised)Area numberfor ward mapIndex ofMultipleDeprivationIncomeDomainEmploymentDomainHealth andDisabilitydomainEducation,Skills andTrainingDomainBarriers toHousingDomainCrime andDisorderDomainLivingEnvironmentDomainIncomedeprivationaffectingchildrenIncomedeprivationaffectingolder peopleRANK RANK RANK RANK RANK RANK RANK RANK RANK RANK1 6,796 6,422 7,588 10,769 8,878 20,304 7,670 975 6,316 6,1042 13,196 10,029 12,871 17,412 11,424 16,325 21,631 8,203 11,701 8,0363 7,933 8,987 6,358 12,435 10,729 18,598 12,451 1,227 12,624 7,3654 2,460 2,860 1,402 5,639 5,434 15,355 4,490 1,542 3,060 3,4495 8,298 7,503 6,312 12,288 12,947 22,993 9,374 2,833 9,585 6,432Source: Office of the Deputy Prime Minister, The English Indices of Deprivation 2004 (revised)Areas shaded in grey are SOAs ranked within the top 10% most deprived in EnglandTHE CONSULTATION & RESEARCH TEAM, TORBAY COUNCIL 7
For further information please contactThe Consultation and Research Team<strong>Torbay</strong> <strong>Council</strong>Tel: (01803) 20 8829 / 8827E-mail: statistics@torbay.gov.ukDLH/03/07THE CONSULTATION & RESEARCH TEAM, TORBAY COUNCIL 8