Active Calculus - Gvsu - Grand Valley State University
Active Calculus - Gvsu - Grand Valley State University
Active Calculus - Gvsu - Grand Valley State University
- No tags were found...

You also want an ePaper? Increase the reach of your titles
YUMPU automatically turns print PDFs into web optimized ePapers that Google loves.
<strong>Active</strong> <strong>Calculus</strong>Matt Boelkins, Lead Author and EditorDepartment of Mathematics<strong>Grand</strong> <strong>Valley</strong> <strong>State</strong> <strong>University</strong>boelkinm@gvsu.eduhttp://faculty.gvsu.edu/boelkinm/David Austin, Contributing Authorhttp://merganser.math.gvsu.edu/david/Steven Schlicker, Contributing Authorhttp://faculty.gvsu.edu/schlicks/December 31, 2012
ivCONTENTS3.4 Applied Optimization . . . . . . . . . . . . . . . . . . . . . . . . . . . . . . . . . . . . 783.5 Related Rates . . . . . . . . . . . . . . . . . . . . . . . . . . . . . . . . . . . . . . . . . 834 The Definite Integral 894.1 Determining distance traveled from velocity . . . . . . . . . . . . . . . . . . . . . . . 894.2 Riemann Sums . . . . . . . . . . . . . . . . . . . . . . . . . . . . . . . . . . . . . . . . . 944.3 The Definite Integral . . . . . . . . . . . . . . . . . . . . . . . . . . . . . . . . . . . . . 994.4 The Fundamental Theorem of <strong>Calculus</strong> . . . . . . . . . . . . . . . . . . . . . . . . . . 104
Chapter 1Understanding the Derivative1.1 How do we measure velocity?Preview Activity 1.1. Suppose that the height s of a ball (in feet) at time t (in seconds) is given bythe formula s(t) = 64 − 16(t − 1) 2 .(a) Construct an accurate graph of y = s(t) on the time interval 0 ≤ t ≤ 3. Label at least sixdistinct points on the graph, including the three points that correspond to when the ballwas released, when the ball reaches its highest point, and when the ball lands.(b) In everyday language, describe the behavior of the ball on the time interval 0 < t < 1 andon time interval 1 < t < 3. What occurs at the instant t = 1?(c) Consider the expressionAV [0.5,1] =s(1) − s(0.5).1 − 0.5Compute the value of AV [0.5,1] . What does this value measure geometrically? What doesthis value measure physically? In particular, what are the units on AV [0.5,1] ?⊲⊳1
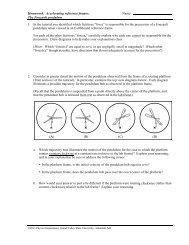
2 1.1. HOW DO WE MEASURE VELOCITY?Activity 1.1.The following questions concern the position function given by s(t) = 64 − 16(t − 1) 2 , which isthe same function considered in Preview Activity 1.1.(a) Compute the average velocity of the ball on each of the following time intervals: [0.4, 0.8],[0.7, 0.8], [0.79, 0.8], [0.799, 0.8], [0.8, 1.2], [0.8, 0.9], [0.8, 0.81], [0.8, 0.801]. Include unitsfor each value.(b) On the provided graph in Figure 1.1, sketch the line that passes through the pointsA = (0.4, s(0.4)) and B = (0.8, s(0.8)). What is the meaning of the slope of this line? Inlight of this meaning, what is a geometric way to interpret each of the values computedin the preceding question?(c) Use a graphing utility to plot the graph of s(t) = 64−16(t−1) 2 on an interval containingthe value t = 0.8. Then, zoom in repeatedly on the point (0.8, s(0.8)). What do youobserve about how the graph appears as you view it more and more closely?(d) What do you conjecture is the velocity of the ball at the instant t = 0.8? Why?64feetBs56A48sec0.4 0.8 1.2Figure 1.1: A partial plot of s(t) = 64 − 16(t − 1) 2 .⊳
1.1. HOW DO WE MEASURE VELOCITY? 3Activity 1.2.Each of the following questions concern s(t) = 64 − 16(t − 1) 2 , the position function fromPreview Activity 1.1.(a) Compute the average velocity of the ball on the time interval [1.5, 2]. What is differentbetween this value and the average velocity on the interval [0, 0.5]?(b) Use appropriate computing technology to estimate the instantaneous velocity of theball at t = 1.5. Likewise, estimate the instantaneous velocity of the ball at t = 2. Whichvalue is greater?(c) How is the sign of the instantaneous velocity of the ball related to its behavior at agiven point in time? That is, what does positive instantaneous velocity tell you the ballis doing? Negative instantaneous velocity?(d) Without doing any computations, what do you expect to be the instantaneous velocityof the ball at t = 1? Why?⊳
4 1.1. HOW DO WE MEASURE VELOCITY?Activity 1.3.For the function given by s(t) = 64 − 16(t − 1) 2 from Preview Activity 1.1, find the mostsimplified expression you can for the average velocity of the ball on the interval [2, 2 + h].Use your result to compute the average velocity on [1.5, 2] and to estimate the instantaneousvelocity at t = 2. Finally, compare your earlier work in Activity 1.1.⊳
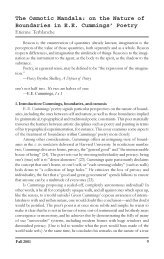
1.2. THE NOTION OF LIMIT 51.2 The notion of limitPreview Activity 1.2. Suppose that g is the function given by the graph below. Use the graph toanswer each of the following questions.(a) Determine the values g(−2), g(−1), g(0), g(1), and g(2), if defined. If the function value isnot defined, explain what feature of the graph tells you this.(b) For each of the values a = −1, a = 0, and a = 2, complete the following sentence: “As xgets closer and closer (but not equal) to a, g(x) gets as close as we want to .”(c) What happens as x gets closer and closer (but not equal) to a = 1? Does the function g(x)get as close as we would like to a single value?g321-2 -1 1 2 3-1Figure 1.2: Graph of y = g(x) for Preview Activity 1.2.⊲⊳
6 1.2. THE NOTION OF LIMITActivity 1.4.Estimate the value of each of the following limits by constructing appropriate tables of values.Then determine the exact value of the limit by using algebra to simplify the function. Finally,plot each function on an appropriate interval to check your result visually.(a) limx→1x 2 − 1x − 1(b) limx→0(2 + x) 3 − 8x(c) limx→0√ x + 1 − 1x⊳
1.2. THE NOTION OF LIMIT 7Activity 1.5.Consider a moving object whose position function is given by s(t) = t 2 , where s is measuredin meters and t is measured in minutes.(a) Determine a simplified expression for the average velocity of the object on the interval[3, 3 + h].(b) Determine the average velocity of the object on the interval [3, 3.2]. Include units onyour answer.(c) Determine the instantaneous velocity of the object when t = 3. Include units on youranswer.⊳
8 1.2. THE NOTION OF LIMITActivity 1.6.For the moving object whose position s at time t is given by the graph below, answer each ofthe following questions. Assume that s is measured in feet and t is measured in seconds.5s311 3 5tFigure 1.3: Plot of the position function y = s(t) in Activity 1.6.(a) Use the graph to estimate the average velocity of the object on each of the followingintervals: [0.5, 1], [1.5, 2.5], [0, 5]. Draw each line whose slope represents the averagevelocity you seek.(b) How could you use average velocities and slopes of lines to estimate the instantaneousvelocity of the object at a fixed time?(c) Use the graph to estimate the instantaneous velocity of the object when t = 2. Shouldthis instantaneous velocity at t = 2 be greater or less than the average velocity on[1.5, 2.5] that you computed in (a)? Why?⊳
1.3. THE DERIVATIVE OF A FUNCTION AT A POINT 91.3 The derivative of a function at a pointPreview Activity 1.3. Suppose that f is the function given by the graph below and that a and a+hare the input values as labeled on the x-axis. Use the graph in Figure 1.4 to answer the followingquestions.yfxaa + hFigure 1.4: Plot of y = f(x) for Preview Activity 1.3.(a) Locate and label the points (a, f(a)) and (a + h, f(a + h)) on the graph.(b) Construct a right triangle whose hypotenuse is the line segment from (a, f(a)) to(a + h, f(a + h)). What are the lengths of the respective legs of this triangle?(c) What is the slope of the line that connects the points (a, f(a)) and (a + h, f(a + h))?(d) Write a meaningful sentence that explains how the average rate of change of the functionon a given interval and the slope of a related line are connected.⊲⊳
10 1.3. THE DERIVATIVE OF A FUNCTION AT A POINTActivity 1.7.Consider the function f whose formula is f(x) = 3 − 2x.(a) What familiar type of function is f? What can you say about the slope of f at everyvalue of x?(b) Compute the average rate of change of f on the intervals [1, 4], [3, 7], and [5, 5 + h];simplify each result as much as possible. What do you notice about these quantities?(c) Use the limit definition of the derivative to compute the exact instantaneous rate ofchange of f with respect to x at the value a = 1. That is, compute f ′ (1) using the limitdefinition. Show your work. Is your result surprising?(d) Without doing any additional computations, what are the values of f ′ (2), f ′ (π), andf ′ (− √ 2)? Why?⊳
1.3. THE DERIVATIVE OF A FUNCTION AT A POINT 11Activity 1.8.A water balloon is tossed vertically in the air from a window. The balloon’s height in feet attime t in seconds after being launched is given by s(t) = −16t 2 + 16t + 32. Use this function torespond to each of the following questions.(a) Sketch an accurate, labeled graph of s on the axes provided in Figure 1.5. You shouldbe able to do this without using computing technology.32y161 2tFigure 1.5: Axes for plotting y = s(t) in Activity 1.8.(b) Compute the average rate of change of s on the time interval [1, 2]. Include units onyour answer and write one sentence to explain the meaning of the value you found.(c) Use the limit definition to compute the instantaneous rate of change of s with respectto time, t, at the instant a = 1. Show your work using proper notation, include units onyour answer, and write one sentence to explain the meaning of the value you found.(d) On your graph in (a), sketch two lines: one whose slope represents the average rate ofchange of s on [1, 2], the other whose slope represents the instantaneous rate of changeof s at the instant a = 1. Label each line clearly.(e) For what values of a do you expect s ′ (a) to be positive? Why? Answer the same questionswhen “positive” is replaced by “negative” and “zero.”⊳
12 1.3. THE DERIVATIVE OF A FUNCTION AT A POINTActivity 1.9.A rapidly growing city in Arizona has its population P at time t, where t is the number ofdecades after the year 2010, modeled by the formula P (t) = 25000e t/5 . Use this function torespond to the following questions.(a) Sketch an accurate graph of P for t = 0 to t = 5 on the axes provided in Figure 1.6.Label the scale on the axes carefully.ytFigure 1.6: Axes for plotting y = P (t) in Activity 1.9.(b) Compute the average rate of change of P between 2030 and 2050. Include units on youranswer and write one sentence to explain the meaning (in everyday language) of thevalue you found.(c) Use the limit definition to write an expression for the instantaneous rate of change of Pwith respect to time, t, at the instant a = 2. Explain why this limit is difficult to evaluateexactly.(d) Estimate the limit in (c) for the instantaneous rate of change of P at the instant a = 2by using several small h values. Once you have determined an accurate estimate ofP ′ (2), include units on your answer, and write one sentence (using everyday language)to explain the meaning of the value you found.(e) On your graph above, sketch two lines: one whose slope represents the average rate ofchange of P on [2, 4], the other whose slope represents the instantaneous rate of changeof P at the instant a = 2.(f) In a carefully-worded sentence, describe the behavior of P ′ (a) as a increases in value.What does this reflect about the behavior of the given function P ?⊳
1.4. THE DERIVATIVE FUNCTION 131.4 The derivative functionPreview Activity 1.4. Consider the function f(x) = 4x − x 2 .(a) Use the limit definition to compute the following derivative values: f ′ (0), f ′ (1), f ′ (2), andf ′ (3).(b) Observe that the work to find f ′ (a) is the same, regardless of the value of a. Based on yourwork in (a), what do you conjecture is the value of f ′ (4)? How about f ′ (5)? (Note: youshould not use the limit definition of the derivative to find either value.)(c) Conjecture a formula for f ′ (a) that depends only on the value a. That is, in the same waythat we have a formula for f(x) (recall f(x) = 4x − x 2 ), see if you can use your work aboveto guess a formula for f ′ (a) in terms of a.⊲⊳
14 1.4. THE DERIVATIVE FUNCTIONActivity 1.10.For each given graph of y = f(x), sketch an approximate graph of its derivative function,y = f ′ (x), on the axes immediately below. The scale of the grid for the graph of f is 1 × 1;assume the horizontal scale of the grid for the graph of f ′ is identical to that for f. If necessary,adjust and label the vertical scale on the axes for the graph of f ′ .fgxxf ′g ′xxpqxxp ′q ′xx
1.4. THE DERIVATIVE FUNCTION 15rsxxr ′s ′xxwzxxw ′z ′xxWrite several sentences that describe your overall process for sketching the graph of the derivativefunction, given the graph the original function. What are the values of the derivative functionthat you tend to identify first? What do you do thereafter? How do key traits of the graphof the derivative function exemplify properties of the graph of the original function?⊳
16 1.4. THE DERIVATIVE FUNCTIONActivity 1.11.For each of the listed functions, determine a formula for the derivative function. For the firsttwo, determine the formula for the derivative by thinking about the nature of the given functionand its slope at various points; do not use the limit definition. For the latter four, use thelimit definition. Pay careful attention to the function names and independent variables. Itis important to be comfortable with using letters other than f and x. For example, given afunction p(z), we call its derivative p ′ (z).(a) f(x) = 1(b) g(t) = t(c) p(z) = z 2(d) q(s) = s 3(e) F (t) = 1 t(f) G(y) = √ y⊳
1.5. INTERPRETING THE DERIVATIVE AND ITS UNITS 171.5 Interpreting the derivative and its unitsPreview Activity 1.5. One of the longest stretches of straight (and flat) road in North Americacan be found on the Great Plains in the state of North Dakota on state highway 46, which lies justsouth of the interstate highway I-94 and runs through the town of Gackle. A car leaves town (attime t = 0) and heads east on highway 46; its position in miles from Gackle at time t in minutes isgiven by the graph of the function in Figure 1.7. Three important points are labeled on the graph;where the curve looks linear, assume that it is indeed a straight line.100s(104, 106.8)806040(57, 63.8)(68, 63.8)2020 40 60 80 100tFigure 1.7: The graph of y = s(t), the position of the car along highway 46, which tells its distancein miles from Gackle, ND, at time t in minutes.(a) In everyday language, describe the behavior of the car over the provided time interval. Inparticular, discuss what is happening on the time intervals [57, 68] and [68, 104].(b) Find the slope of the line between the points (57, 63.8) and (104, 106.8). What are the unitson this slope? What does the slope represent?(c) Find the average rate of change of the car’s position on the interval [68, 104]. Include unitson your answer.(d) Estimate the instantaneous rate of change of the car’s position at the moment t = 80. Writea sentence to explain your reasoning and the meaning of this value.⊲⊳
18 1.5. INTERPRETING THE DERIVATIVE AND ITS UNITSActivity 1.12.A potato is placed in an oven, and the potato’s temperature F (in degrees Fahrenheit) at variouspoints in time is taken and recorded in the following table. Time t is measured in minutes.tF (t)0 7015 180.530 25145 29660 324.575 342.890 354.5(a) Use a central difference to estimate the instantaneous rate of change of the temperatureof the potato at t = 30. Include units on your answer.(b) Use a central difference to estimate the instantaneous rate of change of the temperatureof the potato at t = 60. Include units on your answer.(c) Without doing any calculation, which do you expect to be greater: F ′ (75) or F ′ (90)?Why?(d) Suppose it is given that F (64) = 330.28 and F ′ (64) = 1.341. What are the units on thesetwo quantities? What do you expect the temperature of the potato to be when t = 65?when t = 66? Why?(e) Write a couple of careful sentences that describe the behavior of the temperature of thepotato on the time interval [0, 90], as well as the behavior of the instantaneous rate ofchange of the temperature of the potato on the same time interval.⊳
1.5. INTERPRETING THE DERIVATIVE AND ITS UNITS 19Activity 1.13.A company manufactures rope, and the total cost of producing r feet of rope is C(r) dollars.(a) What does it mean to say that C(2000) = 800?(b) What are the units of C ′ (r)?(c) Suppose that C(2000) = 800 and C ′ (2000) = 0.35. Estimate C(2100), and justify yourestimate by writing at least one sentence that explains your thinking.(d) Which of the following statements do you think is true, and why?• C ′ (2000) < C ′ (3000)• C ′ (2000) = C ′ (3000)• C ′ (2000) > C ′ (3000)(e) Suppose someone claims that C ′ (5000) = −0.1. What would the practical meaning ofthis derivative value tell you about the approximate cost of the next foot of rope? Is thispossible? Why or why not?⊳
20 1.6. THE SECOND DERIVATIVEActivity 1.14.Researchers at a major car company have found a function that relates gasoline consumption tospeed for a particular model of car. In particular, they have determined that the consumptionC, in liters per kilometer, at a given speed s, is given by a function C = f(s), where s is thecar’s speed in kilometers per hour.(a) Data provided by the car company tells us that f(80) = 0.015, f(90) = 0.02, andf(100) = 0.027. Use this information to estimate the instantaneous rate of change offuel consumption with respect to speed at s = 90. Be as accurate as possible, use propernotation, and include units on your answer.(b) By writing a complete sentence, interpret the meaning (in the context of fuel consumption)of “f(80) = 0.015.”(c) Write at least one complete sentence that interprets the meaning of the value of f ′ (90)that you estimated in (a).⊳1.6 The second derivativePreview Activity 1.6. The position of a car driving along a straight road at time t in minutes isgiven by the function y = s(t) that is pictured in Figure 1.8. The car’s position function has unitsmeasured in thousands of feet. For instance, the point (2, 4) on the graph indicates that after 2minutes, the car has traveled 4000 feet.14ys10622 6 10tFigure 1.8: The graph of y = s(t), the position of the car (measured in thousands of feet from itsstarting location) at time t in minutes.
1.6. THE SECOND DERIVATIVE 21(a) In everyday language, describe the behavior of the car over the provided time interval.In particular, you should carefully discuss what is happening on each of the time intervals[0, 1], [1, 2], [2, 3], [3, 4], and [4, 5], plus provide commentary overall on what the car is doingon the interval [0, 12].(b) On the lefthand axes provided in Figure 1.9, sketch a careful, accurate graph of y = s ′ (t).(c) What is the meaning of the function y = s ′ (t) in the context of the given problem? Whatcan we say about the car’s behavior when s ′ (t) is positive? when s ′ (t) is zero? when s ′ (t)is negative?(d) Rename the function you graphed in (b) to be called y = v(t). Describe the behavior of vin words, using phrases like “v is increasing on the interval . . .” and “v is constant on theinterval . . ..”(e) Sketch a graph of the function y = v ′ (t) on the righthand axes provide in Figure 1.8. Writeat least one sentence to explain how the behavior of v ′ (t) is connected to the graph ofy = v(t).yy2 6 10t2 6 10tFigure 1.9: Axes for plotting y = v(t) = s ′ (t) and y = v ′ (t).⊲⊳
22 1.6. THE SECOND DERIVATIVEActivity 1.15.The position of a car driving along a straight road at time t in minutes is given by the functiony = s(t) that is pictured in Figure 1.10. The car’s position function has units measured inthousands of feet. Remember that you worked with this function and sketched graphs of y =v(t) = s ′ (t) and y = v ′ (t) in Preview Activity 1.6.14ys10622 6 10tFigure 1.10: The graph of y = s(t), the position of the car (measured in thousands of feet from itsstarting location) at time t in minutes.(a) On what intervals is the position function y = s(t) increasing? decreasing? Why?(b) On which intervals is the velocity function y = v(t) = s ′ (t) increasing? decreasing?neither? Why?(c) Acceleration is defined to be the instantaneous rate of change of velocity, as the accelerationof an object measures the rate at which the velocity of the object is changing.Say that the car’s acceleration function is named a(t). How is a(t) computed from v(t)?How is a(t) computed from s(t)? Explain.(d) What can you say about s ′′ whenever s ′ is increasing? Why?(e) Using only the words increasing, decreasing, constant, concave up, concave down, and linear,complete the following sentences. For the position function s with velocity v andacceleration a,• on an interval where v is positive, s is .• on an interval where v is negative, s is .• on an interval where v is zero, s is .• on an interval where a is positive, v is .• on an interval where a is negative, v is .• on an interval where a is zero, v is .
1.6. THE SECOND DERIVATIVE 23• on an interval where a is positive, s is .• on an interval where a is negative, s is .• on an interval where a is zero, s is .⊳
24 1.6. THE SECOND DERIVATIVEActivity 1.16.This activity builds on our experience and understanding of how to sketch the graph of f ′ giventhe graph of f. Below, given the graph of a function f, sketch f ′ on the first axes below, andthen sketch f ′′ on the second set of axes. In addition, for each, write several careful sentencesin the spirit of those in Activity 1.15 that connect the behaviors of f, f ′ , and f ′′ . For instance,write something such asf ′ is on the interval , which is connected to the fact thatf is on the same interval , and f ′′ ison the interval as wellbut of course with the blanks filled in. Throughout, view the scale of the grid for the graph of fas being 1 × 1, and assume the horizontal scale of the grid for the graph of f ′ is identical to thatfor f. If you need to adjust the vertical scale on the axes for the graph of f ′ or f ′′ , you shouldlabel that accordingly.⊳
1.6. THE SECOND DERIVATIVE 25ffxxf ′f ′xxf ′′f ′′xxFigure 1.11: Two given functions f, with axes provided for plotting f ′ and f ′′ below.Activity 1.17.A potato is placed in an oven, and the potato’s temperature F (in degrees Fahrenheit) at variouspoints in time is taken and recorded in the following table. Time t is measured in minutes.In Activity 1.12, we computed approximations to F ′ (30) and F ′ (60) using central differences.Those values and more are provided in the second table below, along with several others computedin the same way.
26 1.6. THE SECOND DERIVATIVEtF (t)0 7015 180.530 25145 29660 324.575 342.890 354.5tF ′ (t)0 NA15 6.0330 3.8545 2.4560 1.5675 1.0090 NA(a) What are the units on the values of F ′ (t)?(b) Use a central difference to estimate the value of F ′′ (30).(c) What is the meaning of the value of F ′′ (30) that you have computed in (c) in terms ofthe potato’s temperature? Write several careful sentences that discuss, with appropriateunits, the values of F (30), F ′ (30), and F ′′ (30), and explain the overall behavior of thepotato’s temperature at this point in time.(d) Overall, is the potato’s temperature increasing at an increasing rate, increasing at a constantrate, or increasing at a decreasing rate? Why?⊳
1.7. LIMITS, CONTINUITY, AND DIFFERENTIABILITY 271.7 Limits, Continuity, and DifferentiabilityPreview Activity 1.7. A function f defined on −4 < x < 4 is given by the graph in Figure 1.12.Use the graph to answer each of the following questions. Note: to the right of x = 2, the graph off is exhibiting infinite oscillatory behavior similar to the function sin( π x) that we encountered inFigure ?? in Example ??.f321-3 -2 -1-11 2 3-2-3Figure 1.12: The graph of y = f(x).(a) For each of the values a = −3, −2, −1, 0, 1, 2, 3, determine whether or not lim f(x) exists.x→aIf the function has a limit L at a given point, state the value of the limit using the notationlim f(x) = L. If the function does not have a limit at a given point, write a sentence tox→aexplain why.(b) For each of the values of a from part (a) where f has a limit, determine the value of f(a)at each such point. In addition, for each such a value, does f(a) have the same value aslimx→a f(x)?(c) For each of the values a = −3, −2, −1, 0, 1, 2, 3, determine whether or not f ′ (a) exists. Inparticular, based on the given graph, ask yourself if it is reasonable to say that f has atangent line at (a, f(a)) for each of the given a-values. If so, visually estimate the slope ofthe tangent line to find the value of f ′ (a).⊲⊳
28 1.7. LIMITS, CONTINUITY, AND DIFFERENTIABILITYActivity 1.18.Consider a function that is piecewise-defined according to the formula⎪⎨f(x) =⎧3(x + 2) + 2 for −3 < x < −22323(x + 2) + 1 for −2 ≤ x < −1(x + 2) + 1 for −1 < x < 12 for x = 1⎪⎩4 − x for x > 1Use the given formula to answer the following questions.321-2 -1 1 2-1Figure 1.13: Axes for plotting the function y = f(x) in Activity 1.18.(a) For each of the values a = −2, −1, 0, 1, 2, compute f(a).(b) For each of the values a = −2, −1, 0, 1, 2, determine lim f(x) and lim f(x).x→a− x→a +(c) For each of the values a = −2, −1, 0, 1, 2, determine limx→af(x). If the limit fails to exist,explain why by discussing the left- and right-hand limits at the relevant a-value.(d) For which values of a is the following statement true?lim f(x) ≠ f(a)x→a(e) On the axes provided in Figure 1.13, sketch an accurate, labeled graph of y = f(x). Besure to carefully use open circles (◦) and filled circles (•) to represent key points on thegraph, as dictated by the piecewise formula.⊳
1.7. LIMITS, CONTINUITY, AND DIFFERENTIABILITY 29Activity 1.19.This activity builds on your work in Preview Activity 1.7, using the same function f as givenby the graph that is repeated in Figure 1.14f321-3 -2 -1-11 2 3-2-3Figure 1.14: The graph of y = f(x) for Activity 1.19.(a) At which values of a does lim x→a f(x) not exist?(b) At which values of a is f(a) not defined?(c) At which values of a does f have a limit, but lim x→a f(x) ≠ f(a)?(d) <strong>State</strong> all values of a for which f is not continuous at x = a.(e) Which condition is stronger, and hence implies the other: f has a limit at x = a orf is continuous at x = a? Explain, and hence complete the following sentence: “If fat x = a, then fat x = a,” where youcomplete the blanks with has a limit and is continuous, using each phrase once.⊳
30 1.7. LIMITS, CONTINUITY, AND DIFFERENTIABILITYActivity 1.20.In this activity, we explore two different functions and classify the points at which each is notdifferentiable. Let g be the function given by the rule g(x) = |x|, and let f be the function thatwe have previously explored in Preview Activity 1.7, whose graph is given again in Figure 1.15.(a) Reasoning visually, explain why g is differentiable at every point x such that x ≠ 0.(b) Use the limit definition of the derivative to show that g ′ (0) = lim h→0|h|h .(c) Explain why g ′ (0) fails to exist by using small positive and negative values of h.f321-3 -2 -1-11 2 3-2-3Figure 1.15: The graph of y = f(x) for Activity 1.20.(d) <strong>State</strong> all values of a for which f is not differentiable at x = a. For each, provide a reasonfor your conclusion.(e) True or false: if a function p is differentiable at x = b, then lim x→b p(x) must exist. Why?⊳
1.8. THE TANGENT LINE APPROXIMATION 311.8 The Tangent Line ApproximationPreview Activity 1.8. Consider the function y = g(x) = −x 2 + 3x + 2.Figure 1.16: Axes for plotting y = g(x) and its tangent line to the point (2, g(2)).(a) Use the limit definition of the derivative to compute a formula for y = g ′ (x).(b) Determine the slope of the tangent line to y = g(x) at the value x = 2.(c) Compute g(2).(d) Find an equation for the tangent line to y = g(x) at the point (2, f(2)). Write your result inpoint-slope form 1 .(e) On the axes provided in Figure 1.16, sketch an accurate, labeled graph of y = g(x) alongwith its tangent line at the point (2, g(2)).⊲⊳1 Recall that a line with slope m that passes through (x 0, y 0) has equation y−y 0 = m(x−x 0), and this is the point-slopeform of the equation.
32 1.8. THE TANGENT LINE APPROXIMATIONActivity 1.21.This activity concerns a function f(x) about which the following information is known:• f is a differentiable function defined at every real number x• f(2) = −1• y = f ′ (x) has its graph given in Figure 1.1722y = f ′ (x)22x2x2xFigure 1.17: At center, a graph of y = f ′ (x); at left, axes for plotting y = f(x); at right, axes forplotting y = f ′′ (x).Your task is to determine as much information as possible about f (especially near the valuea = 2) by responding to the questions below.(a) Find a formula for the tangent line approximation, L(x), to f at the point (2, −1).(b) Use the tangent line approximation to estimate the value of f(2.07). Show your workcarefully and clearly.(c) Sketch a graph of y = f ′′ (x) on the righthand grid in Figure 1.17; label it appropriately.(d) Is the slope of the tangent line to y = f(x) increasing, decreasing, or neither whenx = 2? Explain.(e) Sketch a possible graph of y = f(x) near x = 2 on the lefthand grid in Figure 1.17.Include a sketch of y = L(x) (found in part (a)). Explain how you know the graph ofy = f(x) looks like you have drawn it.(f) Does your estimate in (b) over- or under-estimate the true value of f(2)? Why?⊳
Chapter 2Computing Derivatives2.1 Elementary derivative rulesPreview Activity 2.1. Functions of the form f(x) = x n , where n = 1, 2, 3, . . ., are often called powerfunctions. The first two questions below revisit work we did earlier in Chapter 1, and the followingquestions extend those ideas to higher powers of x.(a) Use the limit definition of the derivative to find f ′ (x) for f(x) = x 2 .(b) Use the limit definition of the derivative to find f ′ (x) for f(x) = x 3 .(c) Use the limit definition of the derivative to find f ′ (x) for f(x) = x 4 . (Hint: (a + b) 4 =a 4 + 4a 3 b + 6a 2 b 2 + 4ab 3 + b 4 . Apply this rule to (x + h) 4 within the limit definition.)(d) Based on your work in (a), (b), and (c), what do you conjecture is the derivative of f(x) =x 5 ? Of f(x) = x 13 ?(e) Conjecture a formula for the derivative of f(x) = x n that holds for any positive integer n.That is, given f(x) = x n where n is a positive integer, what do you think is the formula forf ′ (x)?⊲⊳33
34 2.1. ELEMENTARY DERIVATIVE RULESActivity 2.1.Use the three rules above to determine the derivative of each of the following functions. Foreach, state your answer using full and proper notation, labeling the derivative with its name.For example, if you are given a function h(z), you should write “h ′ (z) =” or “ dhdz=” as part ofyour response.(a) f(t) = π(b) g(z) = 7 z(c) h(w) = w 3/4(d) p(x) = 3 1/2(e) r(t) = ( √ 2) t(f)ddq [q−1 ](g) m(t) = 1 t 3⊳
2.1. ELEMENTARY DERIVATIVE RULES 35Activity 2.2.Use only the rules for constant, power, and exponential functions, together with the ConstantMultiple and Sum Rules, to compute the derivative of each function below with respect tothe given independent variable. Note well that we do not yet know any rules for how todifferentiate the product or quotient of functions. This means that you may have to do somealgebra first on the functions below before you can actually use existing rules to compute thedesired derivative formula. In each case, label the derivative you calculate with its name usingproper notation such as f ′ (x), h ′ (z), dr/dt, etc.(a) f(x) = x 5/3 − x 4 + 2 x(b) g(x) = 14e x + 3x 5 − x(c) h(z) = √ z + 1z 4 + 5 z(d) r(t) = √ 53 t 7 − πe t + e 4(e) s(y) = (y 2 + 1)(y 2 − 1)(f) q(x) = x3 − x + 2x(g) p(a) = 3a 4 − 2a 3 + 7a 2 − a + 12⊳
36 2.1. ELEMENTARY DERIVATIVE RULESActivity 2.3.Each of the following questions asks you to use derivatives to answer key questions aboutfunctions. Be sure to think carefully about each question and to use proper notation in yourresponses.(a) Find the slope of the tangent line to h(z) = √ z + 1 zat the point where z = 4.(b) A population of cells is growing in such a way that its total number in millions is givenby the function P (t) = 2(1.37) t + 32, where t is measured in days.i. Determine the instantaneous rate at which the population is growing on day 4, andinclude units on your answer.ii. Is the population growing at an increasing rate or growing at a decreasing rate onday 4? Explain.(c) Find an equation for the tangent line to the curve p(a) = 3a 4 − 2a 3 + 7a 2 − a + 12 at thepoint where a = −1.(d) What the difference between being asked to find the slope of the tangent line (asked in(a)) and the equation of the tangent line (asked in (c))?⊳
2.2. THE SINE AND COSINE FUNCTIONS 372.2 The sine and cosine functionsPreview Activity 2.2. Consider the function g(x) = 2 x , which is graphed in Figure 2.1.(a) At each of x = −2, −1, 0, 1, 2, use a straightedge to sketch an accurate tangent line toy = g(x).(b) Use the provided grid to estimate the slope of the tangent line you drew at each point in(a).(c) Use the limit definition of the derivative to estimate g ′ (0) by using small values of h, andcompare the result to your visual estimate for the slope of the tangent line to y = g(x) atx = 0 in (b).(d) Based on your work in (a), (b), and (c), sketch an accurate graph of y = g ′ (x) on the axesadjacent to the graph of y = g(x).(e) Write at least one sentence that explains why it is reasonable to think that g ′ (x) = cg(x),where c is a constant. In addition, calculate ln(2), and then discuss how this value, combinedwith your work above, reasonably suggests that g ′ (x) = 2 x ln(2).7654321-2 -1 1 27654321-2 -1 1 2Figure 2.1: At left, the graph of y = g(x) = 2 x . At right, axes for plotting y = g ′ (x).⊲⊳
38 2.2. THE SINE AND COSINE FUNCTIONSActivity 2.4.Consider the function f(x) = sin(x), which is graphed in Figure 2.2 below. Note carefully thatthe grid in the diagram does not have boxes that are 1 × 1, but rather approximately 1.57 × 1,as the horizontal scale of the grid is π/2 units per box.(a) At each of x = −2π, − 3π 2 , −π, − π 2 , 0, π 2 , π, 3π 2, 2π, use a straightedge to sketch an accuratetangent line to y = f(x).(b) Use the provided grid to estimate the slope of the tangent line you drew at each point.Pay careful attention to the scale of the grid.(c) Use the limit definition of the derivative to estimate f ′ (0) by using small values of h, andcompare the result to your visual estimate for the slope of the tangent line to y = f(x)at x = 0 in (b). Using periodicity, what does this result suggest about f ′ (2π)? aboutf ′ (−2π)?(d) Based on your work in (a), (b), and (c), sketch an accurate graph of y = f ′ (x) on theaxes adjacent to the graph of y = f(x).(e) What familiar function do you think is the derivative of f(x) = sin(x)?−2π −π π-112π1−2π −π π 2π-1Figure 2.2: At left, the graph of y = f(x) = sin(x).⊳
2.2. THE SINE AND COSINE FUNCTIONS 39Activity 2.5.Consider the function g(x) = cos(x), which is graphed in Figure 2.3 below. Note carefully thatthe grid in the diagram does not have boxes that are 1 × 1, but rather approximately 1.57 × 1,as the horizontal scale of the grid is π/2 units per box.11−2π −π π 2π −2π −π π 2π-1-1Figure 2.3: At left, the graph of y = g(x) = cos(x).(a) At each of x = −2π, − 3π 2 , −π, − π 2 , 0, π 2 , π, 3π 2, 2π, use a straightedge to sketch an accuratetangent line to y = g(x).(b) Use the provided grid to estimate the slope of the tangent line you drew at each point.Again, note the scale of the axes and grid.(c) Use the limit definition of the derivative to estimate g ′ ( π 2) by using small values ofh, and compare the result to your visual estimate for the slope of the tangent line toy = g(x) at x = π 2 in (b). Using periodicity, what does this result suggest about g′ (− 3π 2 )?can symmetry on the graph help you estimate other slopes easily?(d) Based on your work in (a), (b), and (c), sketch an accurate graph of y = g ′ (x) on the axesadjacent to the graph of y = g(x).(e) What familiar function do you think is the derivative of g(x) = cos(x)?⊳
40 2.2. THE SINE AND COSINE FUNCTIONSActivity 2.6.Answer each of the following questions. Where a derivative is requested, be sure to label thederivative function with its name using proper notation.(a) Determine the derivative of h(t) = 3 cos(t) − 4 sin(t).(b) Find the exact slope of the tangent line to y = f(x) = 2x + sin(x)2at the point wherex = π 6 .(c) Find the equation of the tangent line to y = g(x) = x 2 + 2 cos(x) at the point wherex = π 2 .(d) Determine the derivative of p(z) = z 4 + 4 z + 4 cos(z) − sin( π 2 ).(e) The function P (t) = 24 + 8 sin(t) represents a population of a particular kind of animalthat lives on a small island, where P is measured in hundreds and t is measured indecades since January 1, 2010. What is the instantaneous rate of change of P on January1, 2030? What are the units of this quantity? Write a sentence in everyday language thatexplains how the population is behaving at this point in time.⊳
2.3. THE PRODUCT AND QUOTIENT RULES 412.3 The product and quotient rulesPreview Activity 2.3. Let f and g be the functions defined by f(t) = 2t 2 and g(t) = t 3 + 4t.(a) Determine f ′ (t) and g ′ (t).(b) Let p(t) = 2t 2 (t 3 + 4t) and observe that p(t) = f(t) · g(t). Rewrite the formula for p bydistributing the 2t 2 term. Then, compute p ′ (t) using the sum and constant multiple rules.(c) True or false: p ′ (t) = f ′ (t) · g ′ (t).(d) Let q(t) = t3 + 4t2t 2 and observe that q(t) = g(t) . Rewrite the formula for q by dividing eachf(t)term in the numerator by the denominator and simplify to write q as a sum of constantmultiples of powers of t. Then, compute q ′ (t) using the sum and constant multiple rules.(e) True or false: q ′ (t) = g′ (t)f ′ (t) .⊲⊳
42 2.3. THE PRODUCT AND QUOTIENT RULESActivity 2.7.Use the product rule to answer each of the questions below. Throughout, be sure to carefullylabel any derivative you find by name. That is, if you’re given a formula for f(x), clearly labelthe formula you find for f ′ (x). It is not necessary to algebraically simplify any of the derivativesyou compute.(a) Let m(w) = 3w 17 4 w . Find m ′ (w).(b) Let h(t) = (sin(t) + cos(t))t 4 . Find h ′ (t).(c) Determine the slope of the tangent line to the curve y = f(x) at the point where a = 1 iff is given by the rule f(x) = e x sin(x).(d) Find the tangent line approximation L(x) to the function y = g(x) at the point wherea = −1 if g is given by the rule g(x) = (x 2 + x)2 x .⊳
2.3. THE PRODUCT AND QUOTIENT RULES 43Activity 2.8.Use the quotient rule to answer each of the questions below. Throughout, be sure to carefullylabel any derivative you find by name. That is, if you’re given a formula for f(x), clearly labelthe formula you find for f ′ (x). It is not necessary to algebraically simplify any of the derivativesyou compute.(a) Let r(z) =(b) Let v(t) =3zz 4 + 1 . Find r′ (z).sin(t)cos(t) + t 2 . Find v′ (t).(c) Determine the slope of the tangent line to the curve R(x) = x2 − 2x − 8x 2 at the point− 9where x = 0.(d) When a camera flashes, the intensity I of light seen by the eye is given by the functionI(t) = 100te t ,where I is measured in candles and t is measured in milliseconds. Compute I ′ (0.5),I ′ (2), and I ′ (5); include appropriate units on each value; and discuss the meaning ofeach.⊳
44 2.3. THE PRODUCT AND QUOTIENT RULESActivity 2.9.Use relevant derivative rules to answer each of the questions below. Throughout, be sure touse proper notation and carefully label any derivative you find by name.(a) Let f(r) = (5r 3 + sin(r))(4 r − 2 cos(r)). Find f ′ (r).(b) Let p(t) = cos(t)t 6 · 6 t . Find p′ (t).(c) Let g(z) = 3z 7 e z − 2z 2 sin(z) +zz 2 + 1 . Find g′ (z).(d) A moving particle has its position in feet at time t in seconds given by the function3 cos(t) − sin(t)s(t) =e t . Find the particle’s instantaneous velocity at the moment t = 1.(e) Suppose that f(x) and g(x) are differentiable functions and it is known that f(3) = −2,f ′ (3) = 7, g(3) = 4, and g ′ (3) = −1. If p(x) = f(x) · g(x) and q(x) = f(x)g(x) , calculate p′ (3)and q ′ (3).⊳
2.4. DERIVATIVES OF OTHER TRIGONOMETRIC FUNCTIONS 452.4 Derivatives of other trigonometric functionsPreview Activity 2.4. Consider the function f(x) = tan(x), and remember that tan(x) = sin(x)cos(x) .(a) What is the domain of f?(b) Use the quotient rule to show that one expression for f ′ (x) isf ′ (x) =cos(x) cos(x) + sin(x) sin(x)cos 2 .(x)(c) What is the Fundamental Trigonometric Identity? How can this identity be used to find asimpler form for f ′ (x)?(d) Recall that sec(x) = 1cos(x) . How can we express f ′ (x) in terms of the secant function?(e) For what values of x is f ′ (x) defined? How does this set compare to the domain of f?⊲⊳
46 2.4. DERIVATIVES OF OTHER TRIGONOMETRIC FUNCTIONSActivity 2.10.Let h(x) = sec(x) and recall that sec(x) = 1cos(x) .(a) What is the domain of h?(b) Use the quotient rule to develop a formula for h ′ (x) that is expressed completely interms of sin(x) and cos(x).(c) How can you use other relationships among trigonometric functions to write h ′ (x) onlyin terms of tan(x) and sec(x)?(d) What is the domain of h ′ ? How does this compare to the domain of h?⊳
2.4. DERIVATIVES OF OTHER TRIGONOMETRIC FUNCTIONS 47Activity 2.11.Let p(x) = csc(x) and recall that csc(x) = 1sin(x) .(a) What is the domain of p?(b) Use the quotient rule to develop a formula for p ′ (x) that is expressed completely interms of sin(x) and cos(x).(c) How can you use other relationships among trigonometric functions to write p ′ (x) onlyin terms of cot(x) and csc(x)?(d) What is the domain of p ′ ? How does this compare to the domain of p?⊳
48 2.4. DERIVATIVES OF OTHER TRIGONOMETRIC FUNCTIONSActivity 2.12.Answer each of the following questions. Where a derivative is requested, be sure to label thederivative function with its name using proper notation.(a) Let f(x) = 5 sec(x) − 2 csc(x). Find the slope of the tangent line to f at the point wherex = π 3 .(b) Let p(z) = z 2 sec(z) − z cot(z). Find the instantaneous rate of change of p at the pointwhere z = π 4 .(c) Let h(t) = tan(t)t 2 + 1 − 2et cos(t). Find h ′ (t).(d) Let g(r) = r sec(r)5 r . Find g ′ (r).(e) When a mass hangs from a spring and is set in motion, the object’s position oscillates ina way that the size of the oscillations decrease. This is usually called a damped oscillation.Suppose that for a particular object, its displacement from equilibrium (where the objectsits at rest) is modeled by the functions(t) =15 sin(t)e t .Assume that s is measured in inches and t in seconds. Sketch a graph of this functionfor t ≥ 0 to see how it represents the situation described. Then compute ds/dt, state theunits on this function, and explain what it tells you about the object’s motion. Finally,compute and interpret s ′ (2).⊳
2.5. THE CHAIN RULE 492.5 The chain rulePreview Activity 2.5. For each function given below, identify its fundamental algebraic structure.In particular, is the given function a sum, product, quotient, or composition of basic functions? Ifthe function is a composition of basic functions, state a formula for the inner function g and theouter function f so that the overall composite function can be written in the form f(g(x)). If thefunction is a sum, product, or quotient of basic functions, use the appropriate rule to determineits derivative.(a) h(x) = tan(2 x )(b) p(x) = 2 x tan(x)(c) r(x) = (tan(x)) 2(d) m(x) = e tan(x)(e) w(x) = √ x + tan(x)(f) z(x) = √ tan(x)⊲⊳
50 2.5. THE CHAIN RULEActivity 2.13.For each function given below, identify an inner function g and outer function f to write thefunction in the form f(g(x)). Then, determine f ′ (x), g ′ (x), and f ′ (g(x)), and finally apply thechain rule to determine the derivative of the given function.(a) h(x) = cos(x 4 )(b) p(x) = √ tan(x)(c) s(x) = 2 sin(x)(d) z(x) = cot 5 (x)(e) m(x) = (sec(x) + e x ) 9⊳
2.5. THE CHAIN RULE 51Activity 2.14.For each of the following functions, find the function’s derivative. <strong>State</strong> the rule(s) you use,label relevant derivatives appropriately, and be sure to clearly identify your overall answer.(a) p(r) = 4 √ r 6 + 2e r(b) m(v) = sin(v 2 ) cos(v 3 )(c) h(y) = cos(10y)e 4y + 1(d) s(z) = 2 z2 sec(z)(e) c(x) = sin(e x2 )⊳
52 2.5. THE CHAIN RULEActivity 2.15.Use known derivative rules, including the chain rule, as needed to answer each of the followingquestions.(a) Find an equation for the tangent line to the curve y = √ e x + 3 at the point where x = 0.1(b) If s(t) =(t 2 represents the position function of a particle moving horizontally+ 1) 3along an axis at time t (where s is measured in inches and t in seconds), find the particle’sinstantaneous velocity at t = 1. Is the particle moving to the left or right at thatinstant?(c) At sea level, air pressure is 30 inches of mercury. At an altitude of h feet above sea level,the air pressure, P , in inches of mercury, is given by the functionP = 30e −0.0000323h .Compute dP/dh and explain what this derivative function tells you about air pressure,including a discussion of the units on dP/dh. In addition, determine how fast the airpressure is changing for a pilot of a small plane passing through an altitude of 1000 feet.(d) Suppose that f(x) and g(x) are differentiable functions and that the following informationabout them is known:x f(x) f ′ (x) g(x) g ′ (x)−1 2 −5 −3 42 −3 4 −1 2If C(x) is a function given by the formula f(g(x)), determine C ′ (2). In addition, if D(x)is the function f(f(x)), find D ′ (−1).⊳
2.6. DERIVATIVES OF INVERSE FUNCTIONS 532.6 Derivatives of Inverse FunctionsPreview Activity 2.6. The equation y = 5 9(x−32) relates a temperature given in x degrees Fahrenheitto the corresponding temperature y measured in degrees Celcius.(a) Solve the equation y = 5 9(x − 32) for x to write x (Fahrenheit temperature) in terms of y(Celcius temperature).(b) Let C(x) = 5 9(x − 32) be the function that takes a Fahrenheit temperature as input andproduces the Celcius temperature as output. In addition, let F (y) be the function thatconverts a temperature given in y degrees Celcius to the temperature F (y) measured indegrees Fahrenheit. Use your work in (a) to write a formula for F (y).(c) Next consider the new function defined by p(x) = F (C(x)). Use the formulas for F andC to determine an expression for p(x) and simplify this expression as much as possible.What do you observe?(d) Now, let r(y) = C(F (y)). Use the formulas for F and C to determine an expression forr(y) and simplify this expression as much as possible. What do you observe?(e) What is the value of C ′ (x)? of F ′ (y)? How do these values appear to be related?⊲⊳
54 2.6. DERIVATIVES OF INVERSE FUNCTIONSActivity 2.16.For each function given below, find its derivative.(a) h(x) = x 2 ln(x)(b) p(t) = ln(t)e t + 1(c) s(y) = ln(cos(y) + 2)(d) z(x) = tan(ln(x))(e) m(z) = ln(ln(z))⊳
2.6. DERIVATIVES OF INVERSE FUNCTIONS 55Activity 2.17.The following prompts in this activity will lead you to develop the derivative of the inversetangent function.(a) Let r(x) = arctan(x). Use the relationship between the arctangent and tangent functionsto rewrite this equation using only the tangent function.(b) Differentiate both sides of the equation you found in (a). Solve the resulting equation forr ′ (x), writing r ′ (x) as simply as possible in terms of a trigonometric function evaluatedat r(x).(c) Recall that r(x) = arctan(x). Update your expression for r ′ (x) so that it only involvestrigonometric functions and the independent variable x.(d) Introduce a right triangle with angle θ so that θ = arctan(x). What are the three sides ofthe triangle?(e) In terms of only x and 1, what is the value of cos(arctan(x))?(f) Use the results of your work above to find an expression involving only 1 and x forr ′ (x).⊳
56 2.6. DERIVATIVES OF INVERSE FUNCTIONSActivity 2.18.Determine the derivative of each of the following functions.(a) f(x) = x 3 arctan(x) + e x ln(x)(b) p(t) = 2 t arcsin(t)(c) h(z) = (arcsin(5z) + arctan(4 − z)) 27(d) s(y) = cot(arctan(y))(e) m(v) = ln(sin 2 (v) + 1)( ) ln(w)(f) g(w) = arctan1 + w 2⊳
2.7. DERIVATIVES OF FUNCTIONS GIVEN IMPLICITLY 572.7 Derivatives of Functions Given ImplicitlyPreview Activity 2.7. Let f be a differentiable function of x (whose formula is not known) and recallthat ddx [f(x)] and f ′ (x) are interchangeable notations. Determine each of the following derivativesof combinations of explicit functions of x, the unknown function f, and an arbitrary constantc.(a)(b)(c)(d)(e)d [x 2 + f(x) ]dxd [x 2 f(x) ]dxd [c + x + f(x)2 ]dxd [f(x 2 ) ]dxd[xf(x) + f(cx) + cf(x)]dx⊲⊳
58 2.7. DERIVATIVES OF FUNCTIONS GIVEN IMPLICITLYActivity 2.19.Consider the curve defined by the equation x = y 5 − 5y 3 + 4y, whose graph is pictured inFigure 2.4.3y-3 3x-3Figure 2.4: The curve x = y 5 − 5y 3 + 4y.(a) Explain why it is not possible to express y as an explicit function of x.(b) Use implicit differentiation to find a formula for dy/dx.(c) Use your result from part (b) to find an equation of the line tangent to the graph ofx = y 5 − 5y 3 + 4y at the point (0, 1).(d) Use your result from part (b) to determine all of the points at which the graph of x =y 5 − 5y 3 + 4y has a vertical tangent line.⊳
2.7. DERIVATIVES OF FUNCTIONS GIVEN IMPLICITLY 59Activity 2.20.Consider the curve defined by the equation y(y 2 − 1)(y − 2) = x(x − 1)(x − 2), whose graph ispictured in Figure 2.5. Through implicit differentiation, it can be shown that2y11 2 3x-1Figure 2.5: The curve y(y 2 − 1)(y − 2) = x(x − 1)(x − 2).dy (x − 1)(x − 2) + x(x − 2) + x(x − 1)=dx (y 2 − 1)(y − 2) + 2y 2 (y − 2) + y(y 2 − 1) .Use this fact to answer each of the following questions.(a) Determine all points (x, y) at which the tangent line to the curve is horizontal.(b) Determine all points (x, y) at which the tangent line is vertical.(c) Find the equation of the tangent line to the curve at one of the points where x = 1.⊳
60 2.7. DERIVATIVES OF FUNCTIONS GIVEN IMPLICITLYActivity 2.21.For each of the following curves, use implicit differentiation to find dy/dx and determine theequation of the tangent line at the given point.(a) x 3 − y 3 = 6xy, (−3, 3)(b) sin(y) + y = x 3 + x, (0, 0)(c) xe −xy = y 2 , (0.571433, 1)⊳
2.8. USING DERIVATIVES TO EVALUATE LIMITS 612.8 Using Derivatives to Evaluate LimitsPreview Activity 2.8. Let h be the function given by h(x) = x5 + x − 2x 2 .− 1(a) What is the domain of h?x 5 + x − 2(b) Explain why limx→1 x 2 results in an indeterminate form.− 1(c) Next we will investigate the behavior of both the numerator and denominator of h nearthe point where x = 1. Let f(x) = x 5 +x−2 and g(x) = x 2 −1. Find the local linearizationsof f and g at a = 1, and call these functions L f (x) and L g (x), respectively.(d) Explain why h(x) ≈ L f (x)for x near a = 1.L g (x)(e) Using your work from (c), evaluateL f (x)limx→1 L g (x) .What do you think your result tells us about limx→1h(x)?(f) Investigate the function h(x) graphically and numerically near x = 1. What do you thinkis the value of limx→1h(x)?⊲⊳
62 2.8. USING DERIVATIVES TO EVALUATE LIMITSActivity 2.22.Evaluate each of the following limits. If you use L’Hopital’s Rule, indicate where it was used,and be certain its hypotheses are met before you apply it.(a) limx→0ln(1 + x)x(b) limx→πcos(x)x2 ln(x)(c) limx→1 1 − e x−1(d) limx→0sin(x) − xcos(2x) − 1⊳
2.8. USING DERIVATIVES TO EVALUATE LIMITS 63Activity 2.23.In this activity, we reason graphically to evaluate limits of ratios of functions about which someinformation is known.2gf212 p 1q1r1 2 3 41 2 3 41 2 3 4-1-1-1-2-2-2sFigure 2.6: Three graphs referenced in the questions of Activity 2.23.(a) Use the left-hand graph to determine the values of f(2), f ′ (2), g(2), and g ′ (2). Then,evaluatef(x)limx→2 g(x) .(b) Use the middle graph to find p(2), p ′ (2), q(2), and q ′ (2). Then, determine the value ofp(x)limx→2 q(x) .(c) Use the right-hand graph to compute r(2), r ′ (2), s(2), s ′ (2). Explain why you cannotdetermine the exact value ofr(x)limx→2 s(x)without further information being provided, but that you can determine the sign ofr(x)lim x→2 s(x). In addition, state what the sign of the limit will be, with justification.⊳
64 2.8. USING DERIVATIVES TO EVALUATE LIMITSActivity 2.24.Evaluate each of the following limits. If you use L’Hopital’s Rule, indicate where it was used,and be certain its hypotheses are met before you apply it.x(a) limx→∞ ln(x)(b)(c)(d)limx→∞e x + x2e x + x 2ln(x)limx→0 + 1xtan(x)limx→ π − x − π 2 2(e)limx→∞ xe−x⊳
Chapter 3Using Derivatives3.1 Using derivatives to identify extreme values of a functionPreview Activity 3.1. Consider the function h given by the graph in Figure 3.1. Use the graph toanswer each of the following questions.2y = h(x)1-2 -1 1 2-1-2Figure 3.1: The graph of a function h on the interval [−3, 3].(a) Identify all of the values of c for which h(c) is a local maximum of h.(b) Identify all of the values of c for which h(c) is a local minimum of h.(c) Does h have a global maximum? If so, what is the value of this global maximum?(d) Does h have a global minimum? If so, what is its value?(e) Identify all values of c for which h ′ (c) = 0.65
66 3.1. USING DERIVATIVES TO IDENTIFY EXTREME VALUES OF A FUNCTION(f) Identify all values of c for which h ′ (c) does not exist.(g) True or false: every relative maximum and minimum of h occurs at a point where h ′ (c) iseither zero or does not exist.(h) True or false: at every point where h ′ (c) is zero or does not exist, h has a relative maximumor minimum.⊲⊳
3.1. USING DERIVATIVES TO IDENTIFY EXTREME VALUES OF A FUNCTION 67Activity 3.1.Suppose that g(x) is a function continuous for every value of x ≠ 2 whose first derivative isg ′ (x + 4)(x − 1)2(x) = . Further, assume that it is known that g has a vertical asymptote atx − 2x = 2.(a) Determine all critical values of g.(b) By developing a carefully labeled first derivative sign chart, decide whether g has as alocal maximum, local minimum, or neither at each critical value.(c) Does g have a global maximum? global minimum? Justify your claims.(d) What is the value of limx→∞ g′ (x)? What does the value of this limit tell you about thelong-term behavior of g?(e) Sketch a possible graph of y = g(x).⊳
68 3.1. USING DERIVATIVES TO IDENTIFY EXTREME VALUES OF A FUNCTIONActivity 3.2.Suppose that g is a function whose second derivative, g ′′ , is given by the following graph.g ′′211 2Figure 3.2: The graph of y = g ′′ (x).(a) Find all points of inflection of g.(b) Fully describe the concavity of g by making an appropriate sign chart.(c) Suppose you are given that g ′ (−1.67857351) = 0. Is there is a local maximum, localminimum, or neither (for the function g) at this critical value of g, or is it impossible tosay? Why?(d) Assuming that g ′′ (x) is a polynomial (and that all important behavior of g ′′ is seen inthe graph above, what degree polynomial do you think g(x) is? Why?⊳
3.1. USING DERIVATIVES TO IDENTIFY EXTREME VALUES OF A FUNCTION 69Activity 3.3.Consider the family of functions given by h(x) = x 2 + cos(kx), where k is an arbitrary positivereal number.(a) Use a graphing utility to sketch the graph of h for several different k-values, includingk = 1, 3, 5, 10. Plot h(x) = x 2 +cos(3x) on the axes provided below. What is the smallest1284-2 2Figure 3.3: Axes for plotting y = h(x).value of k at which you think you can see (just by looking at the graph) at least oneinflection point on the graph of h?(b) Explain why the graph of h has no inflection points if k < √ 2, but infinitely manyinflection points if k ≥ √ 2.(c) Explain why, no matter the value of k, h can only have a finite number of critical values.⊳
70 3.2. USING DERIVATIVES TO DESCRIBE FAMILIES OF FUNCTIONS3.2 Using derivatives to describe families of functionsPreview Activity 3.2. Let a, h, and k be arbitrary real numbers with a ≠ 0, and let f be the functiongiven by the rule f(x) = a(x − h) 2 + k.(a) What familiar type of function is f? What information do you know about f just by lookingat its form? (Think about the roles of a, h, and k.)(b) Next we use some calculus to develop familiar ideas from a different perspective. To start,treat a, h, and k as constants and compute f ′ (x).(c) Find all critical values of f. (These will depend on at least one of a, h, and k.)(d) Assume that a < 0. Construct a first derivative sign chart for f.(e) Based on the information you’ve found above, classify the critical values of f as maximaor minima.⊲⊳
3.2. USING DERIVATIVES TO DESCRIBE FAMILIES OF FUNCTIONS 71Activity 3.4.Consider the family of functions defined by p(x) = x 3 −ax, where a ≠ 0 is an arbitrary constant.(a) Find p ′ (x) and determine the critical values of p. How many critical values does p have?(b) Construct a first derivative sign chart for p. What can you say about the overall behaviorof p if the constant a is positive? Why? What if the constant a is negative? In each case,describe the relative extremes of p.(c) Find p ′′ (x) and construct a second derivative sign chart for p. What does this tell youabout the concavity of p? What role does a play in determining the concavity of p?(d) Without using a graphing utility, sketch and label typical graphs of p(x) for the caseswhere a > 0 and a < 0. Label all inflection points and local extrema.(e) Finally, use a graphing utility to test your observations above by entering and plottingthe function p(x) = x 3 −ax for at least four different values of a. Write several sentencesto describe your overall conclusions about how the behavior of p depends on a.⊳
72 3.2. USING DERIVATIVES TO DESCRIBE FAMILIES OF FUNCTIONSActivity 3.5.Consider the two-parameter family of functions of the form h(x) = a(1 − e −bx ), where a and bare positive real numbers.(a) Find the first derivative and the critical values of h. Use these to construct a first derivativesign chart and determine for which values of x the function h is increasing anddecreasing.(b) Find the second derivative and build a second derivative sign chart. For which valuesof x is a function in this family concave up? concave down?(c) What is the value of lim a(1 −x→∞ e−bx )? lim a(1 −x→−∞ e−bx )?(d) How does changing the value of b affect the shape of the curve?(e) Without using a graphing utility, sketch the graph of a typical member of this family.Write several sentences to describe the overall behavior of a typical function h and howthis behavior depends on a and b.⊳
3.2. USING DERIVATIVES TO DESCRIBE FAMILIES OF FUNCTIONS 73Activity 3.6.Let L(t) =A, where A, c, and k are all positive real numbers.1 + ce−kt (a) Observe that we can equivalently write L(t) = A(1 + ce −kt ) −1 . Find L ′ (t) and explainwhy L has no critical values. Is L always increasing or always decreasing? Why?(b) Given the fact thatL ′′ (t) = Ack 2 e −kt ce −kt − 1(1 + ce −kt ) 3 ,find all values of t such that L ′′ (t) = 0 and hence construct a second derivative signchart. For which values of t is a function in this family concave up? concave down?(c) What is the value of limt→∞A? lim1 + ce−kt t→−∞A1 + ce −kt ?(d) Find the value of L(x) at the inflection point found in (b).(e) Without using a graphing utility, sketch the graph of a typical member of this family.Write several sentences to describe the overall behavior of a typical function h and howthis behavior depends on a and b.(f) Explain why it is reasonable to think that the function L(t) models the growth of apopulation over time in a setting where the largest possible population the surroundingenvironment can support is A.⊳
74 3.3. GLOBAL OPTIMIZATION3.3 Global OptimizationPreview Activity 3.3. Let f(x) = 2 +31 + (x + 1) 2 .(a) Determine all of the critical values of f.(b) Construct a first derivative sign chart for f and thus determine all intervals on which f isincreasing or decreasing.(c) Does f have a global maximum? If so, why, and what is its value and where is the maximumattained? If not, explain why.(d) Determine lim f(x) and lim f(x).x→∞ x→−∞(e) Explain why f(x) > 2 for every value of x.(f) Does f have a global minimum? If so, why, and what is its value and where is the minimumattained? If not, explain why.⊲⊳
3.3. GLOBAL OPTIMIZATION 75Activity 3.7.Let g(x) = 1 3 x3 − 2x + 2.(a) Find all critical values of g that lie in the interval −2 ≤ x ≤ 3.(b) Use a graphing utility to construct the graph of g on the interval −2 ≤ x ≤ 3.(c) From the graph, determine the x-values at which the global minimum and global maximumof g occur on the interval [−2, 3].(d) How do your answers change if we instead consider the interval −2 ≤ x ≤ 2?(e) What if we instead consider the interval −2 ≤ x ≤ 1?⊳
76 3.3. GLOBAL OPTIMIZATIONActivity 3.8.Find the exact absolute maximum and minimum of each function on the stated interval.(a) h(x) = xe −x , [0, 3](b) p(t) = sin(t) + cos(t), [− π 2 , π 2 ](c) q(x) = x2x−2, [3, 7](d) f(x) = 4 − e −(x−2)2 , (−∞, ∞)⊳
3.3. GLOBAL OPTIMIZATION 77Activity 3.9.A piece of cardboard that is 10 × 15 (each measured in inches) is being made into a box withouta top. To do so, squares are cut from each corner of the box and the remaining sides are foldedup. If the box needs to be at least 1 inch deep and no more than 3 inches deep, what is themaximum possible volume of the box? what is the minimum volume? Justify your answersusing calculus.(a) Draw a labeled diagram that shows the given information. What variable should weintroduce to represent the choice we make in creating the box? Label the diagram appropriatelywith the variable, and write a sentence to state what the variable represents.(b) Determine a formula for the function V (that depends on the variable in (a)) that tellsus the volume of the box.(c) What is the domain of the function V ? That is, what values of x make sense for input?Are there additional restrictions provided in the problem?(d) Determine all critical values of the function V .(e) Evaluate V at each of the endpoints of the domain and at any critical values that lie inthe domain.(f) What is the maximum possible volume of the box? the minimum?⊳
78 3.4. APPLIED OPTIMIZATION3.4 Applied OptimizationPreview Activity 3.4. According to U.S. postal regulations, the girth plus the length of a parcelsent by mail may not exceed 108 inches, where by “girth” we mean the perimeter of the smallestend. What is the largest possible volume of a rectangular parcel with a square end that can be sentby mail? What are the dimensions of the package of largest volume?Figure 3.4: A rectangular parcel with a square end.(a) Let x represent the length of one side of the square end and y the length of the longer side.Label these quantities appropriately on the image shown in Figure 3.4.(b) What is the quantity to be optimized in this problem? Find a formula for this quantity interms of x and y.(c) The problem statement tells us that the parcel’s girth plus length may not exceed 108inches. In order to maximize volume, we assume that we will actually need the girthplus length to equal 108 inches. What equation does this produce involving x and y?(d) Solve the equation you found in (c) for one of x or y (whichever is easier).(e) Now use your work in (b) and (d) to determine a formula for the volume of the parcel sothat this formula is a function of a single variable.(f) Over what domain should we consider this function? Note that both x and y must bepositive; how does the constraint that girth plus length is 108 inches produce intervals ofpossible values for x and y?(g) Find the absolute maximum of the volume of the parcel on the domain you establishedin (f) and hence also determine the dimensions of the box of greatest volume. Justify thatyou’ve found the maximum using calculus.⊲⊳
3.4. APPLIED OPTIMIZATION 79Activity 3.10.A soup can in the shape of a right circular cylinder is to be made from two materials. Thematerial for the side of the can costs $0.015 per square inch and the material for the lids costs$0.027 per square inch. Suppose that we desire to construct a can that has a volume of 16 cubicinches. What dimensions minimize the cost of the can?(a) Draw a picture of the can and label its dimensions with appropriate variables.(b) Use your variables to determine expressions for the volume, surface area, and cost ofthe can.(c) Determine the total cost function as a function of a single variable. What is the domainon which you should consider this function?(d) Find the absolute minimum cost and the dimensions that produce this value.⊳
80 3.4. APPLIED OPTIMIZATIONActivity 3.11.A hiker starting at a point P on a straight road walks east towards point Q, which is on the roadand 3 kilometers from point P . Two kilometers due north of point Q is a cabin. The hiker willwalk down the road for a while, at a pace of 8 kilometers per hour. At some point Z betweenP and Q, the hiker leaves the road and makes a straight line towards the cabin through thewoods, hiking at a pace of 3 kph, as pictured in Figure 3.5. In order to minimize the time to gofrom P to Z to the cabin, where should the hiker turn into the forest?cabin2P3ZQFigure 3.5: A hiker walks from P to Z to the cabin, as pictured.⊳
3.4. APPLIED OPTIMIZATION 81Activity 3.12.Consider the region in the x-y plane that is bounded by the x-axis and the function f(x) =25 − x 2 . Construct a rectangle whose base lies on the x-axis and is centered at the origin, andwhose sides extend vertically until they intersect the curve y = 25 − x 2 . Which such rectanglehas the maximum possible area? Which such rectangle has the greatest perimeter? Which hasthe greatest combined perimeter and area? (Challenge: answer the same questions in terms ofpositive parameters a and b for the function f(x) = b − ax 2 .)⊳
82 3.4. APPLIED OPTIMIZATIONActivity 3.13.A trough is being constructed by bending a 4 × 24 (measured in feet) rectangular piece of sheetmetal. Two symmetric folds 2 feet apart will be made parallel to the longest side of the rectangleso that the trough has cross-sections in the shape of a trapezoid, as pictured in Figure 3.6. Atwhat angle should the folds be made to produce the trough of maximum volume?θ1 12Figure 3.6: A cross-section of the trough formed by folding to an angle of θ.⊳
3.5. RELATED RATES 833.5 Related RatesPreview Activity 3.5. A spherical balloon is being inflated at a constant rate of 20 cubic inches persecond. How fast is the radius of the balloon changing at the instant the balloon’s diameter is 12inches? Is the radius changing more rapidly when d = 12 or when d = 16? Why?(a) Draw several spheres with different radii, and observe that as volume changes, the radius,diameter, and surface area of the balloon also change.(b) Recall that the volume of a sphere of radius r is V = 4 3 πr3 . Note well that in the setting ofthis problem, both V and r are changing as time t changes, and thus both V and r may beviewed as implicit functions of t, with respective derivatives dV drdtanddt .Differentiate both sides of the equation V = 4 3 πr3 with respect to t (using the chain rule onthe right) to find a formula for dVdtthat depends on both r anddrdt .(c) At this point in the problem, by differentiating we have “related the rates” of change ofV and r. Recall that we are given in the problem that the balloon is being inflated at aconstant rate of 20 cubic inches per second. Is this rate the value of dr dVdtordt ? Why?(d) From part (c), we know the value of dVdtat every value of t. Next, observe that when the diameterof the balloon is 12, we know the value of the radius. In the equation dVdrdt= 4πr2dt ,substitute these values for the relevant quantities and solve for the remaining unknownquantity, which is drdt. How fast is the radius changing at the instant d = 12?(e) How is the situation different when d = 16? When is the radius changing more rapidly,when d = 12 or when d = 16?⊲⊳
84 3.5. RELATED RATESActivity 3.14.A water tank has the shape of an inverted circular cone (point down) with a base of radius6 feet and a depth of 8 feet. Suppose that water is being pumped into the tank at a constantinstantaneous rate of 4 cubic feet per minute.(a) Draw a picture of the conical tank, including a sketch of the water level at a point intime when the tank is not yet full. Introduce variables that measure the radius of thewater’s surface and the water’s depth in the tank, and label them on your figure.(b) Say that r is the radius and h the depth of the water at a given time, t. What equationrelates the radius and height of the water, and why?(c) Determine an equation that relates the volume of water in the tank at time t to the depthh of the water at that time.(d) Through differentiation, find an equation that relates the instantaneous rate of changeof water volume with respect to time to the instantaneous rate of change of water depthat time t.(e) Find the instantaneous rate at which the water level is rising when the water in the tankis 3 feet deep.(f) When is the water rising most rapidly: at h = 3, h = 4, or h = 5?⊳
3.5. RELATED RATES 85Activity 3.15.A television camera is positioned 4000 feet from the base of a rocket launching pad. The angleof elevation of the camera has to change at the correct rate in order to keep the rocket in sight. Inaddition, the auto-focus of the camera has to take into account the increasing distance betweenthe camera and the rocket. We assume that the rocket rises vertically. (A similar problem isdiscussed and pictured dynamically at http://gvsu.edu/s/9t. Exploring the applet at thelink will be helpful to you in answering the questions that follow.)(a) Draw a figure that summarizes the given situation. What parts of the picture are changing?What parts are constant? Introduce appropriate variables to represent the quantitiesthat are changing.(b) Find an equation that relates the camera’s angle of elevation to the height of the rocket,and then find an equation that relates the instantaneous rate of change of the camera’selevation angle to the instantaneous rate of change of the rocket’s height (where all ratesof change are with respect to time).(c) Find an equation that relates the distance from the camera to the rocket to the rocket’sheight, as well as an equation that relates the instantaneous rate of change of distancefrom the camera to the rocket to the instantaneous rate of change of the rocket’s height(where all rates of change are with respect to time).(d) Suppose that the rocket’s speed is 600 ft/sec at the instant it has risen 3000 feet. Howfast is the distance from the television camera to the rocket changing at that moment? Ifthe camera is following the rocket, how fast is the camera’s angle of elevation changingat that same moment?(e) If from an elevation of 3000 feet onward the rocket continues to rise at 600 feet/sec, willthe rate of change of distance with respect to time be greater when the elevation is 4000feet than it was at 3000 feet, or less? Why?⊳
86 3.5. RELATED RATESActivity 3.16.As pictured in the applet at http://gvsu.edu/s/9q, a skateboarder who is 6 feet tall ridesunder a 15 foot tall lamppost at a constant rate of 3 feet per second. We are interested inunderstanding how fast his shadow is changing at various points in time.(a) Draw an appropriate right triangle that represents a snapshot in time of the skateboarder,lamppost, and his shadow. Let x denote the horizontal distance from the baseof the lamppost to the skateboarder and s represent the length of his shadow. Labelthese quantities, as well as the skateboarder’s height and the lamppost’s height on thediagram.(b) Observe that the skateboarder and the lamppost represent parallel line segments in thediagram, and thus similar triangles are present. Use similar triangles to establish anequation that relates x and s.(c) Use your work in (b) to find an equation that relates dxdtanddsdt .(d) At what rate is the length of the skateboarder’s shadow increasing at the instant theskateboarder is 8 feet from the lamppost?(e) As the skateboarder’s distance from the lamppost increases, is his shadow’s length increasingat an increasing rate, increasing at a decreasing rate, or increasing at a constantrate?(f) Which is moving more rapidly: the skateboarder or the tip of his shadow? Explain, andjustify your answer.⊳
3.5. RELATED RATES 87Activity 3.17.A baseball diamond is 90 ′ square. A batter hits a ball along the third base line runs to first base.At what rate is the distance between the ball and first base changing when the ball is halfwayto third base, if at that instant the ball is traveling 100 feet/sec? At what rate is the distancebetween the ball and the runner changing at the same instant, if at the same instant the runneris 1/8 of the way to first base running at 30 feet/sec?⊳
88 3.5. RELATED RATES
Chapter 4The Definite Integral4.1 Determining distance traveled from velocityPreview Activity 4.1. Suppose that a person is taking a walk along a long straight path and walksat a constant rate of 3 miles per hour.(a) On the left-hand axes provided in Figure 4.1, sketch a labeled graph of the velocity functionv(t) = 3. Note that while the scale on the two sets of axes is the same, the units on the right-8mph8miles44hrshrs1 21 2Figure 4.1: At left, axes for plotting y = v(t); at right, for plotting y = s(t).hand axes differ from those on the left. The right-hand axes will be used in question (d).(b) How far did the person travel during the two hours? How is this distance related to thearea of a certain region under the graph of y = v(t)?(c) Find an algebraic formula, s(t), for the position of the person at time t, assuming thats(0) = 0. Explain your thinking.89
90 4.1. DETERMINING DISTANCE TRAVELED FROM VELOCITY(d) On the right-hand axes provided in Figure 4.1, sketch a labeled graph of the position functiony = s(t).(e) For what values of t is the position function s increasing? Explain why this is the caseusing relevant information about the velocity function v.⊲⊳
4.1. DETERMINING DISTANCE TRAVELED FROM VELOCITY 91Activity 4.1.Suppose that a person is walking in such a way that her velocity varies slightly according tothe information given in the table below and graph given in Figure 4.2.t 0.00 0.25 0.50 0.75 1.00 1.25 1.50 1.75 2.00v(t) 1.5000 1.7891 1.9375 1.9922 2.0000 2.0078 2.0625 2.2109 2.50003 mph y = v(t)2hrs11 2Figure 4.2: The graph of y = v(t).(a) Using the grid, graph, and given data appropriately, estimate the distance traveled bythe walker during the two hour interval from t = 0 to t = 2. You should use time intervalsof width △t = 0.5, choosing a way to use the function consistently to determinethe height of each rectangle in order to approximate distance traveled.(b) How could you get a better approximation of the distance traveled on [0, 2]? Explain,and then find this new estimate.(c) Now suppose that you know that v is given by v(t) = 0.5t 3 −1.5t 2 +1.5t+1.5. Rememberthat v is the derivative of the walker’s position function, s. Find a formula for s so thats ′ = v.(d) Based on your work in (c), what is the value of s(2) − s(0)? What is the meaning of thisquantity?⊳
92 4.1. DETERMINING DISTANCE TRAVELED FROM VELOCITYActivity 4.2.A ball is tossed vertically in such a way that its velocity function is given by v(t) = 32 − 32t,where t is measured in seconds and v in feet per second. Assume that this function is valid for0 ≤ t ≤ 2.(a) For what values of t is the velocity of the ball positive? What does this tell you aboutthe motion of the ball on this interval of time values?(b) Find an antiderivative, s, of v that satisfies s(0) = 0.(c) Compute the value of s(1) − s( 1 2). What is the meaning of the value you find?(d) Using the graph of y = v(t) provided in Figure 4.3, find the exact area of the regionunder the velocity curve between t = 1 2and t = 1. What is the meaning of the valueyou find?(e) Answer the same questions as in (c) and (d) but instead using the interval [0, 1].(f) What is the value of s(2) − s(0)? What does this result tell you about the flight of theball? How is this value connected to the provided graph of y = v(t)? Explain.ft/sec2412-12v(t) = 32 − 32t1 2sec-24Figure 4.3: The graph of y = v(t).⊳
4.1. DETERMINING DISTANCE TRAVELED FROM VELOCITY 93Activity 4.3.Suppose that an object moving along a straight line path has its velocity v (in meters per second)at time t (in seconds) given by the piecewise linear function whose graph is pictured inFigure 4.4. We view movement to the right as being in the positive direction (with positive velocity),while movement to the left is in the negative direction. Suppose further that the object’s4 m/sec 2sec-22 4 6 8-4initial position at time t = 0 is s(0) = 1.Figure 4.4: The velocity function of a moving object.(a) Determine the total distance traveled and the total change in position on the time interval0 ≤ t ≤ 2. What is the object’s position at t = 2?(b) On what time intervals is the moving object’s position function increasing? Why? Onwhat intervals is the object’s position decreasing? Why?(c) What is the object’s position at t = 8? How many total meters has it traveled to get tothis point (including distance in both directions)? Is this different from the object’s totalchange in position on t = 0 to t = 8?(d) Find the exact position of the object at t = 1, 2, 3, . . . , 8 and use this data to sketch anaccurate graph of y = s(t). How can you use the provided information about y = v(t)to determine the concavity of s on each relevant interval?⊳
94 4.2. RIEMANN SUMS4.2 Riemann SumsPreview Activity 4.2. A person walking along a straight path has her velocity in miles per hourat time t given by the function v(t) = 0.5t 3 − 1.5t 2 + 1.5t + 1.5, for times in the interval 0 ≤ t ≤ 2.The graph of this function is also given in each of the three diagrams in Figure 4.5. Note that in23 mph hrsy = v(t)213 mph hrsy = v(t)2A 1 A 2 A 3 A 41 2113 mph hrsy = v(t)B 1 B 2 B 3 B 41 2C 1 C 2 C 3 C 41 2Figure 4.5: Three approaches to estimating the area under y = v(t) on the interval [0, 2].each diagram, we use four rectangles to estimate the area under y = v(t) on the interval [0, 2], butthe method by which the four rectangles’ respective heights are decided varies among the threeindividual graphs.(a) How are the heights of rectangles in the left-most diagram being chosen? Explain, andhence determine the value ofS = A 1 + A 2 + A 3 + A 4by evaluating the function y = v(t) at appropriately chosen values and observing thewidth of each rectangle. Note, for example, thatA 3 = v(1) · 12 = 2 · 12 = 1.(b) Explain how the heights of rectangles are being chosen in the middle diagram and find thevalue ofT = B 1 + B 2 + B 3 + B 4 .(c) Likewise, determine the pattern of how heights of rectangles are chosen in the right-mostdiagram and determineU = C 1 + C 2 + C 3 + C 4 .(d) Of the estimates S, T , and U, which do you think is the best approximation of D, the totaldistance the person traveled on [0, 2]? Why?
4.2. RIEMANN SUMS 95⊲⊳
96 4.2. RIEMANN SUMSActivity 4.4.For each sum written in sigma notation, write the sum long-hand and evaluate the sum to findits value. For each sum written in expanded form, write the sum in sigma notation.(a)5∑(k 2 + 2)k=16∑(b) (2i − 1)i=3(c) 3 + 7 + 11 + 15 + · · · + 27(d) 4 + 8 + 16 + 32 · · · + 256(e)6∑i=112 i ⊳
4.2. RIEMANN SUMS 97Activity 4.5.Suppose that an object moving along a straight line path has its position in feet at time t inseconds given by v(t) = 2 9 (t − 3)2 + 2.(a) Carefully sketch the region whose exact area will tell you the value of the distance theobject traveled on the time interval 2 ≤ t ≤ 5.(b) Estimate the distance traveled on [2, 5] by computing L 4 , R 4 , and M 4 .(c) Does averaging L 4 and R 4 result in the same value as M 4 ? If not, what do you think theaverage of L 4 and R 4 measures?(d) For this question, think about an arbitrary function f, rather than the particular functionv given above. If f is positive and increasing on [a, b], will L n over-estimate or underestimatethe exact area under f on [a, b]? Will R n over- or under-estimate the exact areaunder f on [a, b]? Explain.⊳
98 4.2. RIEMANN SUMSActivity 4.6.Suppose that an object moving along a straight line path has its velocity v (in feet per second)at time t (in seconds) given byv(t) = 1 2 t2 − 3t + 7 2 .(a) Compute M 5 , the middle Riemann sum, for v on the time interval [1, 5]. Be sure toclearly identify the value of △t as well as the locations of t 0 , t 1 , · · · , t 5 . In addition,provide a careful sketch of the function and the corresponding rectangles that are beingused in the sum.(b) Building on your work in (a), estimate the total change in position of the object on theinterval [1, 5].(c) Building on your work in (a) and (b), estimate the total distance traveled by the objecton [1, 5].(d) Use appropriate computing technology 1 to compute M 10 and M 20 . What exact value doyou think the middle sum eventually approaches as n increases without bound? Whatdoes that number represent in the physical context of the overall problem?⊳1 For instance, consider the applet at http://gvsu.edu/s/a9 and change the function and adjust the locations ofthe blue points that represent the interval endpoints a and b.
4.3. THE DEFINITE INTEGRAL 994.3 The Definite IntegralPreview Activity 4.3. Consider the applet found at http://gvsu.edu/s/aw 2 . There, you willinitially see the situation shown in Figure 4.6. Observe that we can change the window in whichFigure 4.6: A left Riemann sum with 5 subintervals for the function f(x) = 31+x 2 on the interval[−5, 5]. The value of the sum is L 5 = 7.43076923.the function is viewed, as well as the function itself. Set the minimum and maximum values of xand y so that we view the function on the window where 1 ≤ x ≤ 4 and −1 ≤ y ≤ 12, where thefunction is f(x) = 2x + 1 (note that you need to enter “2*x+1” as the function’s formula). Youshould see the updated figure shown in Figure 4.7. Note that the value of the Riemann sum ofour choice is displayed in the upper left corner of the window. Further, by updating the value inthe “Intervals” window and/or the “Method”, we can see the different value of the Riemann sumthat arises by clicking the “Compute!” button.(a) Update the applet so that the function being considered is f(x) = 2x+1 on [1, 4], as directedabove. For this function on this interval, compute L n , M n , R n for n = 10, n = 100, andn = 1000. What do you conjecture is the exact area bounded by f(x) = 2x + 1 and thex-axis on [1, 4]?(b) Use basic geometry to determine the exact area bounded by f(x) = 2x + 1 and the x-axison [1, 4].(c) Based on your work in (a) and (b), what do you observe occurs when we increase thenumber of subintervals used in the Riemann sum?(d) Update the applet to consider the function f(x) = x 2 +1 on the interval [1, 4] (note that youwill want to increase the maximum value of y to at least 17, and you need to enter “xˆ2 +2 David Eck of Hobart and William Smith Colleges, author of Java Components for Mathematics,http://gvsu.edu/s/av.
100 4.3. THE DEFINITE INTEGRALFigure 4.7: A left Riemann sum with 5 subintervals for the function f(x) = 2x + 1 on the interval[1, 4]. The value of the sum is L 5 = 16.2.1” for the function formula). Use the applet to compute L n , M n , R n for n = 10, n = 100,and n = 1000. What do you conjecture is the exact area bounded by f(x) = x 2 + 1 and thex-axis on [1, 4]?(e) Why can we not compute the exact value of the area bounded by f(x) = x 2 + 1 and thex-axis on [1, 4] using a formula like we did in (b)?⊲⊳
4.3. THE DEFINITE INTEGRAL 101Activity 4.7.Use known geometric formulas and the net signed area interpretation of the definite integralto evaluate each of the definite integrals below.(a)(b)(c)(d)∫ 10∫ 4−1∫ 1−1∫ 4−33x dx(2 − 2x) dx√1 − x 2 dxg(x) dx, where g is the function pictured in Figure 4.8. Assume that each portion ofg is either part of a line or part of a circle.1y = g(x)-3 -2 -1 1 2 3 4-1Figure 4.8: A function g that is piecewise defined; each piece of the function is part of a circle orpart of a line.⊳
102 4.3. THE DEFINITE INTEGRALActivity 4.8.Suppose that the following information is known about the functions f, g, x 2 , and x 3 :• ∫ 20 f(x) dx = −3; ∫ 52f(x) dx = 2• ∫ 20 g(x) dx = 4; ∫ 52g(x) dx = −1• ∫ 20 x2 dx = 8 3 ; ∫ 51172f(x) dx =3• ∫ 20 x3 dx = 4; ∫ 52 x3 dx = 6094Use the provided information and the rules discussed in the preceding section to evaluate eachof the following definite integrals.(a) ∫ 25f(x) dx(b) ∫ 50g(x) dx(c) ∫ 50(f(x) + g(x)) dx(d) ∫ 52 (3x2 − 4x 3 ) dx(e) ∫ 05 (2x3 − 7g(x)) dx⊳
4.3. THE DEFINITE INTEGRAL 103Activity 4.9.Suppose that v(t) = √ 4 − (t − 2) 2 tells us the instantaneous velocity of a moving object on theinterval 0 ≤ t ≤ 4, where t is measured in minutes and v is measured in meters per minute.(a) Sketch an accurate graph of y = v(t). What kind of curve is y = √ 4 − (t − 2) 2 ?(b) Evaluate ∫ 40v(t) dt exactly.(c) In terms of the physical problem of the moving object with velocity v(t), what is themeaning of ∫ 40v(t) dt? Include units on your answer.(d) Determine the exact average value of v(t) on [0, 4]. Include units on your answer.(e) Sketch a rectangle whose base is the line segment from t = 0 to t = 4 on the t-axis suchthat the rectangle’s area is equal to the value of ∫ 40v(t) dt. What is the rectangle’s exactheight?(f) How can you use the average value you found in (d) to compute the total distancetraveled by the moving object over [0, 4]?⊳
104 4.4. THE FUNDAMENTAL THEOREM OF CALCULUS4.4 The Fundamental Theorem of <strong>Calculus</strong>Preview Activity 4.4. A student with a third floor dormitory window 32 feet off the ground tossesa water balloon straight up in the air with an initial velocity of 16 feet per second. It turns out thatthe instantaneous velocity of the water balloon is given by the velocity function v(t) = −32t + 16,where v is measured in feet per second and t is measured in seconds.(a) Let s(t) represent the height of the water balloon above the ground at time t, and note thats is an antiderivative of v. That is, v is the derivative of s: s ′ (t) = v(t). Find a formula fors(t) that satisfies the initial condition that the balloon is tossed from 32 feet above ground.In other words, make your formula for s satisfy s(0) = 32.(b) At what time does the water balloon reach its maximum height? At what time does thewater balloon land?(c) Compute the three differences s( 1 2 ) − s(0), s(2) − s( 1 2), and s(2) − s(0). What do thesedifferences represent?(d) What is the total vertical distance traveled by the water balloon from the time it is tosseduntil the time it lands?(e) Sketch a graph of the velocity function y = v(t) on the time interval [0, 2]. What is the totalnet signed area bounded by y = v(t) and the t-axis on [0, 2]? Answer this question in twoways: first by using your work above, and then by using a familiar geometric formula tocompute areas of certain relevant regions.⊲⊳
4.4. THE FUNDAMENTAL THEOREM OF CALCULUS 105Activity 4.10.Use the Fundamental Theorem of <strong>Calculus</strong> to evaluate each of the following integrals exactly.For each, sketch a graph of the integrand on the relevant interval and write one sentence thatexplains the meaning of the value of the integral in terms of the (net signed) area bounded bythe curve.(a)(b)(c)(d)(e)∫ 4−1∫ π20∫ 10∫ 1−1∫ 20(2 − 2x) dxsin(x) dxe x dxx 5 dx(3x 3 − 2x 2 − e x ) dx⊳
106 4.4. THE FUNDAMENTAL THEOREM OF CALCULUSgiven function, f(x)antiderivative, F (x)k, (k ≠ 0)x n , n ≠ −11x , x > 0sin(x)cos(x)sec(x) tan(x)csc(x) cot(x)sec 2 (x)csc 2 (x)e xa x (a > 1)11+x 2√ 11−x 2Activity 4.11.Table 4.1: Familiar basic functions and their antiderivatives.Use your knowledge of derivatives of basic functions to complete the above table of antiderivatives.For each entry, your task is to find a function F whose derivative is the given functionf. When finished, use the FTC and the results in the table to evaluate the three given definiteintegrals.(a)(b)(c)∫ 10∫ π/30∫ 10(x 3 − x − e x + 2 ) dx(2 sin(t) − 4 cos(t) + sec 2 (t) − π) dt( √ x − x 2 ) dx⊳
4.4. THE FUNDAMENTAL THEOREM OF CALCULUS 107Activity 4.12.During a 30-minute workout, a person riding an exercise machine burns calories at a rate ofc calories per minute, where the function y = c(t) is given in Figure 4.9. On the interval 0 ≤t ≤ 10, the formula for c is c(t) = −0.05t 2 + t + 10, while on 20 ≤ t ≤ 30, its formula isc(t) = −0.05t 2 + 2t − 5.15cal/miny = c(t)10510 20 30minFigure 4.9: The rate c(t) at which a person exercising burns calories, measured in calories perminute.(a) What is the exact total number of calories the person burns during the first 10 minutesof her workout?(b) Let C(t) be an antiderivative of c(t). What is the meaning of C(30) − C(0) in the contextof the person exercising? Include units on your answer.(c) Determine the exact average rate at which the person burned calories during the 30-minute workout.(d) At what time(s), if any, is the instantaneous rate at which the person is burning caloriesequal to the average rate at which she burns calories, on the time interval 0 ≤ t ≤ 30?⊳