2012-2013 Fact Book - Berea College
2012-2013 Fact Book - Berea College
2012-2013 Fact Book - Berea College
- No tags were found...

You also want an ePaper? Increase the reach of your titles
YUMPU automatically turns print PDFs into web optimized ePapers that Google loves.
FACT BOOKINTRODUCTIONTo Our Readers:We are pleased to present this year’s <strong>Berea</strong> <strong>College</strong> <strong>Fact</strong> <strong>Book</strong>. Its purpose is to provide currentand accurate information pertaining to the <strong>College</strong>, its students, faculty, programs, facilities, andactivities.Most of the information included in the <strong>Fact</strong> <strong>Book</strong> is provided by various <strong>College</strong> offices. Theassistance and cooperation we receive from individuals in these offices is very much appreciated.We have included the following new information this year: Externally Sponsored Programs, pg. 8 Federally-Funded Educational Outreach Programs, pgs. 9-10In addition to these new pages, there is a “Word to the Faculty and Staff of <strong>Berea</strong> <strong>College</strong>” fromour new president, Dr. Lyle D. Roelofs.We hope that you find this year's <strong>Fact</strong> <strong>Book</strong> both informative and useful. Please let us know howwe can improve it. For more details and other reports, please visit our website atwww.berea.edu/ira.Judith Weckman, Director of the Office of Institutional Research and AssessmentClara Labus Chapman, Assistant Director (Labor Team Supervisor)Gladys Kamau, Student Coordinator of the <strong>Fact</strong> <strong>Book</strong><strong>Berea</strong> <strong>College</strong>Office of Institutional Research and AssessmentCPO 2177<strong>Berea</strong>, Kentucky 40404(859) 985-3790
A WORD TO THE FACULTY AND STAFF OF BEREA COLLEGEFrom the PresidentI am pleased to provide you with this collection of information that comprises a very detailedand fine-grained characterization of <strong>Berea</strong> <strong>College</strong>. I am most grateful to the Office ofInstitutional Research and Assessment for the good work of assembling it.<strong>Berea</strong> <strong>College</strong> has always been a place where deep commitments have been translated intocompassionate action in the service of young women and men, black and white, from manycultures, primarily from the Appalachian region but also far beyond. <strong>Berea</strong>’s distinctive andmultifaceted mission has always been and will remain firmly rooted in inclusive Christianvalues such as “the triumph of love over hate, human dignity and equality, and peace withjustice.” Such a drive led <strong>Berea</strong> to be the first interracial and coeducational college in thepre-Civil War South. <strong>Berea</strong>’s primary mission is to serve students of “great promise andlimited economic means” by providing them with liberal arts and professional educations ofthe highest quality. Thus, all students receive a substantial cost-of-education scholarship sothat no money from student families is required for tuition. <strong>Berea</strong>’s educational communityis predicated on the notion that work of all kinds, mental and physical, provides opportunitiesfor furthering a student’s education and personal development. Therefore, all students workin a campus-based labor department. Just as one of our institutional goals is to serve others,so too we seek to prepare our students to be “service-oriented leaders for Appalachia andbeyond” (Being and Becoming: <strong>Berea</strong> <strong>College</strong> in the 21st Century, 2011, p. 34). Learning,labor, and service, then, are the three foundational pillars of <strong>Berea</strong>’s educational edifice.<strong>Berea</strong>’s motto, included in the original catalog from 1866 and still proclaimed today isreflective of the Christian values that inspired our founding and determined our mission andidentity, “God has made of one blood all peoples of the earth” (Acts 17:26).Today the <strong>Berea</strong> <strong>College</strong> educational experience combines formal instruction in theclassroom, learning opportunities in the Labor Program, guidance for spiritual development,and opportunities for service and outreach. This integrated and multi-faceted understandingof our education program has been articulated in the form of four pairs of Common LearningGoals for all students and workers at the <strong>College</strong>. These are set forth in Being and Becomingas follows:1. Develop the critical intellectual ability to address complex problems frommultiple perspectives and nurture moral growth with a commitment toservice;2. Understand the relationship between humans and the natural world andconsider both the benefits and limitations of science and technology;3. Explore our own individual roots and our shared American culture and knowand respect cultures from around the world;4. Educate students, faculty, and staff to be creative, independent thinkers andencourage collaboration and teamwork in learning and working (Being andBecoming, p. v; see pp 56-60 for a detailed discussion of each learning goal).These four sets of learning goals represent an application of the Great Commitments withinthe context of our contemporary world.
A Word to the Faculty and Staff of <strong>Berea</strong> <strong>College</strong>, continued<strong>Berea</strong> <strong>College</strong> offers an exceptional instructional program to its students. Beyond that,faculty, staff and students have the opportunity of intentional participation in a learningcommunity. I urge you to see your work and yourself in that context. I hope and expectthat you will support your colleagues, faculty and staff alike, as we partner in providing atransformative educational experience for all our students. I hope equally that you willenjoy in return everything you learn and gain from your colleagues. Our students, bothwhen they are on campus and later when they are in the world as <strong>Berea</strong> graduates, arealso members of our learning community and they and we will benefit to the extent thatthey come to understand this.In this my first year as the 9 th President of <strong>Berea</strong>, I am so very happy to join you, mydevoted colleagues, in our work to advance this special place.Lyle D. RoelofsPresidentOctober <strong>2012</strong>
THE GREAT COMMITMENTS OF BEREA COLLEGE<strong>Berea</strong> <strong>College</strong>, founded by ardent abolitionists and radical reformers, continues today as aneducational institution still firmly rooted in its historic purpose "to promote the cause of Christ."Adherence to the <strong>College</strong>'s scriptural foundation, "God has made of one blood all peoples of theearth," shapes the <strong>College</strong>'s culture and programs so that students and staff alike can worktoward both personal goals and a vision of a world shaped by Christian values, such as thepower of love over hate, human dignity and equality, and peace with justice. This environmentfrees persons to be active learners, workers, and servers as members of the academiccommunity and as citizens of the world. The <strong>Berea</strong> experience nurtures intellectual, physical,aesthetic, emotional, and spiritual potentials and with those the power to make meaningfulcommitments and translate them into action.To achieve this purpose, <strong>Berea</strong> <strong>College</strong> commits itself:• To provide an educational opportunity primarily for students from Appalachia, black andwhite, who have great promise and limited economic resources.• To provide an education of high quality with a liberal arts foundation and outlook.• To stimulate understanding of the Christian faith and its many expressions and to emphasizethe Christian ethic and the motive of service to others.• To provide for all students through the labor program experiences for learning and serving incommunity, and to demonstrate that labor, mental and manual, has dignity as well as utility.• To assert the kinship of all people and to provide interracial education with a particularemphasis on understanding and equality among blacks and whites.• To create a democratic community dedicated to education and equality for women and men.• To maintain a residential campus and to encourage in all members of the community a wayof life characterized by plain living, pride in labor well done, zest for learning, high personalstandards, and concern for the welfare of others.• To serve the Appalachian region primarily through education but also by other appropriateservices.For more details, please visit: http://www.berea.edu/about/mission/Originally adopted by the Board of Trustees in 1969; this revised statement adopted by the Board ofTrustees of <strong>Berea</strong> <strong>College</strong>, <strong>Berea</strong>, Kentucky, April 24, 19931
ACCREDITATION<strong>Berea</strong> <strong>College</strong> is accredited in its awarding of baccalaureate degrees by the Commission on <strong>College</strong>s ofthe Southern Association of <strong>College</strong>s and Schools (SACS). The <strong>College</strong> is also accredited by theCommission on Collegiate Nursing Education for the preparation of nurses and the Nursing program hasapproval status from the Kentucky Board of Nursing. In addition, the <strong>College</strong> is accredited by the NationalCouncil for the Accreditation of Teacher Education (NCATE) for the preparation of elementary, middle,and secondary school teachers with the bachelor's degree as the highest degree approved.<strong>Berea</strong> <strong>College</strong> is an institutional member of:INSTITUTIONAL MEMBERSHIPSAmerican Academy of Family Physicians (AAFP)American Association of <strong>College</strong>s for Teacher Education (AACTE)American Association of <strong>College</strong>s of Nursing (AACN)American Association of University Women (AAUW)*American Automobile Association (AAA)American Chestnut FoundationAmerican Council on Education (ACE)American Forest Foundation/American Tree Farm SystemAmerican Institute of Chemical EngineersAmigos Library ServicesAnnapolis GroupAppalachian <strong>College</strong> Association (ACA)Asian NetworkAssociation for the Advancement of Sustainability in Higher Education (AASHE)Association for the Study of African American Life and History (ASAALH)Association of American <strong>College</strong>s and Universities (AAC&U)Association of <strong>College</strong> and University Auditors (ACUA)Association of <strong>College</strong> and University Printers (ACUP)Association of Collegiate Conference and Events Directors International (ACCED-I)Association of Energy EngineersAssociation of Governing Boards of Universities (AGB)Association of Heating, Refrigeration, and Air Conditioning Engineers (ASHRAE)Association of Independent Kentucky <strong>College</strong>s and Universities (AIKCU)Association of Independent Liberal Arts <strong>College</strong>s for Teacher Education (AILACTE)Association of Physical Plant Administrators (APPA)<strong>Berea</strong> Chamber of Commerce<strong>College</strong> and University Mail Services Association (CUMSA)<strong>College</strong> and University Professional Association for Human Resources (CUPA-HR)Commonwealth of Kentucky (KY Virtual Library)Council for Higher Education Accreditation (CHEA)Council for the Advancement and Support of Education (CASE)Council of Independent <strong>College</strong>s (CIC)Council on Library and Information ServicesCraft Organization Development AssociationCraftNet AssociationGreen Hotel AssociationHigher Education Data Sharing (HEDS) Consortium* Alumnae are eligible for membership in the American Association of University Women (AAUW).Source: <strong>Berea</strong> <strong>College</strong> Catalog and Student Handbook, <strong>2012</strong>–<strong>2013</strong>Office of the President, January <strong>2013</strong>2
Institutional Memberships, continuedHistorical Hotel AssociationInternational Association of Campus Law Enforcement Administration (IACLEA)International Society of ArboricultureKentucky Academy of Science (KAS)Kentucky Association of <strong>College</strong>s for Teacher Education (KACTE)Kentucky Campus CompactKentucky Chapter – American Academy of Family Physicians (KAFP)Kentucky <strong>College</strong> Health AssociationKentucky Council of Postsecondary EducationKentucky CraftedKentucky Guild of Artists and CraftsmenKentucky Hotel and Lodging AssociationKentucky Institute for International Studies (KIIS)Kentucky Intercollegiate Athletic Conference (KIAC)Kentucky League for NursingKentucky Restaurant AssociationKentucky Society of Association ExecutivesKentucky Woodland Owners Association/National Woodland Owners AssociationLOEX (Eastern Michigan University)Lyrasis (Online Computer Library Center – Solinet)Midwest Association of Student Employment Administrators (MASEA)National Association for <strong>College</strong> Activities (NACA)National Association for Intercollegiate Athletics (NAIA)National Association of <strong>College</strong> and University Attorneys (NACUA)National Association of <strong>College</strong> and University Business Officers (NACUBO)National Association of <strong>College</strong> StoresNational Association of Educational Procurement (NAEP)National Association of Independent <strong>College</strong>s and Universities (NAICU)National Council for the Accreditation of Teacher Education (NCATE)National Fire Protection Association (NFPA)National Intramural Recreation Sports Administration (NIRSA)National Student Employment Administrators (NSEA)Oak Ridge Associated Universities (ORAU)Project Pericles, Inc.Rotary ClubSecond NatureSmith Travel ResearchSociety of American ForestersSociety of <strong>College</strong> and University Planners (SCUP)Society of Government Meeting ProfessionalsSouthern Association of <strong>College</strong>s and Schools (SACS)Southern Highland Craft GuildSouthern University Conference (SUC)Tennessee Motor Coach AssociationThe <strong>College</strong> BoardThe Tuition Exchange, Inc.Tuition Exchange Program, CICUnited States Green Building Council (USGBC)University Leaders for a Sustainable Future (ULSF)University Risk Management and Insurance Association (URMIA)Work <strong>College</strong>s Consortium (WCC)Source: Office of the President, January <strong>2013</strong>3
ACADEMIC INFORMATIONPrograms of Study<strong>Berea</strong> <strong>College</strong>’s curriculum offers the advantage of interdisciplinary general study coupled with intensivestudy within a major field (some of which have multiple concentrations). <strong>Berea</strong> operates on a two fifteenweekterm academic calendar consisting of required Fall and Spring terms. To maintain satisfactoryacademic progress, students normally enroll in four course credits in each of these terms. There are alsooptional Summer opportunities to engage in study. Students may take between 1 and 2.25 credits duringSummer. One <strong>Berea</strong> course credit is equivalent to four semester hours (6 quarter hours).Most degree programs require a minimum of 32 earned course credits; the Nursing Program typicallyrequires a minimum of 34 earned course credits, with at least 20 courses taken outside the majordiscipline.Bachelor of Arts Degree Programs:African and African American Studies Economics PhysicsApplied Science and Mathematics Education Studies Political ScienceArt English PsychologyAsian Studies French ReligionBiology German SociologyChemistry History SpanishChild and Family Studies Mathematics TheatreClassical Languages (not currently offered) Music Women’s and GenderCommunication Philosophy StudiesComputer and Information SciencePhysical EducationBachelor of Science Degree Programs:Agriculture and Natural ResourcesBusiness AdministrationNursingTechnology and Applied DesignIndependent majors are also available. These majors are designed by students who wish to pursue a fieldof study that cannot be met through an established <strong>Berea</strong> <strong>College</strong> major program. Students are free topropose majors. Some examples of previously approved independent majors are: Appalachian Studies,Classical Studies or Classical Civilizations, Peace and Social Justice Studies, and Sustainable CommunityDevelopment.Teacher Preparation:<strong>Berea</strong> <strong>College</strong> offers certification programs in Elementary Education (primary – grade 5); Middle GradesEducation with Teacher Certification in Science or Mathematics (grades 5-9); Secondary Education(grades 8-12) programs in Biology, Chemistry, English, Mathematics, Physics, and Social Studies (withmajors in History, Political Science, and Sociology); primary through grade 12 programs in Art, Health,Instrumental Music, Vocal Music, and Physical Education; and a grades 5-12 program in TechnologyEducation.Minor Programs Offered:African and African American Studies Economics PhilosophyAgriculture and Natural Resources English PhysicsAppalachian Studies Film Political ScienceArt History French ReligionArt: Studio German SociologyAsian Studies Health Studies SpanishBroadcast Journalism Health Teaching Sustainability andBusiness Administration History Environmental StudiesCommunication Latin TheatreComputer Science Music Women’s and GenderDance Peace and Social Justice Studies StudiesSource: <strong>Berea</strong> <strong>College</strong> Catalog and Student Handbook, <strong>2012</strong> – <strong>2013</strong>4
THE STUDENT LABOR PROGRAMThe Student Labor Program originated in its earliest form at <strong>Berea</strong> <strong>College</strong> in 1859 and expanded tobecome one of the <strong>College</strong>’s Great Commitments providing economic, educational, social, personal,and spiritual benefits to students and those served by their work.The Labor Program is designed to:Support the total educational program at <strong>Berea</strong> <strong>College</strong> through experiences providing thelearning of skills, responsibility, habits, attitudes, and processes associated with work;Provide and encourage opportunities for students to pay costs of board, room, and relatededucational expenses;Provide staff for <strong>College</strong> operations;Provide opportunities for service to the community and others through labor;Establish a life-style of doing and thinking, action and reflection, service and learning thatcarries on beyond the college years.The Student Labor Program’s unifying vision is based on an understanding and expectation of laboras student and learning centered; as service to the <strong>College</strong> and broader community, and as providingnecessary work (i.e., work that needs to be done) being done well. The Student Labor Programsystematically and consistently employs this vision to address tensions that may occasionally emergebetween student labor as work that needs to be done, as service to the community and <strong>College</strong>, asstudent’s experiential learning, and as contribution to educational costs, etc. The administration ofthe program is the responsibility of the Dean of Labor.Labor assignments function very much like classes. Beginning at basic levels of work, students areexpected to progress to more skilled and responsible levels. Through these experiences, it isexpected that student workers will 1) develop good work habits and attitudes, 2) gain anunderstanding of personal interests, skills, and limitations, and 3) exercise creativity, problem-solving,and responsibility. Students may also learn the qualities of leadership, standard setting, and effectivesupervision.The Labor Program makes it possible for students to know each other as co-workers as well asclassmates. More importantly, linking the Academic and Labor Programs establishes a pattern oflearning through work that continues long after college.For a complete list of all labor departments in which students work, see pages 97 and 98.Source: <strong>Berea</strong> <strong>College</strong> Catalog and Student Handbook, <strong>2012</strong> – <strong>2013</strong>5
THE CONVOCATION SERIESThe Convocation Series is a vital component of <strong>Berea</strong>’s General Education Program. Through theConvocation Series, notable speakers, scholars, performers, and programs present on a variety ofsubjects to enlarge the intellectual, aesthetic, and religious dimensions of campus life. In addition,<strong>Berea</strong>’s student performing ensembles provide convocations addressing similar issues throughmusic, dance, and theatre. Providing rich experiences for students, faculty, and staff alike,convocations help build and sustain a sense of curiosity and intellectual challenge so basic in anacademic community. They make available information and insights on important topics likely to beconsidered in academic courses.All students will be enrolled automatically in a 1/4-credit Convocation course (CNV 100) during eachof their regular terms of in-residence enrollment, with the exception of the final term of enrollment, fora maximum of eight such terms. For each term of enrollment in CNV 100, the student will earn agrade of CA (which is calculated as an A in the GPA) for receiving seven convocation credits. Thegrade of CF (which is calculated as an F in the GPA) will be awarded given if one receives fewer thanseven convocation credits. Enrollment in this course is optional during the final term at <strong>Berea</strong> (or isprohibited if the student already has enrolled in this course for eight terms).Convocation credits only count in the GPA and not in the minimum earned credits required forgraduation.Source: <strong>Berea</strong> <strong>College</strong> Catalog and Student Handbook, <strong>2012</strong> - <strong>2013</strong>6
CLUBS AND ORGANIZATIONSACADEMIC YEAR <strong>2012</strong> – <strong>2013</strong>African Students Association (ASA)Agricultural Union (AU)Alpha Psi OmegaAppalachian CenterAsian Student Union (ASU)Baptist Campus Ministry<strong>Berea</strong> <strong>College</strong>..Anime and Manga ClubAssociation of Student Nurses (BCASN)Billiards LeagueConcert ChoirRepublicansWomen’s Chorus<strong>Berea</strong> Middle Eastern Dance (BMED)<strong>Berea</strong> Ultimate Frisbee<strong>Berea</strong>ns for Appalachia (BFA)Black Cultural Center (BCC)Black Music Ensemble (BME)Black Student Union (BSU)Buddhist Student Association (BSA)Campus Activities Board (CAB)Center for Excellence in Learningthrough Service (CELTS)First <strong>Book</strong>-Madison CountyHabitat for HumanityHEALHispanic Outreach Program (HOP)People Who CareChi AlphaCosmopolitan ClubCountry DancersDanish Gymnastics ClubDelta Tau AlphaEnglish ClubEpiscopal Canterbury FellowshipE.Y.C.E. (pep club)Fine, Young, and Hypnotic (FYAH) Dance TeamFighting Rape Through Education andEncouragement (FREE)Gay-Straight Alliance (GSA)German ClubHispanic Student Association (HSA)IntervarsityIntramuralsInvisible ChildrenMen Advocating Awareness of Rape andSexual Assault (MARS)Modern Dance TroupeMortar Board Honor SocietyMuslim Student Association (MSA)Newman ClubOxfam America at <strong>Berea</strong> <strong>College</strong>Pagan CoalitionPhi Kappa PhiPhysical Education Majors (PEM) ClubPhysics ClubPre-Med/Dental ClubPsychology Club/Psi ChiSigma Tau DeltaStudent Affiliates of the AmericanChemical Society (SAACS)Student Government Association (SGA)Freshman ClassSophomore ClassJunior ClassSenior ClassStudents for a Free TibetStudents in Free Enterprise (S.I.F.E.)Swing ClubTechnology ClubYoung DemocratsZachary Sieben Association of Primitive Arts andTechnologySource: <strong>Berea</strong> <strong>College</strong> Campus Life Website, as of September <strong>2012</strong>7
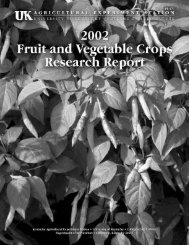
EXTERNALLY SPONSORED PROGRAMSSince the 1870s, <strong>Berea</strong> <strong>College</strong> has served the Appalachian region by providing outreach services tomountain communities as well as a college education for its young people. We are able to address regionalneeds that fall within the <strong>College</strong>’s Great Commitments by “providing educational opportunities forstudents from Appalachia, black and white, who have great promise and limited economic resources,” and“by serving the Appalachian region primarily through education but also by other appropriate services.” Inthe past 45 years the <strong>College</strong> has been able to expand our work in Appalachian Kentucky with the use offederal grants.The Higher Education Act of 1965 provided the <strong>College</strong> with opportunities to provide new programs toserve the region. With funding from the new federal Office of Economic Opportunity (OEO), <strong>Berea</strong> <strong>College</strong>developed a pilot program called Project Torchlight, which served 200 students at risk of dropping out ofhigh school. The following year OEO provided funding for an Upward Bound program, one of the TRIOprograms currently administered by the U.S. Department of Education. Our Upward Bound program hasserved local area high school students continually since 1967. Between 1990 and 1999, the <strong>College</strong>increased its educational outreach with grants for two additional federal TRIO programs, EducationalTalent Search and an Upward Bound Math and Science Center. In 1999, the <strong>College</strong> received its firstGaining Early Awareness and Readiness for Undergraduate Programs (GEAR UP) partnership grant toserve the Rockcastle County School System. In the past decade the <strong>College</strong> has identified federalresources to build on the work of TRIO and the first GEAR UP.In 2011-<strong>2012</strong>, <strong>Berea</strong>’s federal funding provided services primarily in the region of Appalachian Kentuckyhighlighted in the map below.Source: Office of Externally Sponsored Programs, December <strong>2012</strong>8
FEDERALLY-FUNDED EDUCATIONAL OUTREACH PROGRAMS<strong>Berea</strong> <strong>College</strong> administers many federally-funded educational outreach programs. The following is alist that includes the program, an overview of the program, services provided through that program, aswell as the scope of the program.<strong>Berea</strong> <strong>College</strong> Promise Neighborhood InitiativeThis grant defines Clay, Jackson, and Owsley counties as a rural neighborhood and supports acontinuum of services for youth from cradle-to-career. Services provided include: partnering withorganizations to provide workshops; public health initiatives; community safety programs; educationalsupport for early childhood, K-12, and college learners. This 5-year grant includes $30 million infederal funds and $15 million in non-federal matching funds.Brushy Fork Institute (BFI) – Appalachian Regional CommissionAppalachian Rural Development Philanthropy InitiativeThis grant funds a collaborative effort of BFI and four additional organization to support structures andsustainability of philanthropic development in distressed Kentucky communities. This 3 ½ year grantprovides $171,750 in federal funds and $43,160 in non-federal matching funds.Flex-E-Grants and Training for Distressed Kentucky CommunitiesThis grant provides support planning for community-based economic development to build sustainablelocal economies. Three separate grants span 2-year periods between July 2010 and March 2014 andprovide a total of $1,629,350 in federal funds and $455,025 in non-federal matching funds.GEAR UP Appalachia!This grant follows a cohort of students from 6 th grade to their freshman year in college and emphasizesacademic success, career preparation, and building a college-going culture in schools. Servicesprovided include: in-school tutoring; summer programs; career exploration; test preparation; collegevisits; career site visits; mentoring; educator professional development; parent activities; and Familiesand Schools Together (FAST) programs. This 7-year grant provides $34 million in federal funds and$34 million in non-federal matching funds and serves 6,864 students.Investing in Innovation/i3Partnering with AdvanceKentucky, this program supports increased classroom rigor through teachertraining and expansion of Advanced Placement (AP) enrollment. The program also works towardimproved test scores. Services provided include: laying the foundation training for middle and highschool AP and pre-AP teachers; AP test preparation; high school academic counseling; collegepreparatory counseling for families. This 5-year program provides $3 million in federal funds and$541,000 in non-federal matching funds.Office of Juvenile Justice and Delinquency PreventionStrategically enhancing the rural scholars mentoring program, this grant emphasizes parentpartnerships and provides interventions for students and their families. Services provided include:student and parent leadership conferences; mentoring; parent partnership events; FAST program; andscholar meetings. This 3-year program provides $499,947 and targets 75 students at risk of coming incontact with the juvenile justice system in select Kentucky counties.Office of Violence against Women (OVW)/ STEPPartnering with Promise Neighborhood, the grant works to prevent domestic violence, dating violence,sexual assault, and stalking in secondary schools. Services provided include: currently conductingneeds assessment; proposed activities include student and family prevention classes, counseling andeducation. OVW/STEP works through the Clay, Jackson, and Owsley county school systems toaddress specific non-academic risk factors for students and to increase youth safety.Source: Office of Externally Sponsored Programs, December <strong>2012</strong>9
Federally-Funded Educational Outreach Programs, continuedPromise Neighborhood GEAR UPThis grant follows a cohort of students from 6 th grade to their freshman year in college and emphasizescollege readiness through academic success and the building of a college-going culture and includesservices for elementary students. Services provided include: in-school tutoring; summer programs;career exploration; test preparation; college visits; career site visits; mentoring; educator professionaldevelopment; parent activities; Families and Schools Together (FAST) programs, and elementary-agedprogramming. This 7-year grant provides $39 million in federal funds and $39 million in non-federalmatching funds. The program serves 7,793 students.The Rural Scholars ProgramSupporting the work of Promise Neighborhood, this grant provides “Middle School <strong>College</strong> Coaches” inschools to improve college readiness, academic support, and parent engagement. Services providedinclude: intensive mentoring; guidance developing individual graduation plans; participation in theFamilies and Schools Together (FAST) program. This program serves a target group of at-risk studentsin Clay, Jackson, and Owsley counties. Funding is $500,000 for 2 years.TRIO – Educational Talent SearchThis program provides school-based academic counseling and career exploration activities and focuseson college preparatory support for qualifying students in grades 8-12. Services provided include: highqualitytutoring; academic, career, and financial aid counseling; college visits; cultural field trips; andcareer site visits. This 4-year grant provides $1,405,867 for primarily school-based services for lowincomeand first-generation students in three counties and serves 800 students per year.TRIO – Student Support Services – (Emerging Scholars Program)This program’s mission is to provide a support system that assists <strong>Berea</strong> <strong>College</strong> students in achievingacademic, personal, financial, social, and career planning goals. Each student will work one-on-onewith a Student Engagement Specialist to develop an Educational Action Plan designed to specificallyaddress academic, personal, financial, social, and career planning needs of that student. This 5-yeargrant provides $1,100,000.TRIO – Upward BoundThis program provides high quality college preparatory experiences for 9 th -12 th grade students whomeet eligibility requirements. Services provided include: intensive academic summer programs at<strong>Berea</strong> <strong>College</strong>; college visits; cultural field trips; ACT preparation; financial aid and college applicationassistance. This 4-year grant provides $2,360,220 for intensive services for low-income and firstgenerationstudents in select counties. It serves 92 students per year.TRIO – Upward Bound Math and Science Carter G. Woodson InstituteThis program provides high quality college preparatory experiences for students from 9 th -12 th gradeswith an aptitude for math and science. Services provided include: intensive academic summerprograms at <strong>Berea</strong> <strong>College</strong>; college visits; cultural field trips; ACT preparation; financial aid and collegeapplication assistance. This 4-year grant provides $1,242,250 and focuses on low-income and firstgenerationstudents in select counties with an aptitude for math and science and serves 50 students peryear.Women’s Equity in Education ActThis grant provides an academic support program for young women who excel in math and science, butare at risk of not meeting their potential. Services provided include: career exploration trips andactivities; in-school mentoring and support; college preparation assistance; college visits; familyengagement activities. This 3-year program provides $438,276 and targets 75 at-risk Appalachian andAfrican-American females with aptitude in math and science in select Kentucky counties.NOTE: In addition to the grants listed, four faculty members have also secured three federal grants: National Endowment for the Humanities “Enduring Questions” ($25,000 through May 2015) –2faculty members. National Science Foundationo Grant duration of May 2010 – April 2014o 4-year grant from September 2011 – August 2014 ($208,482)10
Vicki E. AllumsVirginiaCharlotte F. BeasonKentuckyVance BladeKentuckyNancy E. BlairConnecticutJoseph John BridyNew YorkLynne Blankenship CaldwellVirginiaScott CaldwellGeorgiaDavid H. ChowConnecticutM. Elizabeth CulbrethNorth CarolinaChella DavidMinnesotaJohn E. FlemingOhioBOARD OF TRUSTEES*Jerry B. HaleTennesseeDonna S. HallKentuckyRobert F. HawksGeorgiaScott M. JenkinsPennsylvaniaGlenn R. JenningsKentuckyShawn C.D. JohnsonMassachusettsBrenda Todd LarsenSouth CarolinaEugene Y. Lowe, Jr.IllinoisHarold L. MosesTennesseeDouglas M. OrrNorth CarolinaThomas W. PhillipsTennesseeWilliam B. RichardsonKentuckyLyle D. Roelofs**KentuckyDennis R. RoopColoradoCharles Ward Seabury, IICaliforniaDavid E. SheltonNorth CarolinaTyler S. ThompsonKentuckyDawneda F. WilliamsVirginiaRobert T. YahngCaliforniaStephanie B. ZeiglerConnecticutJohn Alden AuxierTennesseeJames T. BartlettMassachusettsJack BuchananKentuckyMartin A. CoyleCaliforniaHonorary TrusteesFrederic L. Dupree, Jr.KentuckyAlice R. ManicurMarylandElissa May-PlattnerKentuckyThomas H. OliverSouth CarolinaKroger PettengillOhioDavid S. SwansonMaineDavid O. WelchKentuckyR. Elton WhiteFlorida*Current as of January <strong>2013</strong>. Changes in Board composition will be recorded on the followingweb page, .**President of the <strong>College</strong>Source: Office of the President.11
12ADMINISTRATIVE ORGANIZATIONOversight of <strong>College</strong>Businesses and AuxiliariesBoone Tavern<strong>College</strong> <strong>Book</strong> StoreDining ServicesStudent Crafts ProgramAdministrative OperationsPeople Services<strong>College</strong> Post OfficeConference ServicesPrinting ServicesProperty and Resource Mgt.Campus FacilitiesCapital Project Planningand ExecutionForest ManagementCommercial and Residential RentalsBusiness and Property DevelopmentEnvironmental Healthand SafetyFacilities Oversight Management of Finance Office and FunctionsControllerFinancial PlanningEstates/TrustsFinancial ReportsGeneral Accounting Accounts PayablePurchasingTax ReportingDebt Management Cash ManagementEndowment and Investment OversightAnnual Budget PreparationConcessions/VendingInsurance LiaisonExternally Funded ProgramsTRIO and Special ProgramsGEAR UPLocal Governmental,Community, andBusiness RelationsChief Sustainability OfficerEnergy ManagementEnvironmental Health and SafetySustainability Policies andStrategy DevelopmentEstablishment of Goals,Assessment and MonitoringCurriculum CollaborationVicePresidentforOperations andSustainabilityAppalachian FundARCT OversightCampus Christian CenterInformation Systems and ServicesComputer ServicesMedia ServicesTelephone ServicesInstitutional Research and Assessment(OIRA)Legal Affairs and Secretary of the BoardLegal CounselInternal AuditRisk ManagementTitle VII and Title IX OversightAlumni RelationsDevelopment<strong>Berea</strong> FundFoundationsGift PlanningIntegrated Marketing andCommunicationsMedia RelationsCommunications andMarketingWeb and e-communicationsVicePresidentforFinanceVice Presidentfor Alumni and<strong>College</strong>RelationsPresidentPresidentAthleticsVicePresidentfor Labor andStudent LifeAcademicVicePresidentandDean of theFacultyLabor ProgramLabor DepartmentsWorkplace DevelopmentStudent PaymentsSupervisor TrainingHealth ServiceCounseling and Disabilities ServicesRecreation and IntramuralsAcademic DivisionsCurriculum Oversight andOperational SupportFaculty Hiring and ReviewFaculty DevelopmentHutchins LibrarySeabury CenterScientific Instrumentation &Electronic RepairAdmissionsFinancial AidStudent Life CollegiumEcovillageResidence Life and HousingStudent Leadership DevelopmentStudent OmbudsmanCrossroads Complex ServicesCampus LifeClubs and OrganizationsPublic SafetyMotor PoolAssociate Vice President for Academic AffairsOffice of Academic ServicesFirst-Year ExperiencePost-Tenure ReviewSabbatical ReviewUndergraduate Research and Creative ProjectsCenter for Transformative LearningCareer DevelopmentInternshipsPeer ConsultationScholarship of Teaching and LearningLoyal Jones Appalachian CenterCarter G. Woodson Center for Interracial EducationBlack Cultural CenterCenter for Excellence in Learning through ServiceFrancis & Louise Hutchins Center for International EducationField Laboratories:Child Development Laboratories<strong>College</strong> FarmsDean of Curriculum and Student LearningAdvisingGeneral EducationConvocationsStudent Service CenterDirector of Academic AssessmentPARsDivisional Self-StudiesPreparation for SACS ReaffirmationCollaboration with OIRASource: Office of the President (Revised February 5, <strong>2013</strong>)
CENTRAL ADMINISTRATIVE OFFICERSLyle D. RoelofsPresidentChad BerryAcademic Vice President and Dean of the FacultyJeff AmburgeyVice President for FinanceMichelle JanssenVice President for Alumni and <strong>College</strong> RelationsSteve KarcherVice President for Operations and SustainabilityGail WolfordVice President for Labor and Student LifeJudge B. Wilson IIGeneral Counsel and Secretary of the <strong>College</strong>13
ACADEMIC DIVISION CHAIRPERSONS, PROGRAM COORDINATORS, AND DIRECTORSACADEMIC YEAR <strong>2012</strong>- <strong>2013</strong>Division IChairperson: Ron RosenProgramBiologyChemistryMathematicsNursingPhysicsCoordinatorDawn AndersonMatt SaderholmJames Blackburn-LynchCarol KirbyTracy HodgeDivision IIChairperson: Jan PearceProgram Coordinator DirectorAgriculture and Natural Resources Mike Panciera Farm: Sean Clark (Fall)Mike Panciera (Spring)Computer and Information Science Jan PearceEconomics and BusinessEd McCormackSustainability and Environmental Studies Nancy GiftTechnology and Applied DesignAlan MillsDivision IIIChairperson: Janice BlytheProgram Coordinator DirectorChild and Family Studies Katrina Rivers Thompson Child DevelopmentLab: Wilma ChambersPhysical Education and HealthStephanie WoodiePsychologySociologyDave Porter (Interim)Jackie Burnside (Fall)Jill Bouma (Spring)Division IVChairperson: Rick MeadowsProgram Coordinator DirectorCommunicationBilly WootenEnglishBeth Crachiolo (Fall)Steve Pulsford (Spring)Foreign LanguagesJeanne HochMusic Steve Bolster Music: Mark CalkinsTheatre Shan Ayers Theatre: Shan AyersDivision VChairperson: Bob HoagProgram Coordinator DirectorArt and Art HistoryEileen McKiernan Gonzalez Visual Arts: Lisa KrinerAsian StudiesJeff RicheyHistoryRob FosterPhilosophyEric PearsonPolitical ScienceJohn HeyrmanReligionJeff PoolDivision VIChairperson: Meta Mendel-ReyesProgramAfrican and African American StudiesAppalachian StudiesEducation StudiesPeace and Social Justice StudiesWomen’s and Gender StudiesCoordinatorsAndrew BaskinChris GreenBobby StarnesMichelle TooleyPeggy Rivage-SeulSource: Office of the Academic Vice President and Dean of the Faculty, January <strong>2013</strong>14
CAMPUS GOVERNANCEThe campus governance structure allows for the inclusion and participation at various levels for allemployees of the <strong>College</strong>. Avenues for participation in decision-making include: communication andsharing information, consultation, voice, and vote.All non-student employees are members of the General Faculty and are eligible for committeeservice. Due to the size of the General Faculty, the General Faculty Assembly, a smaller body ofrepresentatives, serves as the voting body.The General Faculty Assembly concerns itself with nonacademic affairs affecting the general welfareof the <strong>College</strong> and the fulfillment of its purposes. Within its purview are those matters not restricted tothe <strong>College</strong> Faculty Assembly, including the labor program, financial aid, extracurricular activities,student conduct, residence hall life, <strong>College</strong> calendar, campus environment, some strategic planninginitiatives, and the general working circumstances for staff.The <strong>College</strong> Faculty Assembly acts on both academic program matters and recommendationsdealing with <strong>College</strong> Faculty personnel policies.The Staff Forum, consisting of all non-student employees except those who are members of the<strong>College</strong> Faculty, provides a formal structure of information-sharing and voice for staff members. Itserves in an advisory capacity to administrators and faculty decision-making bodies.The Student Government Association (SGA), represents the interests of all students and appointsstudent representatives to most <strong>College</strong> committees. Student Government representatives alsoserve on the General Faculty Assembly.General Faculty Assembly and <strong>College</strong> Faculty Assembly MembershipsAcademic Year <strong>2012</strong>-<strong>2013</strong>MembershipsGeneral Faculty Assembly264 membersNOTE: The General Faculty Assembly includes all membersof the <strong>College</strong> Faculty Assembly.<strong>College</strong> Faculty Assembly132 membersSource: <strong>Berea</strong> <strong>College</strong> Faculty Manual, August <strong>2012</strong>< http://www.berea.edu/faculty-manual/files/<strong>2012</strong>/09/<strong>2012</strong>0913-FacultyManual.pdf>Executive Council, October <strong>2012</strong>15
FACULTY COUNCIL AND COMMITTEE STRUCTUREThe <strong>College</strong> and General Faculties are organized to conduct their affairs primarily through fiveprogram councils and their subordinate committees. Each of these councils is responsible to eitherthe <strong>College</strong> Faculty Assembly or General Faculty Assembly, and any recommendations forsubstantive changes in policy are subject to approval by one or the other body. The councils are:Academic Program, Faculty Status, Labor Program, Strategic Planning, and Student Life.Coordinating and overseeing all elements of the structure is an Executive Council. The functions andcomposition of the Executive Council and the five program councils and their related committees aredescribed below.EXECUTIVE COUNCIL (EC)The Executive Council coordinates the efforts of the various program councils and is generallyresponsible for the effective functioning of campus governance.Faculty SecretaryThe Faculty Secretary is the recorder of official proceedings of the <strong>College</strong> Faculty Assembly andthe General Faculty Assembly meetings.Awards CommitteeThe Awards Committee solicits nominations from the <strong>College</strong> community for honorary degree and<strong>Berea</strong> <strong>College</strong> Service Award candidates. After reviewing the nominations, it recommendscandidates for approval by the appropriate bodies.ACADEMIC PROGRAM COUNCIL (APC)The Academic Program Council has comprehensive responsibility for the academic program, withspecific responsibilities for curriculum planning, continual review of current programs, policydevelopment, and general supervision of practices, requirements, and services affecting academicaffairs.Athletic Affairs CommitteeThe Athletic Affairs Committee has within its purview both intercollegiate and student activityclubs involved in athletic competition.Committee on General Education (COGE)The Committee on General Education, guided by the aims of the General Education curriculum,is charged with acting as the steering committee for the General Education curriculum.Convocation CommitteeThe Convocation Committee is primarily concerned with annual program planning. It selectsevents and presentations that advance the <strong>College</strong>'s educational purpose and enriches the life ofthe campus and community.Source: <strong>Berea</strong> <strong>College</strong> Faculty Manual, August <strong>2012</strong>< http://www.berea.edu/faculty-manual/>16
Faculty Council and Committee Structure (continued)ACADEMIC PROGRAM COUNCIL (APC), continuedLearning Commons CommitteeThe Learning Commons Committee facilitates collaboration between various academicsupport services across campus to deliver effective and integrated service in support ofstudent learning and student academic success.Student Admissions and Academic Standing Committee (SAAS)The Student Admissions and Academic Standing Committee monitors current policies andpractices with regard to admission, scholarship, probation and suspension, and formulatespolicy recommendations.Teacher Education Committee (TEC)The Teacher Education Committee engages in curriculum development, selects students forthe teacher education program, and provides liaison between that program and the rest of thecampus.FACULTY STATUS COUNCIL (FSC)The Faculty Status Council deals with questions of faculty status. The Council is responsible forpolicy review and recommendation to the <strong>College</strong> Faculty Assembly on <strong>College</strong> Faculty personnelmatters.LABOR PROGRAM COUNCIL (LPC)The Labor Program Council has as its principal concern interpreting and applying the vision forthe Student Labor Program.STRATEGIC PLANNING COUNCIL (SPC)The Strategic Planning Council conducts continuous planning for institutional change based onthe mission of the <strong>College</strong>, interpreted in light of opportunities and constraints created bychanging internal and external circumstances.STUDENT LIFE COUNCIL (SLC)The Student Life Council develops policy with respect to rules for student conduct, and policy fornonacademic aspects of campus life affecting students.ADDITIONAL STANDING COMMITTEES AND OTHER RESPONSIBILITESAdministrative CommitteeThe Administrative Committee is responsible to the Board of Trustees and the President ofthe <strong>College</strong> for matters of finance, physical properties, and internal management of the<strong>College</strong>. All instructional and operating departments of the institution are organized under amember of this committee.Budget CommitteeThe Budget Committee serves as an advisory body to the President in the preparation of theannual budget.Source: <strong>Berea</strong> <strong>College</strong> Faculty Manual, August <strong>2012</strong>17
Faculty Council and Committee Structure (continued)Campus Conduct Hearing Board (CCHB)The Hearing Board serves as a pool of persons from which panels are selected to hold formalhearings on matters presented to it. For staff hearings, these matters may include individualcomplaints of discrimination, sexual harassment, or other employment-related grievanceswhich apply to all employees of the <strong>College</strong>. For students, the Board hears all suspendablenonacademic cases of student misconduct, including violations of the Student ConductRegulations and misconduct arising from the student labor program or financial aid programs.Division CouncilThe Council assists the Academic Vice President and Dean of the Faculty with academiclong-range vision and planning. It also serves as a venue for sharing ideas and bestpractices within and across divisions, including review of self-studies.Faculty Advisors to the Student Government AssociationThe Faculty Advisors to the Student Government Association provide guidance in thedevelopment of policies, practices, and other procedures that pertain to the student body.Faculty Appeals CommitteeThe Committee hears appeals of tenure and promotion recommendations, cases involvingtermination for cause of tenured members of the faculty, and cases involving alleged violationof academic freedom.Faculty Liaison to the Board of TrusteesThe Faculty Liaison to the Board of Trustees attends the meetings of the full Board,participating with voice but not vote. The Faculty Liaison reports on the Board meetings tothe <strong>College</strong> Faculty Assembly and General Faculty Assembly.Enrollment Policies Committee (EPC)The Enrollment Policies Committee is primarily concerned with matters of enrollmentmanagement and related procedural matters. It sets goals each year for freshman, transfer,and returning student admissions, monitors retention and graduation rates, rules on studentrequests for leaves of absence, and coordinates planning among the offices represented onthe Committee. This committee also ensures quality of education offered through consortialrelationships.Safety CommitteeThe Safety Committee is responsible for coordinating and directing safety efforts on campus.Source: <strong>Berea</strong> <strong>College</strong> Faculty Manual, August <strong>2012</strong>18
NUMBER OF TEACHING FACULTY BY RANK AND STATUSAcademic Year Academic Year2011 - <strong>2012</strong> <strong>2012</strong> - <strong>2013</strong>Tenure Appointments* 105 111Unfilled Tenure Positions 12 7Total Allocated Tenure Track Positions 117 118Full-time Teaching Appointments** 124 129Professor ( 35 ) ( 36 )Associate ( 46 ) ( 45 )Assistant ( 34 ) ( 41 )Instructor ( 9 ) ( 7 )Part-Time 35 29Full-Time Employees Teaching Part-Time 14 17Full-Time Equated 149 150*Includes all tenure-track and tenured faculty, including two individuals teaching less than full-time, onefaculty on unpaid leave, and eight administrators in <strong>2012</strong>-<strong>2013</strong> and three individuals teaching less than fulltimeand four administrators in 2011-<strong>2012</strong>.**Includes only full-time teaching faculty, both tenure- and non tenure-track positions._______________________________________________________FULL-TIME TEACHING FACULTY* LENGTH OF SERVICE AT BEREABY GENDERACADEMIC YEAR <strong>2012</strong> - <strong>2013</strong>Male Female Total0 to 5 years 18 26 446 to 10 years 13 11 2411 to 20 years 20 14 3421 to 30 years 10 8 18Over 30 years 6 3 9TOTAL 67 62 129*Includes only full-time faculty whose duties are primarily teaching. Does not include sabbaticalreplacements.___________________________________________________________________STUDENT/FACULTY RATIOAcademic Year Academic Year2011-<strong>2012</strong> <strong>2012</strong>-<strong>2013</strong>Student/Faculty Ratio* (FTE) 11/1 11/1*Ratio is calculated by dividing the FTE Student Enrollment by the FTE full-time Faculty.Source: Office of the Academic Vice President and Dean of the Faculty, October <strong>2012</strong>19
20FULL-TIME TEACHING FACULTY* BY AGEACADEMIC YEARS 2003-2004 THROUGH <strong>2012</strong>-<strong>2013</strong>2003-2004 2004-2005 2005-2006 2006-2007 2007-2008Age** N % N % N % N % N %Less than 25 years old 0 (0%) 0 (0%) 0 (0%) 0 (0%) 0 (0%)25-29 years old 3 (2%) 2 (2%) 0 (0%) 1 (1%) 1 (1%)30-39 years old 23 (18%) 22 (17%) 25 (19%) 21 (16%) 21 (16%)40-49 years old 37 (28%) 38 (29%) 30 (23%) 30 (23%) 35 (27%)50-59 years old 43 (33%) 42 (32%) 48 (37%) 52 (41%) 51 (40%)60-69 years old 23 (18%) 25 (19%) 25 (19%) 22 (17%) 18 (14%)Greater than 69 years old 1 (1%) 2 (2%) 2 (2%) 2 (2%) 2 (2%)TOTAL 130 (100%) 131 (100%) 130 (100%) 128 (100%) 128 (100%)Average: 50 50 50 51 50_________________________________________________________________________________________________________________2008-2009 2009-2010 2010-2011 2011-<strong>2012</strong> <strong>2012</strong>-<strong>2013</strong>Age** N % N % N % N % N %Less than 25 years old 0 (0%) 0 (0%) 0 (0%) 0 (0%) 0 (0%)25-29 years old 1 (1%) 4 (3%) 2 (2%) 4 (3%) 0 (0%)30-39 years old 23 (18%) 17 (13%) 19 (16%) 16 (13%) 23 (17%)40-49 years old 33 (25%) 36 (28%) 32 (27%) 33 (27%) 32 (25%)50-59 years old 49 (37%) 48 (37%) 49 (41%) 42 (34%) 46 (36%)60-69 years old 22 (17%) 22 (17%) 17 (14%) 29 (23%) 28 (22%)Greater than 69 years old 3 (2%) 3 (2%) 0 (0%) 0 (0%) 0 (0%)TOTAL 131 (100%) 131 (100%) 119 (100%) 124 (100%) 129 (100%)Average: 51 51 50 50 51*Includes only full-time faculty whose duties are primarily teaching. Does not include sabbatical replacements.**Age as of September 1 of the Academic Year.Source: Office of the Academic Vice President and Dean of the Faculty, October <strong>2012</strong>
21FULL-TIME FACULTY* BASE SALARIES BY RANK AND GENDERACADEMIC YEAR <strong>2012</strong> - <strong>2013</strong>Male Female TotalRank Number Mean Median Number Mean Median Number Mean MedianProfessor 18 $82,900 $84,800 18 $80,400 $78,400 36 $81,700 $80,900Associate Prof. 30 $67,200 $67,300 15 $66,500 $66,000 45 $67,000 $67,000Assistant Prof. 17 $54,500 $53,600 24 $55,300 $54,100 41 $55,000 $53,600Instructor** 2 5 7 $48,200 $50,000ALL RANKS 67 $67,600 $67,000 62 $64,900 $61,700 129 $66,300 $63,800*Includes only full-time faculty whose duties are primarily teaching. Does not include sabbatical replacements.**Because of the small number of "Instructors," salary figures are not provided for this rank to ensure privacy; however, they are included in the"All Ranks" salary averages.Source: Office of the Academic Vice President and Dean of the Faculty, October <strong>2012</strong>
CHARACTERISTICS OF FULL-TIME FACULTY* BY DIVISION AND PROGRAM:GENDER, TERMINAL DEGREE, AND TENURE STATUSAcademic Year <strong>2012</strong> - <strong>2013</strong>TerminalGender Degree TenuredDivision/Program M F T N (%) N (%)Biology 5 2 7 7 (100%) 5 (71%)Chemistry 4 1 5 5 (100%) 3 (60%)Mathematics 3 3 6 4 (67%) 4 (67%)Nursing 0 6 6 6 (100%) 0 (0%)Physics 2 1 3 3 (100%) 1 (33%)DIVISION I TOTAL 14 13 27 25 (93%) 13 (48%)Agriculture and Natural Resources 2 1 3 3 (100%) 2 (67%)Business 4 1 5 2 (40%) 3 (60%)Computer and Information Science 2 1 3 3 (100%) 2 (67%)Economics 1 1 2 2 (100%) 1 (50%)Sustainability and Environmental Studies 1 1 2 2 (100%) 1 (50%)Technology and Applied Design 4 0 4 4 (100%) 2 (50%)Appointed to Division; no Program 1 0 1 1 (100%) 1 (100%)DIVISION II TOTAL 15 5 20 17 (85%) 12 (60%)Child and Family Studies 1 3 4 4 (100%) 2 (50%)Physical Education and Health 3 4 7 5 (71%) 2 (29%)Psychology 2 2 4 4 (100%) 2 (50%)Sociology 0 3 3 3 (100%) 2 (67%)Appointed to Division; no Program 0 1 1 0 (0%) 0 (0%)DIVISION III TOTAL 6 13 19 16 (84%) 8 (42%)English 2 3 5 5 (100%) 3 (60%)Communication 1 2 3 3 (100%) 2 (67%)Foreign Languages 3 4 7 7 (100%) 6 (86%)Music 4 4 8 7 (88%) 2 (25%)Theatre 1 2 3 3 (100%) 2 (67%)Appointed to Division; no Program 2 1 3 2 (67%) 0 (0%)DIVISION IV TOTAL 13 16 29 27 (93%) 15 (52%)Art and Art History 2 4 6 6 (100%) 3 (50%)Asian Studies**History 3 2 5 5 (100%) 5 (100%)Philosophy 3 0 3 3 (100%) 3 (100%)Political Science 2 0 2 2 (100%) 2 (100%)Religion 3 1 4 4 (100%) 4 (100%)Appointed to Division; no Program 2 0 2 2 (100%) 0 (0%)DIVISION V TOTAL 15 7 22 22 (100%) 17 (77%)African and African American Studies 2 0 2 1 (50%) 1 (50%)Appalachian Studies**Education Studies 1 5 6 5 (83%) 2 (33%)Peace and Social Justice Studies**Women’s and Gender Studies 0 2 2 1 (50%) 1 (50%)Appointed to Division; no Program 1 1 2 1 (50%) 1 (50%)DIVISION VI TOTAL 4 8 12 8 (67%) 5 (42%)TOTAL 67 62 129 115 (89%) 70 (54%)*Includes only full-time faculty whose duties are primarily teaching. Does not include sabbatical replacements, but doesinclude faculty in non-tenure track positions. Joint appointments are listed in only one department.**Faculty in these programs typically have a full-time faculty position in another program.NOTE: Under the Gender column, the following abbreviations are used: M = Male, F = Female, and T = Total of Malesand Females.Source: Office of the Academic Vice President and Dean of the Faculty, October <strong>2012</strong>22
23AVERAGE DOLLARS FOR FACULTY DEVELOPMENT PERFULL-TIME FACULTY MEMBERProfessional Travel, Dues, Seminarsand CoursesFiscal Year Fiscal Year Fiscal Year Fiscal Year Fiscal Year2007-2008* 2008-2009 2009-2010 2010-2011 2011-<strong>2012</strong>Total Dollars Spent on Faculty Development $424,374 $247,935 $160,263 $404,862 $360,891Number of Faculty Receiving Funds 128 131 130 119 124Percent of Total Full-Time Faculty 100% 100% 100% 100% 100%Average Total Dollars Per Full-Time Faculty $3,315 $2,017 $1,276 $3,402 $2,910Sabbatical Leave (Includes Full and Two-Thirds Year Leaves)Total Dollars Spent on Faculty Sabbaticals $528,076 $543,730 $641,737 $452,455 $749,897Number of Faculty on Paid Sabbatical 9 9 13 9 11Average Total Dollars Per Faculty on Sabbatical $58,675 $60,414 $49,364 $50,273 $71,255Percent of Total Full-Time Faculty 7.0% 6.9% 10.0% 7.6% 8.9%Number of Total Full-Time Faculty 128 131 130 119 124*2007-2008 data have been corrected from prior <strong>Fact</strong> <strong>Book</strong>s. (The number of faculty has been corrected from 126 to 128)Source: Office of the Academic Vice President and Dean of the Faculty, October <strong>2012</strong>
THE SEABURY AWARD FOR EXCELLENCE IN TEACHINGThe Seabury Award for Excellence in Teaching has been presented annually to outstanding <strong>Berea</strong> <strong>College</strong>faculty since 1961. The Award, which was made possible through the generosity of the Charles Ward Seaburyfamily, is a cash award presented at Commencement each year. The recipient of the award is selected eachyear by a committee, composed of the last six recipients of the award, the students who will receive the WoodAchievement Award at the same Commencement, and by the Dean of the Faculty. The Seabury Award carrieswith it great prestige as the highest honor an active faculty member may receive from the <strong>College</strong>.The Seabury Award Committee annually invites students and faculty to nominate persons to receive thisrecognition. The nominations take the form of a letter addressing why the nominee would be a worthy recipient.The nominations give attention to the following considerations:The teacher's enthusiasm for his or her subject and the teacher's capacity to stimulate students' interestin that subject.The teacher's effectiveness in helping students move toward greater intellectual and personal maturity.The teacher's engagement in scholarly and creative activities in his or her discipline, or in crossdisciplinarystudy.The teacher's willingness to be involved, socially and intellectually, with students outside the classroomand in <strong>College</strong> activities.In choosing a person to be honored, the Committee over the years has given relatively little weight to the numberof nominations an individual receives in a given year. More important than many nominations is a thoughtfuldescription of a person's accomplishments as a teacher and an explanation why special recognition is deserved.Petitions or letters of nomination signed by more than one person are not considered.Recipients of the Seabury Award for Excellence in TeachingNames of current <strong>Berea</strong> <strong>College</strong> faculty members are italicized.Dorothy Weeden Tredennick 1962 Philip Schmidt 1982Gerrit Levey 1962 Larry K. Blair 1983Marian Kingman 1963 Richard Barnes 1984Robert Gordon Menefee 1963 Marlene Waller 1985Charlotte P. Ludlum 1964 Smith T. Powell 1986William E. Newbolt 1964 John Wallhausser 1987Virginia Ruth Woods 1965 Stephen C. Bolster 1988George Gilbert Roberts 1965 Robert J. Schneider 1989Maureen Faulkner 1966 Ralph Stinebrickner 1990Kristjan Sulev Kogerma 1966 Jeanne M. Hoch 1991Herschel Lester Hull 1967 Dean Warren Lambert 1992Frank Junior Wray 1967 Ralph L. Thompson 1993Jerome William Hughes 1968 Eugene T. Chao 1994Thomas Reed Beebe 1968 John E. Courter 1995Louise Moore Scrivner 1969 Paul David Nelson 1996John Douglas Chrisman 1969 L. Eugene Startzman 1997Cornelius Gregory Di Teresa 1970 Donald Hudson 1998Franklin Bryan Gailey 1970 Dorothy Hopkins Schnare 1999Thomas McRoberts Kreider 1971 Thomas A. Boyd 2000William John Schafer 1971 Richard D. Sears 2001Robert Jerry Lewis 1972 Laura A. Crawford 2002Stephen Scott Boyce 1972 Walter E. Hyleck 2003Thomas David Strickler 1973 Andrew Baskin 2004Martha Wylie Pride 1974 Amer Lahamer 2005Glen H. Stassen 1975 Dawn Anderson 2006John Fletcher White 1976 Gary Mahoney 2007Mary Louise Pross 1977 Ron Rosen 2008Robert Ward Pearson 1978 Janice Blythe 2009John Seelye Bolin 1979 Barbara Wade 2010Dennis Michael Rivage-Seul 1980 Bob Suder 2011Jonas Patterson Shugars 1981 Ed McCormack <strong>2012</strong>Source: Office of the Academic Vice President and Dean of Faculty, September <strong>2012</strong>27
THE PAUL C. HAGER EXCELLENCE IN ADVISING AWARDThe Paul C. Hager Excellence in Advising Award is given annually at the May Commencement to aperson who is an academic advisor and is also a member of the <strong>College</strong> or General Faculties. Theaward is named in honor of Paul C. Hager, emeritus administrator and professor (1962-1997), whosupervised the advising process at <strong>Berea</strong> <strong>College</strong> during the last part of the twentieth century. Theguidelines for the award are published annually in early spring, at which time students and faculty areasked to submit nominations for confidential consideration. The Award Selection Committee consistsof the two most recent award winners, with assistance from the Associate Provost for Advising andAcademic Success.Recipients of the Paul C. Hager Excellence in Advising AwardNames of current <strong>Berea</strong> <strong>College</strong> faculty members are italicized.James Gage 1993Oliver Keels 1994Dorothy Schnare 1995Carolyn Orr 1996Paul C. Hager 1997Martie Kazura 1998Megan Hoffman 1999Meighan Sharp 2000Don Hudson 2001Barbara Wade 2002Dawn Anderson 2003Janice Blythe 2004Patricia Isaacs 2005Michael Panciera 2006David Porter 2007Ralph Thompson 2008Katrina Rivers Thompson 2009Ed McCormack 2009Fred de Rosset 2010Billy Wooten 2011Wayne Tolliver <strong>2012</strong>Source: Office of the Academic Vice President and Dean of the Faculty, September <strong>2012</strong>28
ELIZABETH PERRY MILES AWARD FOR COMMUNITY SERVICECurtis W. Miles of Chagrin Falls, Ohio, made a gift to establish the Elizabeth Perry Miles Award forCommunity Service to be given annually to a member of the <strong>Berea</strong> <strong>College</strong> General Faculty. Therecipient is selected by the Executive Council from nominees submitted by members of the GeneralFaculty or from community groups. Current members of the Executive Council are not eligible toreceive this award.The following are guidelines for the award: Recipients will be from the <strong>Berea</strong> <strong>College</strong> General Faculty The award will be given only for significant contributions. The award is for community service with the area that <strong>Berea</strong> serves, including service onboards, committees, volunteer groups, in community development, individual service toothers, or any other work which enhances community life. The community service must be above and beyond the nominee’s usual job. No one may receive the award more than once in three years. The award will consist of a suitable plaque and a monetary award. The identity of the winner will not be made known until the time of the presentation atCommencement in May.Recipients of the Elizabeth Perry Miles Award for Community ServiceNames of current <strong>Berea</strong> <strong>College</strong> faculty/staff members are italicized.Tom Boyd 1991Betty Olinger 1992Carol Lamm 1993William Stolte 1994Joan Moore 1995Peter Hille 1996John Cook 1997Randy Osborne 1998Lee Morris 1999Virgil Burnside 2000Brenda Hosley 2001Andrew Baskin 2002Betty Hibler 2003Barbara Power 2004Fred de Rosset 2005John Courter 2006Nancy Ryan 2007Theresa Lowder 2008Mary Ann Shupe 2009Melissa Osborne 2010Miriam David 2011Joe Bagnoli <strong>2012</strong>Source: Office of the Academic Vice President and Dean of the Faculty, September <strong>2012</strong>29
ADMISSIONS TERRITORY CATEGORIES<strong>Berea</strong> <strong>College</strong> students are characterized at term of entry by one of three"geographical" categories. They are:• In-Territory: Students who come from much of the Appalachian region and allof Kentucky within the white area in the map below. In-Territory also includespermanent residents (a non-citizen who has formally established residency inthe United States) and refugees who reside in the territory.• Out-of-Territory: Students who come from outside the In-Territory area,including U.S. Citizens living in foreign countries. Out-of-Territory also includespermanent residents (a non-citizen who has formally established residency inthe U.S.) and refugees who reside out of the territory.• F-1 International: Students who are not U.S. Citizens, permanentresidents, or refugees.30
ADMISSIONS TERRITORYALABAMA KENTUCKY KENTUCKY KENTUCKYBlount Bourbon** Jessamine* Scott**Calhoun Boyd Johnson Shelby**Cherokee Boyle* Kenton** Simpson**Cullman Bracken* Knott Spencer**Dekalb Breathitt Knox Taylor*Etowah Breckenridge** Larue** Todd**Jackson Bullitt** Laurel Trigg**Jefferson Butler** Lawrence Trimble**Limestone Caldwell** Lee Union**Madison Calloway** Leslie Warren**Marshall Campbell** Letcher Washington**Morgan Carlisle** Lewis WayneSt. Clair Carroll** Lincoln Webster**Shelby Carter Livingston** WhitleyTalladega Casey Logan** WolfeChristian** Lyon** Woodford**GEORGIA Clark* McCracken**Bartow Clay McCreary NORTH CAROLINACatoosa Clinton McLean** AlexanderChattooga Crittenden** Madison AlleghanyCherokee Cumberland Magoffin AsheDade Daviess** Marion* AveryDawson Edmonson** Marshall** BuncombeFannin Elliott Martin BurkeFloyd Estill Mason* CaldwellForsyth Fayette** Meade** CherokeeGilmer Fleming* Menifee ClayGordon Floyd Mercer* GrahamHabersham Franklin** Metcalfe* HaywoodLumpkin Fulton** Monroe* HendersonMurray Gallatin** Montgomery* JacksonPickens Garrard Morgan McDowellRabun Grant** Muhlenburg** MaconTowns Graves** Nelson** MadisonUnion Grayson** Nicholas* MitchellWalker Green* Ohio** PolkWhite Greenup Oldham** RutherfordWhitfield Hancock** Owen** StokesHardin** Owsley SurryKENTUCKY Harlan Pendleton** SwainAdair Harrison** Perry TransylvaniaAllen** Hart** Pike WautagaAnderson** Henderson** Powell WilkesBallard** Henry** Pulaski YanceyBarren** Hickman** Robertson*Bath Hopkins** RockcastleBell Jackson RowanBoone** Jefferson** Russell31
Admissions Territory (continued)OHIO TENNESSEE VIRGINIA WEST VIRGINIAAdams** Jackson Lee MonroeAthens** Jefferson Loudon NicholasBrown** Johnson Montgomery PendletonClermont** Knox Nelson Pleasants*Gallia** Loudon Page PocahontasHamilton*** McMinn Patrick Preston*Highland** Macon Pulaski PutnamHocking** Marion Roanoke RaleighJackson** Meigs Rockbridge RandolphLawrence** Monroe Rockingham Ritchie*Meigs** Morgan Russell Roane*Monroe** Overton Scott SummersMorgan** Pickett Shenandoah Taylor*Noble** Polk Smyth TuckerPerry** Putnam Tazewell Tyler*Pike** Rhea Warren Upshur*Ross** Roane Washington WayneScioto** Scott Wise WebsterVinton** Sequatchie Wythe Wirt*Washington** Sevier Wood**Smith WEST VIRGINIA WyomingSOUTH CAROLINA Sullivan Barbour*Cherokee Unicoi Boone**Greenville Union Braxton* TAKEN OUTOconee VanBuren Cabell* OF TERRITORYPickens Warren Calhoun* IN 1976Spartanburg Washington Clay*WhiteDoddridge*TENNESSEE Fayette AlabamaAnderson VIRGINIA Gilmer* ClayBledsoe Alleghany Grant CleburneBlount Amherst Greenbrier FayetteBradley Augusta Hampshire FranklinCampbell Bath Hardy MarionCarter Bedford Harrison* WalkerClaiborne Bland Jackson* WinstonClay Botetourt JeffersonCocke Buchanan Kanawha*Cumberland Carroll Lewis* VirginiaDeKalb Clarke Lincoln GreeneFentress Craig Logan MadisonGrainger Dickenson McDowell RappahannockGreene Floyd Marion*Grundy Franklin Mason*Hamblen Frederick MercerHamilton Giles MineralHancock Grayson MingoHawkins Highland Monongalia**Counties added in 1976**Counties added in 1978***County added in 1996 (Hamilton County, Ohio)Source: Admissions Office32
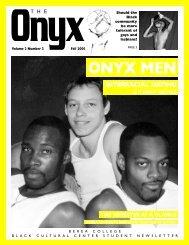
FIRST-YEAR STUDENTS:APPLICATIONS, ACCEPTED, AND ENROLLEDSUBMITTED COMPLETEDAPPLICATIONS APPLICATIONS* ACCEPTED ENROLLEDFALL % of Completed % ofTERM N N N Applications N Accepted2003 2,119 n/a 530 n/a 396 75%2004 2,107 n/a 561 n/a 400 712005 1,908 n/a 511 n/a 378 742006 1,818 n/a 532 n/a 388 732007 2,083 n/a 597 n/a 421 712008 2,468 n/a 531 n/a 413 782009 2,745 1,362 516 38 % 392 762010 3,264 1,542 564 37 429 762011 4,707 1,603 586 37 418 71<strong>2012</strong> 4,423 1,694 538 32 391 73*The number of completed applications is not available prior to fall 2009.NUMBER OF FIRST-YEAR STUDENTS450400396 400378 388421 4133924294183913503002502001501005002003 2004 2005 2006 2007 2008 2009 2010 2011 <strong>2012</strong>Entering Fall TermSource: Annual editions of the First-Year Students’ Class Profile33
FIRST-YEAR STUDENTS:APPLICATIONS, ACCEPTED AND ENROLLEDBY GENDERMalesSUBMITTED COMPLETEDAPPLICATIONS APPLICATIONS ACCEPTED ENROLLEDFALL % of Completed % ofTERM N N N Applications N Accepted2003 897 n/a 217 n/a 156 72 %2004 868 n/a 254 n/a 191 752005 861 n/a 218 n/a 159 732006 817 n/a 222 n/a 168 762007 892 n/a 236 n/a 169 722008 1,015 n/a 220 n/a 172 782009 1,107 588 216 37% 171 792010 1,284 690 261 38 199 762011 1,813 716 277 39 205 74<strong>2012</strong> 1,695 711 229 32 173 76FemalesSUBMITTED COMPLETEDAPPLICATIONS APPLICATIONS ACCEPTED ENROLLEDFALL % of Completed % ofTERM N N N Applications N Accepted2003 1,222 n/a 313 n/a 240 77 %2004 1,242 n/a 310 n/a 209 672005 1,047 n/a 293 n/a 219 712006 1,001 n/a 310 n/a 220 712007 1,191 n/a 361 n/a 252 702008 1,453 n/a 311 n/a 241 782009 1,638 774 300 39% 221 742010 1,980 852 303 36 230 762011 2,894 887 309 35 213 69<strong>2012</strong> 2,728 983 310 32 218 70Source: Annual editions of the First-Year Students’ Class Profile34
FIRST-YEAR STUDENTSAPPLICATIONS, ACCEPTED, AND ENROLLEDBY TERRITORYIN-TERRITORYSUBMITTED COMPLETEDAPPLICATIONS APPLICATIONS ACCEPTED ENROLLEDFALL % of Completed % ofTERM N N N Applications N Accepted2003 1,046 n/a 388 n/a 287 74 %2004 1,060 n/a 422 n/a 298 712005 928 n/a 390 n/a 295 762006 994 n/a 410 n/a 294 722007 1,172 n/a 470 n/a 333 712008 1,339 n/a 382 n/a 303 792009 1,468 644 367 57% 282 772010 1,661 736 413 56 315 762011 2,716 843 419 50 306 73<strong>2012</strong> 2,558 855 413 48 303 73OUT-OF-TERRITORYSUBMITTED COMPLETEDAPPLICATIONS APPLICATIONS ACCEPTED ENROLLEDFALL % of Completed % ofTERM N N N Applications N Accepted2003 357 n/a 106 n/a 80 75 %2004 425 n/a 110 n/a 75 682005 295 n/a 89 n/a 63 712006 282 n/a 87 n/a 63 722007 344 n/a 97 n/a 66 682008 490 n/a 110 n/a 84 762009 627 218 112 51% 86 772010 749 275 121 44 91 752011 1,200 301 130 43 86 66<strong>2012</strong> 1,104 303 94 31 62 66F-1 INTERNATIONAL*SUBMITTED COMPLETEDAPPLICATIONS APPLICATIONS ACCEPTED ENROLLEDFALL % of Completed % ofTERM N N N Applications N Accepted2003 716 n/a 36 n/a 29 81 %2004 625 n/a 32 n/a 27 842005 685 n/a 32 n/a 20 632006 542 n/a 35 n/a 31 892007 567 n/a 30 n/a 22 732008 639 n/a 39 n/a 26 682009 650 500 37 7% 24 652010 854 531 30 6 23 772011 791 459 37 8 26 70<strong>2012</strong> 761 536 32 6 26 81*The category "F-1 International" does not include all students who come to the <strong>College</strong> from other countries or with substantialinternational experience. For example, "permanent residents" who may be asylees or refugees are counted as "In-Territory" or"Out-of-Territory" rather than "F-1 International" depending on residence at the time of application. These students are eligiblefor federal financial aid that F-1 International students cannot legally receive. In Fall <strong>2012</strong>, one (1) first-year student wasdesignated as a “permanent resident.”Source: Annual editions of the First-Year Students’ Class Profile35
FIRST-YEAR STUDENTS FROM KENTUCKYFALL TERMS 2003 – <strong>2012</strong>Total First-Year Kentucky First-Year Percent KentuckyYear Students Students First-Year Students of Total2003 396 130 32.8%2004 400 159 39.82005 378 146 38.62006 388 163 42.02007 421 196 46.62008 413 169 40.92009 392 169 43.12010 429 189 44.12011 418 185 44.3<strong>2012</strong> 391 175 44.8AFRICAN-AMERICAN* FIRST-YEAR STUDENTSFALL TERMS 2003 – <strong>2012</strong>PercentTotal First-Year African-American* African American* of TotalYear Students First-Year Students First-Year Students2003 396 67 16.9%2004 400 85 21.32005 378 75 19.82006 388 74 19.12007 421 75 17.82008 413 63 15.02009 392 81 20.72010 429 71 16.62011 418 94 22.5<strong>2012</strong> 391 78 19.9*Based on the number of students who identified themselves as “Black or African American” alone orin combination with another race.Source: Annual editions of the First-Year Students’ Class Profile36
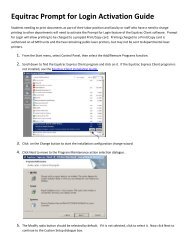
MEAN ACT COMPOSITE SCORES2003 - <strong>2012</strong>Number of <strong>Berea</strong>’sFall Students who First-Year <strong>Berea</strong> National KentuckyTerm Submitted ACT Students* Men Women Mean Mean2003 292 23.0 22.8 23.1 20.8 20.22004 297 23.6 23.4 23.8 20.9 20.32005 276 23.0 22.6 23.3 20.9 20.42006 290 23.1 22.7 23.4 21.1 20.62007 331 23.1 22.7 23.3 21.2 20.72008 322 23.2 22.6 23.6 21.1 20.92009 305 23.5 23.0 23.9 21.1 19.42010 336 24.1 23.8 24.4 21.0 19.42011 331 24.6 24.4 24.9 21.1 19.6<strong>2012</strong> 310 24.5 23.8 25.0 21.1 19.8*Approximately 75 - 85% of <strong>Berea</strong> <strong>College</strong> first-year students submit ACT scores.363432302826242220181614121086420Mean ACT Composite Scores2003 2004 2005 2006 2007 2008 2009 2010 2011 <strong>2012</strong><strong>Berea</strong> National KentuckySource: Annual editions of the First-Year Students’ Class Profile37
38MEAN SAT SCORESCRITICAL READING, MATHEMATICS, AND WRITING2003-<strong>2012</strong><strong>Berea</strong>’s First-Year StudentsNational and Kentucky ComparisonsNumber of Critical Critical ReadingFall Students who Reading (Verbal) Mathematics WritingTerm Submitted SAT (Verbal) Mathematics Writing National KY National KY National KY2003 88 545 546 not applicable 507 554 519 552 not applicable2004 120 551 554 not applicable 508 559 518 557 not applicable2005 94 576 562 not applicable 508 561 520 559 not applicable2006* 84 563 576 not available 503 562 518 562 497 5552007 80** 539 542 528 502 567 515 565 494 5532008 65** 562 538 531 502 568 515 570 494 5542009 63 564 534 546 501 573 515 573 493 5612010 71 583 556 546 501 575 516 575 492 5632011 74 573 545 563 497 576 514 572 489 563<strong>2012</strong> 67** 586 579 552 496 579 514 575 488 566*SAT changed the exam to add a writing section and re-vamped the verbal section and re-named it “Critical Reading”(first administered in March 2005).**Score reports include one who submitted SAT exam given prior to Writing component added.NOTE: SAT section means are on a scale from 200 to 800.Source: Annual editions of the First-Year Students’ Class Profile
39FIRST-YEAR STUDENTS RANKED IN THE TOP ONE-FIFTH OF THEIR HIGH SCHOOL CLASSBY GENDER AND COHORT TYPE2008 - <strong>2012</strong>100%90%80%70%60%50%40%All First-Year Students55% 56% 57%62% 63%100%90%80%70%60%50%40%Males By GenderFemales74%63% 64% 65%48% 49%43% 44%70%53%30%30%20%20%10%10%0%2008 2009 2010 2011 <strong>2012</strong>0%2008 2009 2010 2011 <strong>2012</strong>By Cohort Type100%90%80%70%60%50%40%30%20%10%0%African-Americans*Other Domestic Students67% 65%56% 57%59%56%50%48%45%54%2008 2009 2010 2011 <strong>2012</strong>*Based on students who identified themselves as “Black or African American” alone or in combination with another race.NOTE: Approximately 80 – 85% of first-year students come from high schools where rank in class is reported. International students are not included in thegraphs above.Source: Annual editions of First-Year Students’ Class Profile
FIRST-YEAR STUDENTS ASSIGNED TO DEVELOPMENTAL MATHEMATICS COURSESFALL TERMS 2003 - <strong>2012</strong>100%90%80%Mathematics 012 Only (Category added in 2006)Mathematics 010, 011, and 012Mathematics 011/012 OnlyMathematics 010 Only (generally zero or one student)70%4060%50%In 2005, the cut-off forwaiving DevelopmentalMath was raised byone ACT point (from 19to 20).40%30%20%10%26.8%7.6%23.3%5.0%19.2% 18.3%32.8%7.4%25.4%28.9%5.4%34.7%9.7%4.8% 6.4%29.1%5.8%5.3%30.6%5.8%6.1%19.3% 18.5% 17.9% 18.6%25.6%6.5%5.4%20.7%5.7%1.4%13.8% 13.6%17.3%4.3%2.8%10.2%0%2003(N=396)2004(N=400)2005(N=378)2006(N=388)2007(N=421)2008(N=413)2009(N=392)2010(N=429)2011(N=418)<strong>2012</strong>(N=391)Fall Term (Number of First-Year Students)NOTE: The number on the top of the bars indicates the percentage of first-year students who need any developmental mathematics.Source: Academic Services, October <strong>2012</strong>
FINANCIAL NEED OF ENTERING FIRST-YEAR STUDENTS:Federal Pell Grant Recipients*100%Ten-Year Average: 89%95%98% 99% 97%90%89%86%87% 85%86%81%80%70%60%4150%40%30%20%10%0%2003 2004 2005 2006 2007 2008 2009 2010 2011 <strong>2012</strong>NOTE: International students are not included in this chart.Entering Fall Term*To be admissible to <strong>Berea</strong> <strong>College</strong>, the Expected Family Contribution (EFC) must be $4,750 (<strong>2012</strong>-13 ceiling) or lower.Source: Office of Institutional Research and Assessment, October <strong>2012</strong>
FIRST-YEAR STUDENT ENROLLMENT TRENDS100%First-Year Enrollment by Gender90%80%70%61%52%58% 57% 60% 58% 56% 54% 51%56%60%50%40%30%20%39%48%42% 43% 40% 42% 44% 46% 49%44%10%0%EnteringFall Term2003 2004 2005 2006 2007 2008 2009 2010 2011 <strong>2012</strong>MalesFemales100%90%First-Year Enrollment by Cohort Type7% 7% 5% 8% 5% 6% 6% 5% 6% 7%80%70%60%50%76%72% 75% 73% 77% 78%73% 78%71% 73%40%30%20%10%17%21% 20% 19% 18% 15%21%17%22% 20%0%Entering 2003 2004 2005 2006 2007 2008 2009 2010 2011 <strong>2012</strong>Fall TermAfrican-American Students*All Other Students*(Excluding F-1 International)F-1 International Students*Includes Permanent Residents (non-citizens, including refugees and asylees who have formally established residencyin the U.S.) and U.S. citizens living in foreign countriesNOTE: African-American students are based on those students who identified themselves as “Black or AfricanAmerican” alone or in combination with another race.Source: Office of Institutional Research and Assessment, October <strong>2012</strong>42
First-Year Student Enrollment Trends, continued100%90%80%First-Year Enrollment by Territory7% 7% 5% 8% 5% 6% 6% 5% 6% 7%17%16%20% 19%16%20% 22% 21% 21%16%70%60%50%40%30%72% 75%78% 76%79%73% 72% 73% 73%77%20%10%0%Entering 2003 2004 2005 2006 2007 2008 2009 2010 2011 <strong>2012</strong>Fall TermIn-Territory Out-of-Territory F-1 International StudentsSource: Office of Institutional Research and Assessment, October <strong>2012</strong>.43
TRANSFER STUDENTS:APPLICATIONS, ACCEPTED, AND ENROLLEDSUBMITTED COMPLETEDAPPLICATIONS APPLICATIONS ACCEPTED ENROLLEDFALL % of completed % ofTERM N N N Applications N Accepted2003 297 n/a 30 n/a 22 73 %2004 289 n/a 32 n/a 24 752005 120 n/a 32 n/a 27 842006 154 n/a 27 n/a 21 782007 140 n/a 30 n/a 21 702008 266 n/a 29 n/a 26 902009 364 90 38 42 % 28 742010 428 132 92 70 77 842011 625 188 115 61 101 88<strong>2012</strong> 618 201 55 27 47 85NUMBER OF TRANSFER STUDENTS1101001019080777060504740302022242721 2126281002003 2004 2005 2006 2007 2008 2009 2010 2011 <strong>2012</strong>Entering Fall TermSource: Annual editions of the Transfer Students’ Class Profile44
TRANSFER STUDENTS:APPLICATIONS, ACCEPTED, AND ENROLLEDBY GENDERMalesSUBMITTED COMPLETEDAPPLICATIONS APPLICATIONS ACCEPTED ENROLLEDFALL % of completed % ofTERM N N N Applications N Accepted2003 128 n/a 14 n/a 11 79 %2004 141 n/a 16 n/a 12 752005 56 n/a 17 n/a 15 882006 65 n/a 15 n/a 12 802007 65 n/a 12 n/a 8 672008 121 n/a 12 n/a 10 832009 146 45 21 47 % 15 712010 165 56 37 66 33 892011 254 78 49 63 43 88<strong>2012</strong> 223 82 24 29 20 83FemalesSUBMITTED COMPLETEDAPPLICATIONS APPLICATIONS ACCEPTED ENROLLEDFALL % of completed % ofTERM N N N Applications N Accepted2003 169 n/a 16 n/a 11 69 %2004 148 n/a 16 n/a 12 752005 64 n/a 15 n/a 12 802006 89 n/a 12 n/a 9 752007 75 n/a 18 n/a 13 722008 145 n/a 17 n/a 16 942009 218 45 17 38 % 13 762010 263 76 55 72 44 802011 371 110 66 60 58 88<strong>2012</strong> 395 119 31 26 27 87Source: Annual editions of the Transfer Students’ Class Profile45
FALL TERM TRANSFER STUDENT ENROLLMENT TRENDSTransfer Student Enrollment by Gender100%90%80%70%50% 50%44% 43%62% 62%46%57% 57% 57%60%50%40%30%20%50% 50%56% 57%38% 38%54%43% 43% 43%10%0%2003 2004 2005 2006 2007 2008 2009 2010 2011 <strong>2012</strong>MaleFemaleTransfer Student Enrollment by Territory100%90%80%70%36%62%7%33%4% 3% 4%32%43% 43% 38%44% 42%45%60%50%40%14%33%19%24% 27%18%19%10%9%30%20%10%50%38%26%38%33% 31%50%36%46% 43%0%2003 2004 2005 2006 2007 2008 2009 2010 2011 <strong>2012</strong>Kentucky In- Territory (not KY) Out of Territory F-1 InternationalSource: Office of Institutional Research and Assessment, October <strong>2012</strong>46
FALL <strong>2012</strong> ENROLLMENT CATEGORY HIGHLIGHTSAll Degree-Seeking First-Year Students Transfer StudentsN = 1,604 N = 391 N = 47GenderMale 683 43% 173 44% 20 43%Female 921 57% 218 56% 27 57%TerritoryIn-Territory 1,107 69% 304 78% 24 51%Out-of-Territory 383 24% 61 16% 21 45%F-1 International 114 7% 26 7% 2 4%Students withInternational Experience 136 8% 27 7% 5 11%NOTE: There were also three (3) F-1 International students enrolled as exchange students (non-degreeseeking)this Fall Term.Ethnic and Racial Breakdowns*Hispanic or Latino orSpanish Origin 62 4% 19 5% 1 2%Black or African American 289 18% 78 20% 11 23%Other minorities 72 4% 16 4% 2 4%White 1,062 66% 259 66% 30 64%Unknown and International 183 11% 38 10% 4 9%Non-Traditional 284 18% 36 9% 20 43%*As requested by and reported to the Federal Government – IPEDS.Definitions:In-Territory: Students who come from much of the Appalachian region and all of Kentucky.In-Territory also includes permanent residents (a non-citizen who has formally established residency inthe United States) and refugees who reside in the territory.Out-of-Territory: Students who come from outside the In-Territory area, including U.S. Citizens living inforeign countries. Out-of-Territory also includes permanent residents (a non-citizen who has formallyestablished residency in the U.S.) and refugees who reside out of the territory.F-1 International: Students who are not U.S. Citizens, permanent residents, or refugees.Students With International Experience: All students who are classified as "F-1 International" and otherstudents who are classified as "permanent residents" (students who may be asylees or refugees).Black or African American: Students (not F-1 International students) who identified themselves as“Black or African American” alone or in combination with another race.Other Minorities: Students (not F-1 International students) who identified themselves as "AmericanIndian or Alaskan Native," "Asian," or “Native Hawaiian or Other Pacific Islander" alone or in combinationwith each other.Unknown: Students who chose not to identify their race on their admissions application and allF-1 International students because they are not coded on the basis of race/ethnicity.Non-Traditional: All students who are 24 years of age or older and/or married and/or have achild/children.47
FIRST-GENERATION COLLEGE STUDENTSEntering Student Data100%90%80%Neither parent has received a college degreeNeither parent has completed any college courses70%60%50%68%56%67%53%64%51%59%51%53%48%54%40%30%20%31%36%29%31%40%29%30%22%34%10%0%2003 2004 2005 2006 2007 2008 2009 2010 2011 <strong>2012</strong>Entering Fall TermGraduating Student Data100%90%Neither parent has received a college degreeNeither parent has completed any college courses80%70%69% 69%65% 66% 65%64%68%60%58%56%59%50%40%30%33%36% 36%34%31%27%36%23%25%36%20%10%0%2002-03 2003-04 2004-05 2005-06 2006-07 2007-08 2008-09 2009-10 2010-11 2011-12Graduating YearSource: Office of Institutional Research and Assessment, annualEntering Student Surveys (Response rates range from 85% to 97%)Graduating Senior Exit Surveys (Response rates range from 68% to 86%).48
FALL HEADCOUNT ENROLLMENT*18001700160015001,559 1,556 1,595 1,576 1,58248 4272 56 541,5491,54858 521,613611,6611,65848 5414001300120011001000499008007001511 1514 1523 1520 15281491 149615521613 1604600500400300200100Fall Term02003 2004 2005 2006 2007 2008 2009 2010 2011 <strong>2012</strong>Non-Degree-Seeking 48 42 72 56 54 58 52 61 48 54Degree-Seeking 1511 1514 1523 1520 1528 1491 1496 1552 1613 1604*Includes Full and Part-Time Students.Source: Office of Institutional Research and Assessment, October <strong>2012</strong>
FALL ENROLLMENTS BY CLASSIFICATION2008 - <strong>2012</strong>2008 2009 2010 2011 <strong>2012</strong>Total (Full-Time and Part-Time)*Freshman 491 458 506 530 459First-Year Students (413) (392) (429) (418) (391)Other Freshmen** (78) (66) (77) (112) (68)Sophomore 336 356 346 381 392Junior 339 320 336 356 394Senior 325 362 364 346 359TOTAL DEGREE-SEEKINGSTUDENTS 1,491 1,496 1,552 1,613 1,604<strong>Berea</strong> Community School 27 20 23 21 34Madison Southern High School 4 11 9 1 0<strong>College</strong> Employee 4 3 1 2 2Community (Special) 12 8 16 18 15Post Graduate 0 0 0 0 0Transient/Exchange 11 10 11 6 3EKU Exchange n/a n/a 1 0 0TOTAL NON-DEGREE-SEEKINGSTUDENTS 58 52 61 48 54TOTAL HEADCOUNT 1,549 1,548 1,613 1,661 1,658*For a breakdown of full and part-time students, please see the next page.NOTE: For Fall <strong>2012</strong>, there were sixteen first-year students “officially” classified as sophomores. Fall 2011, there were twelvefirst-year students “officially” classified as sophomores, and three first-year students “officially” classified as juniors. For fall2010, there were eleven first-year students “officially” classified as sophomores. For Fall 2009, there were four first-yearstudents “officially” classified as sophomores. For Fall 2008, there were two first-year students “officially” classified assophomores.Definitions:Full-time Student - A student who has a 3 to 4 1/2 credits course load.Part-time Student - A student who is registered for less than 3 credits course load.First-Year Students - Students who have enrolled at <strong>Berea</strong> <strong>College</strong> for the first time and did not transfer from anotherinstitution.**Other Freshmen - Includes continuing (students who were enrolled at <strong>Berea</strong> during the previous term), returning (studentspreviously enrolled, withdrew, and subsequently accepted for readmission), and transfer students (students who have beenenrolled at another post secondary institution) who are classified as freshman.Non-Degree-Seeking Classifications:<strong>Berea</strong> Community School or Madison Southern High School- Junior and senior high school students who take no more thantwo courses per term at <strong>Berea</strong> <strong>College</strong> upon the recommendation of their Guidance Counselor and concurrence of theAssociate Provost.Community (Special) - Non-degree-seeking students who wish to take courses for personal enrichment or for limitededucational gain.Transient/Exchange - Transient students are students who take courses at <strong>Berea</strong> <strong>College</strong> to transfer back to their homeinstitution. Exchange students are enrolled at <strong>Berea</strong> full-time under an exchange agreement with another institution.EKU Exchange - Exchange students are enrolled at <strong>Berea</strong> part-time under an exchange agreement with Eastern KentuckyUniversity (EKU) in Richmond, KY.Post Graduate - A student attending <strong>Berea</strong> <strong>College</strong> full-time after earning a baccalaureate degree who is not seeking anadditional degree.Source: Annual editions of the Fall Term Student Enrollment Report50
Fall Enrollments by Classification, continued2008 2009 2010 2011 <strong>2012</strong>Full-Time StudentsFreshman 491 458 506 530 458First-Year Students (413) (392) (429) (418) (391)Other Freshmen** (78) (66) (77) (112) (67)Sophomore 336 355 345 381 392Junior*** 338 320 336 356 394Senior 323 362 364 345 352TOTAL DEGREE-SEEKINGFULL-TIME STUDENTS 1,488 1,495 1,551 1,612 1,596<strong>Berea</strong> Community School 1 0 2 0 1Madison Southern High School 0 0 0 0 0<strong>College</strong> Employee 0 0 0 0 0Community (Special) 0 0 0 1 1Post Graduate 0 0 0 0 0Transient/Exchange 7 6 11 6 3EKU Exchange n/a n/a 0 0 0TOTAL NON-DEGREE-SEEKINGFULL-TIME STUDENTS 8 6 13 7 5TOTAL FULL-TIME STUDENTS 1,496 1,501 1,564 1,619 1,601---------------------------------------------------------------------------------------------------------------------------------------------Part-Time StudentsFreshman 0 0 0 0 1First-Year Students (0) (0) (0) (0) (0)Other Freshmen** (0) (0) (0) (0) (1)Sophomore 0 1 1 0 0Junior*** 1 0 0 0 0Senior 2 0 0 1 7TOTAL DEGREE-SEEKINGPART-TIME STUDENTS 3 1 1 1 8<strong>Berea</strong> Community School 26 20 21 21 33Madison Southern High School 4 11 9 1 0<strong>College</strong> Employee 4 3 1 2 2Community (Special) 12 8 16 17 14Post Graduate 0 0 0 0 0Transient/Exchange 4 4 0 0 0EKU Exchange n/a n/a 1 0 0TOTAL NON-DEGREE-SEEKINGPART-TIME STUDENTS 50 46 48 41 49TOTAL PART-TIME STUDENTS 53 47 49 42 57FTE ENROLLMENT 1,518 1,517 1,585 1,639 1,623**Other freshmen includes continuing (students who were enrolled at <strong>Berea</strong> during the previous term), returning (studentspreviously enrolled, withdrew, and subsequently accepted for readmission), and transfer students (students who have beenenrolled at another post secondary institution) who are classified as freshman.NOTE: FTE (Full-Time Equivalent) Enrollment is calculated by equating part-time students to full-time status (enrolled in atleast a 3 credit course load). FTE for each part-time student is determined by dividing the total number of courses taken by 3.Our current part-time enrollment of 57 students has a FTE of 22.17.Source: Annual editions of the Fall Term Student Enrollment Report51
DEGREE-SEEKING STUDENTS:F-1 INTERNATIONAL AND THOSE WITH INTERNATIONAL EXPERIENCE*FALL TERMS 2003 – <strong>2012</strong>International Experience*Total F-1 International StudentsDegree-Seeking Students (Includes F-1 International)Year Students N % of Total N % of Total2003 1,511 113 7.5 % 145 10.0 %2004 1,514 110 7.3 157 10.02005 1,523 109 7.2 149 10.02006 1,520 121 8.0 162 11.02007 1,528 106 6.9 146 10.02008 1,491 111 7.4 146 9.82009 1,496 112 7.5 141 9.42010 1,552 103 6.6 137 8.82011 1,613 114 7.1 144 8.9<strong>2012</strong> 1,604 114 7.1 136 8.5*Students who are classified as “F-1 international” and other students who are classified as “permanentresidents” (students who may be asylees or refugees). In addition, there were 3 F-1 International Studentsenrolled as exchange students (non-degree-seeking) in Fall <strong>2012</strong>.AFRICAN-AMERICAN** DEGREE-SEEKING STUDENTSFALL TERMS 2003 – <strong>2012</strong>TotalPercentDegree-Seeking African-American African-AmericanYear Students Students** Students** of Total2003 1,511 260 17.0%2004 1,514 283 19.02005 1,523 283 19.02006 1,520 278 18.02007 1,528 273 18.02008 1,491 253 17.02009 1,496 273 18.22010 1,552 266 17.12011 1,613 293 18.2<strong>2012</strong> 1,604 289 18.0**Students who identified themselves as “Black or African American” alone or in combination with another race.Source: Office of Institutional Research and Assessment, October <strong>2012</strong>52
FALL <strong>2012</strong> ENROLLMENT BY STATE ANDU.S. TERRITORIESDegree-Seeking Students:Alabama 83 (5%) Mississippi 5 (*)Alaska 2 (*) Missouri 7 (*)Arizona 3 (*) Nevada 4 (*)Arkansas 4 (*) New Hampshire 1 (*)Armed Forces Pacific 1 (*) New Jersey 3 (*)California 12 (1%) New Mexico 1 (*)Colorado 5 (*) New York 16 (1%)Connecticut 3 (*) North Carolina 65 (4%)Delaware 2 (*) North Dakota 1 (*)Florida 20 (1%) Ohio 153 (9%)Georgia 65 (4%) Oregon 5 (*)Guam (U.S. Territory) 2 (*) Pennsylvania 11 (1%)Hawaii 1 (*) Rhode Island 1 (*)Idaho 1 (*) South Carolina 15 (1%)Illinois 16 (1%) South Dakota 2 (*)Indiana 21 (1%) Tennessee 122 (7%)Iowa 3 (*) Texas 6 (*)Kentucky 663 (40%) Utah 1 (*)Louisiana 3 (*) Vermont 6 (*)Maine 4 (*) Virginia 58 (3%)Maryland 7 (*) Washington 2 (*)Massachusetts 7 (*) West Virginia 49 (3%)Michigan 16 (1%) Wisconsin 4 (*)Minnesota 2 (*) Wyoming 1 (*)Sub-Total (46 states, 1 territory and the Armed Forces) 1,485 (90%)Students Enrolled from Outside the U.S. and/or Its Territories(For more detail, see the following page.) 119 (7%)Total Degree-Seeking Students 1,604 (97%)Non-Degree-Seeking Students:<strong>Berea</strong> Community School 34<strong>College</strong> Employee 2Community (Special) 15EKU Exchange 0Madison Southern High School 0Transient/Exchange 3Sub-Total 54Total Non-Degree-Seeking Students 54 (3%)TOTAL HEADCOUNT ENROLLMENT 1,658 (100%)*Denotes percentages less than 1.NOTE: For the degree-seeking students above, the states and U.S. territories are determined by the address given atthe time of acceptance to the <strong>College</strong>. "Students enrolled from outside the U.S. and/or Its Territories," therefore includemore students than those classified as "F-1 International."Source: Office of Institutional Research and Assessment, Geographical Report, October <strong>2012</strong>.For more details visit 53
Degree-Seeking Students:FALL <strong>2012</strong> ENROLLMENT BY COUNTRYORGANIZED BY CONTINENTAfrica (19 countries)Asia, continuedBotswana 1 (1%) Taiwan 1 (1%)Burkina Faso 2 (2%) Tibet, The Former 4 (3%)Cameroon 4 (3%) Turkmenistan 1 (1%)Dem. Rep. of the Congo 5 (4%) Uzbekistan 3 (3%)Egypt 1 (1%) Vietnam 3 (3%)Eritrea 2 (2%) Yemen 3 (3%)Ethiopia 3 (3%) Asia Total 49 (41%)Ghana 2 (2%)Kenya 4 (3%) Europe (6 countries)Liberia 1 (1%) Albania 1 (1%)Malawi 2 (2%) Georgia 1 (1%)Morocco 2 (2%) Kosovo 3 (3%)Nigeria 4 (3%) Moldova 1 (1%)Rwanda 3 (3%) Slovak Republic 1 (1%)Sudan 1 (1%) Ukraine 1 (1%)Tanzania 2 (2%) Europe Total 8 (7%)Uganda 2 (2%)Zambia 1 (1%) North America (4 countries)Zimbabwe 4 (3%) Dominica 1 (1%)Africa Total 46 (39%) Guatemala 1 (1%)Haiti 4 (3%)Asia (20 countries) St. Lucia 1 (1%)Afghanistan 5 (4%) North America 7 (6%)TotalBangladesh 2 (2%)Burma 6 (5%) South America (6 countries)China 2 (2%) Bolivia 2 (2%)India 2 (2%) Brazil 1 (1%)Indonesia 1 (1%) Chile 1 (1%)Iran 2 (2%) Columbia 3 (3%)Iraq 3 (3%) Ecuador 1 (1%)Japan 2 (2%) Peru 1 (1%)Mongolia 1 (1%) South America Total 9 (8%)Pakistan 4 (3%)Russia 1 (1%)South Korea 2 (2%)Sri Lanka 1 (1%) (55 Countries represented)TOTAL OF ALL COUNTRIES 119 (100%)NOTE: For the degree-seeking students above, the countries are determined by the address given at the time ofacceptance to the <strong>College</strong>. The one-hundred and nineteen (119) students above include more students thanthose classified as "F-1 International" and represent approximately 7% of the total degree-seeking enrollment.Source: Office of Institutional Research and Assessment, Geographical Report, October <strong>2012</strong>.For more details visit and.54
FALL ENROLLMENTS OF DEGREE-SEEKING STUDENTSBY TERRITORY2008 - <strong>2012</strong>2008 2009 2010 2011 <strong>2012</strong><strong>Berea</strong>'s Territory* 1,082 1,067 1,092 1,113 1,106Prior to 1976 expansion 69% 69% 65% 65% 56%Counties Added in 1976 & 1978 29% 29% 32% 32% 41%Hamilton Co, Ohio added in 1996 2% 3% 3% 3% 3%Out-of-Territory** 298 317 357 386 384F-1 International*** 111 112 103 114 114TOTAL 1,491 1,496 1,552 1,613 1,604*For a complete description of <strong>Berea</strong>'s Territory and its changes, please see pages 30 - 32. <strong>Berea</strong>'s Territoryalso includes permanent residents (a non-citizen who has formally established residency in the United States)and refugees who reside in the territory.**The "Out-of-Territory" classification includes students who come from outside <strong>Berea</strong>'s Territory, including U.S.citizens living in foreign countries. "Out-of-Territory" also includes permanent residents (a non-citizen who hasformally established residency in the United States) and refugees who reside out of the territory.***The category "F-1 International" does not include all students who come to the <strong>College</strong> from other countries orwith substantial international experience. For example, "permanent residents" who may be asylees or refugeesare counted as "In-Territory" or "Out-of-Territory" rather than "F-1 International" depending on residence at thetime of application. These students are eligible for federal financial aid that F-1 International students cannotlegally receive. In Fall <strong>2012</strong>, twenty-two (22) <strong>Berea</strong> <strong>College</strong> students were designated as "permanent residents."NOTE: This table does not include non-degree-seeking students: community (special) students, employees,transient/exchange, post-graduates, EKU exchange students, <strong>Berea</strong> Community School students, or MadisonSouthern High School students.International,7.0%Out-of-Territory,24.0%In-Territory,69.0%Source: Office of Institutional Research and Assessment, annual editions of The Geographical Report,55
56FALL ENROLLMENTS OF DEGREE-SEEKING STUDENTSBY RACE/ETHNICITY*2008 - <strong>2012</strong>2008 2009 2010* 2011 <strong>2012</strong>N (%) N (%) N (%) N (%) N (%)Black or African American ** 253 (17%) 273 (18%) 266 (17%) 293 (18%) 289 (18%)Pre-2010 Category: African-American (Non-Hispanic)American Indian or Alaskan Native 18 (1%) 11 (1%) 7 (0.5%) 6 (0.4%) 6 (0.4%)Asian 22 (1%) 21 (1%) 16 (1%) 20 (1%) 20 (1%)Pre-2010 Category: Asian or Pacific IslanderNative Hawaiian or Pacific Islander not available not available 1 (0.06%) 1 (0.06%) 0 (0%)Hispanic 33 (2%) 39 (3%) (see note below) (see note below) (see note below)White 1,016 (68%) 1,010 (68%) 1,038 (67%) 1,062 (66%) 1,062 (66%)Pre-2010 Category: White (Non-Hispanic)Students who chose not to respond/Race unknown 38 (3%) 30 (2%) 73 (5%) 69 (4%) 67 (4%)Two or more races indicated*** not available not available 48 (3%) 48 (3%) 46 (3%)F-1 International Students 111 (7%) 112 (7%) 103 (7%) 114 (7%) 114 (7%)TOTAL 1,491 (100%) 1,496 (100%) 1,552 (100%) 1,613 (100%) 1,604 (100%)NOTES: Students who indicated that they were “Hispanic or Latino or of Spanish origin;” in Fall 2010, 26 (2%); Fall 2011, 50 (3%); and Fall <strong>2012</strong>, 62 (4%)Percentages may not equal 100% due to rounding.*Categories changed as mandated by the Federal Government; students were asked to answer questions about ethnicity (Hispanic or not) and race (chooseone or more). Please see page 57 for more details.**Based on the number of students who identified themselves as “Black or African American” alone or in combination with another race.***Based on students who selected more than one race, but not “Black or African American.”Source: Office of Institutional Research and Assessment, October <strong>2012</strong>
57ENROLLMENT OF DEGREE-SEEKING STUDENTSBY ETHNIC AND RACIAL BREAKDOWNSEthnic and Racial Breakdown (as requested by and reported to the federal government – IPEDS)Ethnicity Breakdown for All Students Fall 2010 Fall 2011 Fall <strong>2012</strong>Hispanic or Latino or Spanish Origin 26 1.7% 50 3.1% 62 3.9%Not Hispanic or Latino or Spanish Origin 1,224 80.2% 1,318 81.7% 1,323 82.5%Choose not to respond 179 11.5% 131 8.1% 105 6.5%International Students 103 6.6% 114 7.1% 114 7.1%Racial BreakdownF-1 International (racial breakdown not collected) 103 6.6% 114 7.1% 114 7.1%Chose not to respond (Race unknown) 73 4.7% 69 4.3% 67 4.2%American Indian or Alaska Native 7 0.5% 6 0.4% 6 0.4%Asian 16 1.0% 20 1.2% 20 1.2%Black or African American 228 14.7% 249 15.4% 238 14.8%Native Hawaiian or Other Pacific Islander 1 0.1% 1 0.1% 0 0.0%White 1,038 66.9% 1,062 65.8% 1,062 66.2%Two or more races indicated 86 5.5% 92 5.7% 97 6.0%American Indian/Alaska Native and Asian and Black/African American and Native Hawaiian/Other Pacific Islander and White (4) (3) (3)American Indian/Alaska Native and Asian (0) (0) (1)American Indian/Alaska Native and Asian and White (3) (3) (2)American Indian/Alaska Native and Black/African American (1) (0) (0)American Indian/Alaska Native and Black/African and Native Hawaiian/OtherPacific Islander and White (2) (1) (0)American Indian/Alaska Native and Black/African American and White (9) (13) (12)American Indian/Alaska Native and White (31) (33) (30)Asian and Black/African American (2) (1) (1)Asian and Black/African American and White (1) (2) (1)Asian and Native Hawaiian/Other Pacific Islander and White (1) (1) (1)Asian and Native Hawaiian/Other Pacific Islander (1) (0) (0)Asian and White (11) (10) (11)Black/African American and Native Hawaiian/Other Pacific Islander and White (1) (0) (0)Black/African American and White (18) (24) (34)Native Hawaiian/Other Pacific Islander and White (1) (1) (1)1,552 100.0% 1,613 100.0% 1,604 100.0%NOTE: The total number of students who identified themselves as “Black or African American” alone or in combination with another race is 266 (17.1%) for Fall 2010 ; 293 (18.2%) forFall 2011 and 289 (18.0%) for Fall <strong>2012</strong>.Compiled by the Office of Institutional Research and Assessment, October <strong>2012</strong>
58FALL ENROLLMENTS OF DEGREE-SEEKING STUDENTS BY AGE*2008 – <strong>2012</strong>2008 2009 2010 2011 <strong>2012</strong>Age* N (%) N (%) N (%) N (%) N (%)Less than 18 years old 37 (2%) 16 (1%) 43 (3%) 39 (2%) 33 (2%)18 – 19 years old 656 (44%) 622 (42%) 662 (43%) 689 (43%) 647 (40%)20 – 21 years old 565 (38%) 575 (38%) 563 (36%) 566 (35%) 604 (38%)22 – 24 years old 157 (11%) 201 (13%) 184 (12%) 191 (12%) 198 (12%)25 – 29 years old 49 (3%) 50 (3%) 63 (4%) 75 (5%) 75 (5%)30 – 34 years old 13 (1%) 15 (1%) 18 (1%) 23 (1%) 20 (1%)35 – 39 years old 4 (**) 6 (**) 7 (**) 14 (1%) 14 (1%)40 – 49 years old 7 (**) 7 (**) 11 (1%) 13 (1%) 12 (1%)50 – 64 years old 3 (**) 4 (**) 1 (**) 3 (**) 1 (**)Greater than 64 years old 0 (0%) 0 (0%) 0 (0%) 0 (0%) 0 (0%)TOTAL 1,491 (100%) 1,496 (100%) 1,552 (100%) 1,613 (100%) 1,604 (100%)*Age is as of the first day of classes in the fall.**Denotes percentages less than 1.NOTE: Percentages may not equal 100% due to rounding.Source: Office of Institutional Research and Assessment, October <strong>2012</strong>
59FALL <strong>2012</strong> JUNIOR AND SENIOR ENROLLMENTBY MAJOR AND COHORT TYPEAfrican-American* All Other Domestic F-1 International TotalN (%) N (%) N (%) N (%)African and African American Studies 4 (3%) 0 (0%) 0 (0%) 4 (**)Agriculture and Natural Resources 0 (0%) 43 (7%) 0 (0%) 43 (5%)Applied Science and Mathematics 0 (0%) 1 (**) 1 (1%) 2 (**)Art and Art History 1 (1%) 24 (4%) 2 (3%) 27 (3%)Asian Studies 2 (2%) 3 (**) 0 (0%) 5 (1%)Biology 14 (12%) 40 (7%) 3 (4%) 57 (7%)Business Administration 4 (3%) 25 (4%) 10 (15%) 39 (5%)Chemistry 7 (6%) 19 (3%) 6 (9%) 32 (4%)Child and Family Studies 10 (8%) 36 (6%) 0 (0%) 46 (6%)Communication 7 (6%) 18 (3%) 0 (0%) 25 (3%)Computer and Information Science 1 (1%) 18 (3%) 4 (6%) 23 (3%)Economics 2 (2%) 6 (1%) 7 (10%) 15 (2%)Education Studies – Elementary Education 4 (3%) 21 (3%) 1 (1%) 26 (3%)Education Studies – General 3 (2%) 29 (5%) 0 (0%) 32 (4%)Education Studies – Middle Grades 5-9 0 (0%) 7 (1%) 0 (0%) 7 (1%)Education Studies – Teaching and Curriculum with 0 (0%) 1 (**) 0 (0%) 1 (**)CertificationEnglish 3 (2%) 38 (6%) 1 (1%) 42 (5%)Foreign LanguagesFrench 0 (0%) 4 (1%) 1 (1%) 5 (1%)German 0 (0%) 1 (**) 1 (1%) 2 (**)Spanish 4 (3%) 15 (2%) 0 (0%) 19 (2%)History 2 (2%) 21 (3%) 0 (0%) 23 (3%)Independent 1 (1%) 11 (2%) 1 (1%) 13 (2%)Mathematics 3 (2%) 18 (3%) 7 (10%) 28 (3%)Music 4 (3%) 15 (2%) 0 (0%) 19 (2%)Nursing 2 (2%) 38 (6%) 5 (7%) 45 (6%)Philosophy 1 (1%) 5 (1%) 0 (0%) 6 (1%)Physical Education 7 (6%) 22 (4%) 0 (0%) 29 (4%)Physics 2 (2%) 6 (1%) 3 (4%) 11 (1%)Political Science 2 (2%) 13 (2%) 4 (6%) 19 (2%)Psychology 7 (6%) 29 (5%) 5 (7%) 41 (5%)Religion 0 (0%) 6 (1%) 0 (0%) 6 (1%)Sociology 4 (3%) 16 (3%) 2 (3%) 22 (3%)Technology and Applied Design 9 (7%) 27 (4%) 2 (3%) 38 (5%)Theatre 6 (5%) 17 (3%) 1 (1%) 24 (3%)Women’s and Gender Studies 2 (2%) 3 (**) 0 (0%) 5 (1%)Undecided 3 (2%) 17 (3%) 1 (1%) 21 (3%)TOTAL 121 (100%) 613 (100%) 68 (100%) 802 (100%)*Based on students who indentified themselves as “Black or African American” alone or in combination with another race.**Denotes percentages less than 1.Note: These are duplicate headcounts that include double degrees and double majors. The 802 majors represent 753 junior and senior students enrolled in Fall <strong>2012</strong>.Compiled by: Office of Institutional Research and Assessment, September <strong>2012</strong>.
FALL ENROLLMENT TRENDS100%Fall Enrollment of Degree-Seeking Students* by Gender90%80%70%61% 59% 60% 60% 60% 60% 59% 59% 57% 57%60%50%40%30%20%39% 41% 40% 40% 40% 40% 41% 41% 43% 43%10%0%Fall Term 2003 2004 2005 2006 2007 2008 2009 2010 2011 <strong>2012</strong>MalesFemales100%90%Fall Enrollment of Degree-Seeking Students* by Cohort Type7% 7% 7% 8% 7% 7% 7% 7% 7% 7%80%70%60%50%75%74% 74% 74% 75% 76% 74% 76% 75% 75%40%30%20%10%17% 19% 19% 18% 18% 17% 18% 17% 18% 18%0%Fall Term 2003 2004 2005 2006 2007 2008 2009 2010 2011 <strong>2012</strong>African-AmericanStudents**All Other Students**(Excluding F-1 International)F-1 InternationalStudents*Includes full and part-time students.**Based on students who identified themselves as “Black or African American” alone or in combination with another race.Source: Office of Institutional Research and Assessment, October <strong>2012</strong>60
Fall Enrollment Trends, continued100%90%Fall Enrollment of Degree-Seeking Students* by Territory7% 7% 7% 8% 7% 7% 7% 7% 7% 7%80%19% 19% 20% 20% 20% 20%21% 23% 24% 24%70%60%50%40%74% 73% 72% 72% 73% 73% 71% 70% 69% 69%30%20%10%0%Fall Term2003 2004 2005 2006 2007 2008 2009 2010 2011 <strong>2012</strong>In-Territory Out-of-Territory F-1 International*Includes full and part-time students.Source: Office of Institutional Research and Assessment, October <strong>2012</strong>61
SPRING ENROLLMENTS BY CLASSIFICATION2008 - <strong>2012</strong>2008 2009 2010 2011 <strong>2012</strong>Total (Full-Time and Part-Time)*Freshman 363 338 319 350 334First-Year Students (9) (3) (1) (4) (1)Other Freshmen** (354) (335) (318) (346) (333)Sophomore 312 324 287 342 380Junior 308 291 322 318 361Senior 442 400 408 405 404TOTAL DEGREE-SEEKINGSTUDENTS 1,425 1,353 1,336 1,415 1,479<strong>Berea</strong> Community School 17 27 24 17 25Madison Southern High School 3 4 10 8 2<strong>College</strong> Employee 4 4 3 3 0Community (Special) 12 12 11 20 17Transient/Exchange 5 9 9 11 8TOTAL NON-DEGREE-SEEKINGSTUDENTS 41 56 57 59 52TOTAL HEADCOUNT 1,466 1,409 1,393 1,474 1,531*For a breakdown of full and part-time students, please see the next page.Definitions:Full-time Student - A student who has a 3 to 4 1/2 credits course load.Part-time Student - A student who is registered for less than a 3 credits course load.First-Year Students - Students who have enrolled at <strong>Berea</strong> <strong>College</strong> for the first time and did not transfer fromanother institution.**Other Freshmen - Includes continuing (students who were enrolled at <strong>Berea</strong> during the previous term),returning (students previously enrolled, withdrew, and subsequently accepted for readmission), and transferstudents (students who have been enrolled at another post secondary institution) who are classified asfreshman.Non-Degree-Seeking Classifications:<strong>Berea</strong> Community School or Madison Southern High School- Junior and senior high school students who takeno more than two courses per term at <strong>Berea</strong> <strong>College</strong> upon the recommendation of their Guidance Counselor andconcurrence of the Associate Provost.Community (Special) - Non-degree-seeking students who wish to take courses for personal enrichment or forlimited educational gain.Transient/Exchange - Transient students are students who take courses at <strong>Berea</strong> <strong>College</strong> to transfer back totheir home institution. Exchange students are enrolled at <strong>Berea</strong> full-time under an exchange agreement withanother institution. Includes EKU exchange students.Source: Academic Services, February <strong>2012</strong>62
SPRING ENROLLMENTS BY CLASSIFICATION (Continued)Full-Time Students 2008 2009 2010 2011 <strong>2012</strong>Freshman 363 338 319 350 334First-Year Students (9) (3) (1) (4) (1)Other Freshmen** (354) (335) (318) (346) (333)Sophomore 312 324 287 342 379Junior 307 290 322 318 359Senior 439 398 408 401 402TOTAL DEGREE-SEEKINGFULL-TIME STUDENTS 1,421 1,350 1,336 1,411 1,474<strong>Berea</strong> Community School 0 0 0 0 0Madison Southern High School 0 0 0 0 0<strong>College</strong> Employee 0 0 0 0 0Community (Special) 2 0 0 0 2Transient/Exchange 4 7 8 11 7TOTAL NON-DEGREE-SEEKINGFULL-TIME STUDENTS 6 7 8 11 9TOTAL FULL-TIME STUDENTS 1,427 1,357 1,344 1,422 1,483___________________________________________________________________________Part-Time Students 2008 2009 2010 2011 <strong>2012</strong>Freshman 0 0 0 0 0First-Year Students (0) (0) (0) (0) (0)Other Freshmen** (0) (0) (0) (0) (0)Sophomore 0 0 0 0 1Junior 1 1 0 0 2Senior 3 2 0 4 2TOTAL DEGREE-SEEKINGPART-TIME STUDENT 4 3 0 4 5<strong>Berea</strong> Community School 17 27 24 17 25Madison Southern High School 3 4 10 8 2<strong>College</strong> Employee 4 4 3 3 0Community (Special) 10 12 11 20 15Transient/Exchange 1 2 1 0 1TOTAL NON-DEGREE-SEEKINGPART-TIME STUDENTS 35 49 49 48 43TOTAL PART-TIME STUDENTS 39 52 49 52 48FTE Enrollment 1,444 1,379 1,362 1,443 1,504**Other Freshmen - Includes continuing (students who were enrolled at <strong>Berea</strong> during the previous term), returning (studentspreviously enrolled, withdrew, and subsequently accepted for readmission), and transfer students (students who have beenenrolled at another post secondary institution) who are classified as freshman.NOTE: FTE (Full-Time Equivalent) Enrollment is calculated by equating part-time students to full time status (enrolled in atleast a 3 credits course load). FTE For each part-time student is determined by dividing the total number of courses taken by3. Our part-time enrollment of 48 students has an FTE of 20.92.Source: Academic Services, February <strong>2012</strong>63
FIRST-TO-SECOND YEAR RETENTIONFirst-Year StudentsAll First-Year Students100%90%80%80.1%82.3% 81.5% 81.7%83.0%77.9%81.8%78.8% 79.3%81.6%70%60%50%40%30%20%10%0%2002 2003 2004 2005 2006 2007 2008 2009 2010 2011Entering Fall TermBy Gender100%MalesFemales90%80%70%77%83% 83%82%76%87%84%83%81% 82%74%80%77%85%71%85%72%85% 86%77%60%50%40%30%20%10%0%2002 2003 2004 2005 2006 2007 2008 2009 2010 2011Entering Fall TermSource: Office of Institutional Research and Assessment, October <strong>2012</strong>64
FIRST-TO-SECOND YEAR RETENTION, continuedBy Cohort Type100%90%80%70%100% 100% 100% 100% 100% 100% 100% 100% 100% 100%91%87%85%83%81%82%81%80% 78%81%79%78%80%78%77%78%78%76%75%75%60%50%40%30%20%10%0%2002 2003 2004 2005 2006 2007 2008 2009 2010 2011Entering Fall TermAfrican-American* All Other Domestic F-1 International*Based on students who identified themselves as “Black or African American” alone or in combinationwith another race.By Territory100%90%80%70%60%50%40%30%20%10%0%100% 100% 100% 100% 100% 100% 100% 100% 100% 100%93%92%89% 89%89%84%84%84%83%81% 79%79% 79% 80%78%78%76%75%76%77%2002 2003 2004 2005 2006 2007 2008 2009 2010 2011Entering Fall TermIn-Territory Out-of-Territory F-1 InternationalSource: Office of Institutional Research and Assessment, October <strong>2012</strong>65
FIRST-TO-SECOND YEAR RETENTIONBY COHORT TYPE BY GENDER100% African-American Students*90%80%70%60%50%40%30%20%10%0%2002 2003 2004 2005 2006 2007 2008 2009 2010 2011Men 87.5% 85.0% 82.8% 69.0% 92.0% 68.0% 86.7% 55.2% 60.7% 76.2%Women 76.0% 85.1% 89.3% 80.4% 78.7% 78.0% 93.9% 86.5% 88.4% 82.7%*Based on students who identified themselves as “Black or African American” alone or incombination with another race.100% All Other Domestic Students90%80%70%60%50%40%30%20%10%0%2002 2003 2004 2005 2006 2007 2008 2009 2010 2011Men 71.0% 79.3% 72.1% 81.7% 76.8% 73.9% 73.1% 70.9% 72.5% 74.7%Women 83.2% 80.4% 84.4% 82.2% 84.4% 79.4% 82.5% 83.8% 83.4% 86.2%NOTE: All International Students retained to the second year for years 2002 through 2011.Source: Office of Institutional Research and Assessment, October <strong>2012</strong>66
FIRST-YEAR STUDENT RETENTION/ATTRITIONFALL TERMS 2002 - 2011Breakdown of WithdrawalsPercentTotalNumber Returned for Number Academic Other VoluntaryYear Enrolled Second Year Withdrawn Suspensions Suspensions** Departures2002 356 80.1 % 71 18 10 432003 396 82.3 70 23 5 422004 400 81.5 74 17 6 512005 378 81.7 69 26 4 392006 388 83.0 66 14 2 502007 420* 77.9 93 25 4 642008 413 81.8 75 26 3 462009 392 78.8 83 18 9 562010 429 79.3 89 31 9 492011 418 81.6 77 28 9 40NOTE: For all years reported above, the percent retained represents both students who re-enrolled the secondyear as well as those students granted a "leave of absence." Students who do not return from official leaves arenot counted as withdrawn until they fail to re-enroll after their leaves.100%90%80%70%60%50%40%30%20%10%0%PERCENTAGE OF TOTAL WITHDRAWALS ATTRIBUTED TO:ACADEMIC SUSPENSIONS, OTHER SUSPENSIONS**,AND VOLUNTARY DEPARTURESVoluntary DeparturesAcademic SuspensionsOther Suspensions**2002 2003 2004 2005 2006 2007 2008 2009 2010 2011Year Entered*Denotes cohort numbers that have been adjusted due to the death of a student. In each case, the number inthe cohort has been reduced by one.**Includes expulsion, disciplinary, labor, convocation, and administrative dismissals.Source: Office of Institutional Research and Assessment, October <strong>2012</strong>67
FIRST-TO-SECOND YEAR RETENTION, SIX-YEAR GRADUATION RATES, AND ACADEMIC QUALIFICATIONS AT ENTRYFOR FIRST-YEAR STUDENTS100%90%80%6870%60%50%40%1987(413)1988(362)1989(378)1990(384)1991(436)1992(397)1993(455)1994(406)1995(418)1996(397)F-S Retention 72.6% 78.8% 75.4% 80.7% 70.2% 72.5% 68.1% 71.9% 70.0% 64.6% 71.3% 79.0% 76.8% 82.7% 79.7% 80.1% 82.3% 81.5% 81.7% 83.0% 77.9% 81.8% 78.8% 79.3% 81.6%Six-Year Graduation Rates 55.0% 55.4% 56.6% 54.7% 51.4% 51.4% 47.4% 50.5% 51.7% 49.7% 49.3% 62.6% 61.9% 60.8% 63.0% 63.8% 64.9% 64.0% 61.9% 66.5%Percent in top 1/5 high school class 58.0% 61.0% 60.0% 56.0% 52.0% 54.0% 53.0% 51.0% 47.0% 39.0% 43.0% 60.0% 58.0% 64.0% 53.0% 60.0% 57.0% 56.0% 55.0% 55.0% 54.0% 55.0% 56.0% 57.3% 62.0%Percent Needing any Developmental Math 52.5% 46.8% 40.2% 45.2% 47.0% 37.9% 34.9% 32.0% 40.6% 42.5% 46.8% 22.9% 20.1% 23.3% 25.5% 28.1% 26.8% 23.3% 32.8% 28.9% 34.7% 29.1% 30.6% 25.6% 20.7%ACT Composite Mean 20.2 21.0 21.3 21.6 21.7 21.7 22.3 22.2 21.7 21.7 21.7 23.0 23.1 23.5 23.3 23.2 23.0 23.6 23.0 23.1 23.1 23.2 23.5 24.1 24.61997(404)1998(414)1999(423)2000(421)2001(424)2002(356)2003(396)2004(400)2005(378)2006(388)2007(420)2008(413)2009(392)2010(429)2011(418)NOTE: In 2005, the cut-off for waiving Developmental Math was raised by one ACT point (from 19 to 20).Compiled by the Office of Institutional Research and Assessment, October <strong>2012</strong>
69GRADUATION RATES* FOR FIRST-YEAR STUDENTS100%6-year90%5-year4-year80%70%60%50%61.9%60.8%60.8% 59.6%63.0%61.6%63.8% 64.9%62.4%63.9%64.0%62.3%%61.9 %61.1%66.5%64.9%6-yearrates notavailableyet60.2%5 and 6-year ratesnotavailableyet40%30%20%35.5%40.1%45.0%44.4%51.3% 50.3%42.6%47.4% 46.4% 44.3%10%0%1999(N = 423)2000(N = 421)2001(N = 424)2002(N = 356)2003(N = 396)2004(N = 400)2005(N = 378)2006(N = 388)2007(N = 420**)2008(N = 413)Entering Fall Term (Number in Cohort)*Students who withdraw and return are included in their original class. If a student graduates mid-year, the additional fall term is counted asanother year.**Denotes cohort numbers that have been reduced by one due to the death of a student.Source: Office of Institutional Research and Assessment, September <strong>2012</strong>.
GRADUATION RATES* FOR FIRST-YEAR STUDENTSBY GENDER100%90%6-year5-yearMALES80%70%60%50%40%4-year54.2%51.1%53.2%50.6%53.0%51.9%58.0%56.7%65.4%%64.1%56.0%55.0%59.7%58.5%61.3%59.5%6-yearrate notavailableyet57.4%5 and 6-yearrates notavailableyet30%20%10%30.0%34.1%41.0% 40.7%53.2%44.0% 42.1%46.4%42.3% 41.9%0%1999(N = 190)2000(N = 176)2001(N = 183)2002(N = 150)2003(N = 156)2004(N = 191)2005(N = 159)2006(N = 168)2007**(N = 169)2008(N = 172)Entering Fall Term (Number in Cohort)100%90%6-year5-yearFEMALES80%70%60%50%4-year68.2% 67.8%67.0% 66.1%70.5%68.0%64.6%68.9% 66.5% 63.8%71.3%68.9%63.5%63.0%70.5%69.1%6-yearrate notavailableyet61.9%5 and 6-yearrates notavailableyet40%30%20%39.9%44.5%48.1% 47.1% 50.0%56.0%42.9%48.6% 49.2%46.1%10%0%1999(N = 233)2000(N = 245)2001(N = 241)2002(N = 206)2003(N = 240)2004(N = 209)2005(N = 219)2006(N = 220)2007(N = 252)2008(N = 241)Entering Fall Term (Number in Cohort)*Students who withdraw and return are included in their original class. If a student graduates midyear,the additional fall term is counted as another year.**Denotes cohort numbers that have been reduced by one due to the death of a student.Source: Office of Institutional Research and Assessment, September <strong>2012</strong>70
GRADUATION RATES* FOR FIRST-YEAR STUDENTSBY COHORT TYPE100%90%80%70%60%50%40%30%20%10%0%58.0%58.0%30.4% 44.3%1999(N = 69)6-year5-year4-year63.9% 61.8% 63.4%63.9% 60.3% 63.4%2000(N = 61)50.0% 43.9% 50.7% 49.4%2001(N = 68)AFRICAN-AMERICAN STUDENTS***2002(N = 82)64.2%61.2%2003(N = 67)68.2%65.9%2004(N = 85)53.3%52.0%25.3% 43.1% 37.3% 41.3%2005(N = 75)66.7%63.9%2006(N = 72)6-year ratenot availableyet5 and 6-yearrates notavailable yet54.7%2007(N = 75)2008(N = 63)100%90%80%70%60%50%40%30%20%10%0%35.2% 37.4% 42.5% 42.8% 48.0% 48.6% 44.5% 44.9% 47.1% 42.0%1999(N = 332)2000(N = 337)2001(N = 334)ALL OTHER DOMESTIC STUDENTS61.1% 58.5% 60.8% 61.2% 61.7% 59.7%59.6% 57.0%59.3% 59.6%2002(N = 250)61.3%2003(N = 300)58.7%2004(N = 288)62.2%61.5%2005(N = 283)63.2%61.8%2006(N = 285)6-year ratenot availableyet58.8%2007**(N = 323)5 and 6-yearrates notavailable yet2008(N = 324)100%90%80%70%60%50%40%30%20%10%0%86.4% 87.0%86.4%F-1 INTERNATIONAL STUDENTS54.5% 69.6% 68.2% 62.5% 86.2% 70.4% 80.0% 83.9% 68.2% 80.8%1999(N = 22)87.0%2000(N = 23)100%100%2001(N =22)91.7%87.5%2002(N = 24)100%96.6%2003(N = 29)96.3%%%88.9%2004(N =27)90.0%90.0%2005(N = 20)96.8%96.8%2006(N = 31)6-year rate notavailable yet100%2007(N = 22)5 and 6-yearrates notavailable yet2008(N = 26)*Students who withdraw and return and included in their original class. If a student graduates mid-year, theadditional fall term is counted as another year.**Denotes cohort numbers that have been reduced by one due to the death of a student.***Based on those students who identified themselves as “Black or African American alone or in combinationwith another race.Source: Office of Institutional Research and Assessment, September <strong>2012</strong>71
GRADUATION RATES* FOR FIRST-YEAR STUDENTSBY TERRITORY100%90%80%70%60%50%40%30%20%10%0%58.9%33.2% 35.4% 43.7% 41.2% 48.4% 47.7% 38.0% 42.9% 42.6% 39.6%1999(N = 331)6-year5-year4-year56.5%57.7% 55.4%2000(N = 336)61.1% 58.8% 60.6%59.6%2001(N = 332)57.3%2002(N = 274)IN-TERRITORY2003(N = 287)61.1%59.9% 59.4%2004(N = 298)57.6%56.9%2005(N = 295)62.9%61.2%2006(N = 294)6-year ratenot availableyet55.4%2007(N = 333)5 and 6-yearrates notavailable yet2008(N = 303)100%90%80%70%60%50%40%30%20%10%0%6-year5-year4-year68.6%67.1%40.0% 54.8% 44.3% 51.7% 48.8% 53.3% 52.4% 52.4% 58.5% 50.0%1999(N = 70)74.2%72.6%2000(N = 62)60.0%58.6%2001(N = 70)75.9%75.9%2002(N = 58)OUT-OF-TERRITORY67.5%66.3%2003(N = 80)64.0%64.0%2004(N = 75)71.4%71.4%2005(N = 63)68.3%66.7%2006(N = 63)6-year ratenot availableyet71.9%2007**(N = 65)5 and 6-yearrates notavailable yet2008(N = 84)100%90%80%70%60%50%40%30%20%10%0%86.4% 87.0%86.4%F-1 INTERNATIONAL STUDENTS54.5% 69.6% 68.2% 62.5% 86.2% 70.4% 80.0% 83.9% 68.2% 80.8%1999(N = 22)87.0%2000(N = 23)100%100%2001(N =22)91.7%87.5%2002(N = 24)100%96.6%2003(N = 29)96.3%88.9%2004(N =27)90.0%90.0%2005(N = 20)96.8%96.8%2006(N = 31)6-year ratenotavailableyet100%2007(N = 22)5 and 6-yearrates notavailable yet2008(N = 26)*Students who withdraw and return and included in their original class. If a student graduates mid-year, theadditional fall term is counted as another year.**Denotes cohort numbers that have been reduced by one due to the death of a student.Source: Office of Institutional Research and Assessment, September <strong>2012</strong>72
GRADUATION RATES* FOR FIRST-YEAR AFRICAN-AMERICAN*** STUDENTSBY GENDER100%90%6-yearMEN80%70%60%50%40%30%20%10%5-year4-year38.7%30.8%38.7%30.8%22.6%15.4%46.7%46.7%33.3%62.5%62.5%43.8%65.0%%60.0%50.0%62.1%62.1%37.9%37.9%37.9%20.7%68.0%64.0%40.0%6-yearrate notavailableyet56.0%5 and 6-yearrates notavailableyet32.0% 33.3%0%1999(N = 31)2000(N = 13)2001(N = 30)2002(N = 32)2003(N = 20)2004(N = 29)2005(N = 29)2006(N = 25)2007(N = 25)2008(N = 30)100%90%6-year5-yearWOMEN80%70%60%50%40%4-year73.7% 72.9% 73.7%71.1%72.9%73.7%64.0% 63.8%64.0%61.7%71.4%67.9%63.0%60.9%66.0%63.8%6-yearrate notavailableyet54.0%5 and 6-yearrates notavailableyet30%20%10%36.8%52.1%63.2%44.0%51.1%55.4%28.3%44.7%40.0%48.5%0%1999(N = 38)2000(N = 48)2001(N = 38)2002(N = 50)2003(N = 47)2004(N = 56)2005(N = 46)2006(N = 47)2007(N = 50)2008(N = 33)*Students who withdraw and return are included in their original class. If a student graduatesmid-year, the additional fall term is counted as another year.**Denotes cohort numbers that have been reduced by one due to the death of a student.***Students who identified themselves as “Black or African American” alone or in combinationwith another race.Source: Office of Institutional Research and Assessment, September <strong>2012</strong>73
GRADUATION RATES* FOR FIRST-YEAR OTHER DOMESTIC STUDENTSBY GENDER100%90%6-year5-yearMEN80%4-year70%60%50%40%54.8%54.2%50.3% 51.4%53.5% 49.7%50.0% 52.3%61.2%%61.2%51.0%50.4%61.7%60.8%55.2%6-yearrate notavailableyet53.6% 55.2%5 and 6-yearrates notavailableyet30%20%10%29.5%32.9%40.3% 38.3%50.4%42.9% 44.2% 43.2% 44.0%40.0%0%1999(N = 146)2000(N = 149)2001(N = 144)2002(N = 107)2003(N = 121)2004(N = 147)2005(N = 120)2006(N = 125)2007**(N = 134)2008(N = 130)100%90%80%70%60%50%6-year5-year4-year66.1% 64.9%64.5% 62.7%67.9%66.4%66.3% 65.1%WOMEN62.0%61.5%68.8%67.4%62.6%62.0%69.4%68.1%6-yearrate notavailableyet61.4%5 and 6-yearrates notavailableyet40%30%20%39.8% 40.4%44.2% 46.2% 46.4%54.6%44.8% 46.3%49.7%43.3%10%0%1999(N = 186)2000(N = 188)2001(N = 190)2002(N = 143)2003(N = 179)2004(N = 141)2005(N = 163)2006(N = 160)2007(N = 189)2008(N = 194)*Students who withdraw and return are included in their original class. If a student graduatesmid-year, the additional fall term is counted as another year.**Denotes cohort numbers that have been reduced by one due to the death of a student.Source: Office of Institutional Research and Assessment, September <strong>2012</strong>74
GRADUATION RATES* FOR FIRST-YEAR F-1 INTERNATIONAL STUDENTSBY GENDER100%90%80%6-year5-year4-year84.6%78.6%100%100%81.8%MEN100%93.3%93.3%86.7%90.0%90.0%94.4%6-yearrate notavailableyet94.4% 100.0%5 and 6-yearrates notavailableyet70%84.6% 78.6%81.8%60%50%40%30%53.8%64.3%77.8%54.5%80.0%66.7%80.0%72.2%55.6%83.3%20%10%0%1999(N = 13)2000(N = 14)2001(N = 9)2002(N = 11)2003(N = 15)2004(N = 15)2005(N = 10)2006(N = 18)2007(N = 9)2008(N = 12)100%90%80%6-year5-year4-year88.9%100% 100%100%100%WOMEN100% 100%100%92.3%100%91.7%90.0%90.0%100.0%100%6-yearrate notavailableyet100%5 and 6-year ratesnotavailableyet70%88.9%60%50%40%30%55.6%77.8%61.5%69.2%92.9%75.0%80.0%92.3%84.6%78.6%20%10%0%1999(N = 9)2000(N = 9)2001(N = 13)2002(N = 13)2003(N = 14)2004(N = 12)2005(N = 10)2006(N = 13)2007(N = 13)2008(N = 14)*Students who withdraw and return are included in their original class. If a student graduatesmid-year, the additional fall term is counted as another year.Source: Office of Institutional Research and Assessment, September <strong>2012</strong>75
7669GRADUATION RATES* FOR TRANSFER STUDENTS100%6-year90%5-year4-year80%70%60%50%3-year61.8%58.2%75.9%68.1% 75.9%68.1%59.6% 58.6%58.3%58.3%77.3%72.7%68.2%62.5%62.5%58.3%74.1%70.4%66.7%81.0%81.0%61.9%6-yearrate notavailableyet52.4%5 and 6-year ratesnotavailableyet40%30%54.5%54.2%47.6%57.8%4, 5, and 6-year ratesnotavailableyet20%10%23.6% 31.9% 34.5% 25.0% 36.4% 33.3%25.9% 19.0% 19.0%11.5% 21.4%0%1999(N = 55)2000(N = 47)2001(N = 29)2002(N = 24)2003(N = 22)2004(N = 24)2005(N = 27)2006(N = 21)2007(N = 21)2008(N = 26)2009(N = 28)Entering Fall Term (Number in Cohort)*Students who withdraw and return are included in their original class. If a student graduates mid-year, the additional fall term is counted asanother year.Source: Office of Institutional Research and Assessment, September <strong>2012</strong>.
GRADUATION RATES* FOR TRANSFER STUDENTSBY GENDER100%90%80%70%60%50%40%30%20%10%0%66.7%63.0%55.6%25.9%1999(N = 27)74.1%74.1%66.7% 64.3%37.0% 35.7%2000(N = 27)78.6%78.6%2001(N = 14)62.5%62.5%25.0%2002(N = 8)MEN81.8%72.7%45.5%2003(N = 11)50.0%50.0%25.0%2004(N = 12)66.7%66.7% 75.0%33.3%2005(N = 15)83.3%83.3%16.7%2006(N = 12)5 and 6-yearrates notavailableyet6-yearrate notavailableyet60.0%37.5%12.5% 10.0%2007(N = 8)2008(N = 10)6-year5-year4-year3-year4, 5 and6-yearrates notavailableyet13.3%2009(N = 15)Entering Fall Term (Number in Cohort)100%90%6-year5-yearWOMEN80%70%60%50%40%30%4-year3-year57.1%60.0%57.9% 60.0%53.6% 50.0%73.3%73.3% 56.3%56.3%53.3%50.0%72.7%72.7%63.6%75.0% 75.0%75.0% 75.0%66.7%66.7%77.8%77.8%44.4%6-yearrate notavailableyet61.5%53.8%5 and 6-yearrates notavailableyet56.3%4, 5 and6-yearrates notavailableyet20%10%0%21.4%1999(N = 28)25.0%2000(N = 20)33.3%2001(N = 15)25.0% 27.3% 41.7%2002(N = 16)2003(N = 11)2004(N = 12)16.7%2005(N = 12)22.2% 23.1%2006(N = 9)2007(N = 13)12.5%2008(N = 16)30.8%2009(N = 13)Entering Fall Term (Number in Cohort)*Students who withdraw and return are included in their original class. If a student graduates mid-year, theadditional fall term is counted as another year.Source: Office of Institutional Research and Assessment, September <strong>2012</strong>77
NUMBER OF GRADUATES, DEGREES, MAJORS, AND MINORSAcademic Years2007-2008 2008-2009 2009-2010 2010-2011 2011-<strong>2012</strong> TotalGraduates 309 267 289 270 309 1,444(unduplicatedheadcount)Degrees ConferredB.A. 232 197 225 213 231 1,098B.S. 80 70 69 60 82 361TOTAL 312 267 294 273 313 1,459Majors 334 279 327 288 338 1,566(includes doubledegrees anddouble majors)Minors 79 73 64 73 85 374(includes doubleminors)Notes: Totals reflect graduates/degrees conferred/majors from September 1 through July 1 of eachyear. The 2011-<strong>2012</strong> graduates can be broken down by:September 2011 (53),February <strong>2012</strong> (53), andMay <strong>2012</strong> (203).Compiled by the Office of Institutional Research and Assessment, September <strong>2012</strong>78
NUMBER OF MAJORS* AWARDED TO GRADUATESFive-Year HistoryMajor Programs 2007-2008 2008-2009 2009-2010 2010-2011 2011-<strong>2012</strong>African and AfricanAmerican Studies 4 3 2 3 3Agriculture and NaturalResources 8 9 11 9 8Applied Science andAvailable only as an independent major.Mathematics 1 1Art 10 18 9 10 18Asian Studies 1 4 4 3 6Biology 23 20 21 25 18Business Administration 41 26 23 18 41Chemistry 6 4 9 6 8Child and Family Studies 25 18 19 20 22Communication (formerly SpeechCommunication) 13 6 15 19 7Computer andInformation Science 3 3 9 6 7Economics 7 4 7 0 3Education Studies - General 2 6 5 7 9Education – Middle Grades 2 0 2 1 5Elementary Education 11 7 12 11 7English 17 11 14 14 16Foreign Languages 4 12 10 5 11French (1) (2) (1) (0) (1)German (0) (4) (2) (3) (3)Spanish (3) (6) (7) (2) (7)History 12 12 9 7 11Independent Major** 18 17 25 7 11Mathematics 10 7 11 8 9Music 9 4 11 10 7Nursing 19 13 8 15 12Philosophy 8 3 5 2 6Physical Education 11 10 9 12 15Physics 4 2 4 4 2Political Science 5 8 5 7 11Psychology 16 11 13 17 19Religion 4 4 3 3 3Sociology 15 5 7 5 11Technology andIndustrial Arts 17 22 27 18 21Theatre 7 8 11 10 7Women’s and Gender Studies 2 2 7 5 3(formerly Women’s Studies)TOTALS* 334 279 327 288 338*These are duplicative headcounts that include double degrees and double majors. Please see page 78for an unduplicated headcount of graduates.**See page 80 for a more complete description of independent majors.Note: These totals reflect majors from September 1 through July 1 of each year.Compiled by the Office of Institutional Research and Assessment, October <strong>2012</strong>79
INDEPENDENT MAJORS* AWARDED TO GRADUATESAcademic Years 2007 - 2008 through 2011 - <strong>2012</strong>Independent majors are an option available to students who wish to pursue a field of study that cannot bemet through an established <strong>Berea</strong> <strong>College</strong> major program. Students are free to propose majors. Thestudent must secure an independent major adviser. The adviser must be above the rank of instructor anda member of the Teaching Faculty from one of the programs with significant course work included in theproposed major curriculum. After consultation with the independent major advisers regarding availableresources, a tentative curriculum is developed. Approval of the proposal must be obtained from thechairperson/director of all departments and interdisciplinary programs in which two or more courses in themajor are required. Completed proposals are submitted to the Office of Academic Services for review bythe Dean of Curriculum and Student Learning, liaison to the Academic Program Council. The Counciland/or its liaison may accept, reject, or request that the student modify and resubmit the proposal.2007 – 2008: 18 majorsAppalachian Studies (2)Arts AdministrationChild Education and PromotionChild Health StudiesClassical Civilization (2)Classical StudiesCommunity HealthComputer and Information TechnologyDesign for Sustainable DevelopmentEcological DesignInternational StudiesMaternal and Child HealthNutrition and Consumer SciencesPeace and Social Justice Studies (2)Sustainability and Environmental Studies2008 – 2009: 17 majorsAppalachian Studies (2)Child Care ManagementClassical CivilizationComputer and Information ScienceCreative Expressions in Health StudiesEcological Building DesignGerontology StudiesGraphic DesignHealth PromotionInternational StudiesMiddle Grades ED. With Certification in SciencePeace and Social Justice Studies (4)Wilderness Leadership and Emergency Care2009 – 2010: 25 majorsClassical Civilization (5)Classical Studies (2)Community and Human ServicesDance EducationFilm and Theatre StudiesHealth Studies (2)Instructional TechnologyInternational RelationsInternational Studies (3)Outdoor RecreationPeace and Social Justice Studies (5)Pre-Dietetics and NutritionSustainable Agricultural and IndustrialManagement2010 – 2011: 7 majorsAppalachian StudiesGraphic DesignHealth StudiesPeace and Social Justice Studies (3)SENS and Building Design2011- <strong>2012</strong>: 11 majorsAppalachian StudiesEcological DesignEnvironmental StudiesHealth Studies (2)NeurosciencePeace and Social Justice Studies (3)SENS and Building DesignSustainable Community Development*Includes double degrees and double majorsNotes: These totals reflect majors from September 1 through July 1 of each academic year. The followingmajor became a regular major and is no longer an independent major: Computer and InformationScience.Source: Office of Institutional Research and Assessment, September <strong>2012</strong>80
SUMMARY OF GRADUATES’ MAJORS*WITH CONCENTRATIONS5 Year Summary: Academic Years 2007–08 through 2011–12African and African American Studies. ...... 15Foreign Languages, continuedAgriculture and Natural Resources............ 45 German Education 1General 27 Spanish 24SENS 1 Spanish Education 1Sustainable Systems 17 History ................................................. 51Applied Science and Mathematics .............. 2 General 48Art ............................................................ 65 Education 3General 3 Independent** ...................................... 78Included inEducation 3 concentration list is 1 Mathematics ........................................ 45additional concentrationHistory 9 General 43for a total of 66Studio 51 Education 2Asian Studies ............................................. 18 Music ................................................... 41Biology ..................................................... 107 General 30General 69 Education 1Biomolecular, Cellular, Edu - Instrumental 3and Systems 26 Edu - Vocal 3Education 1 Instrumental 3Field and Organismal 11 Keyboard Performance1Business Administration .......................... 149 Voice Performance 1Accounting 68 Nursing ................................................ 67Included inFinance 50concentration list arePhilosophy ........................................... 2446 additionalManagement 50 concentrations for a Physical Education .............................. 57Marketing 27total of 195General 34Chemistry ................................................... 33 Education 6Child and Family Studies ......................... 104Exercise Science/Child Development 39 Sports Medicine 14Early Childhood Educ. 7 Included inWellness/HealthFamily Studies 60 concentration list arePromotion 312 additionalFood, Nutrition, and concentrations for a Physics ................................................ 16Culinary Science 3 total of 116 Political Science .................................. 36Nutrition/Food Studies 7 Psychology .......................................... 76Communication (formerly Speech Religion................................................ 17Communication) .................................. 60 Biblical Studies 10Computer and Information Science ........... 28Religious ThoughtGeneral 23 and Ethics 4Computer Science 5 World Religions 3Economics ................................................. 21 Sociology ............................................. 43General 20 General 41Methods and Models 1 Education 2Education Studies ...................................... 87 Technology and Industrial Arts .......... 105General 29 Education 5Elementary P-5 48 Management 100Middle Grades 5-9 10 Theatre ................................................ 43English ....................................................... 72Women’s and Gender StudiesEducation 5 Included in concentration list (formerly Women’s Studies) ......... 19is 1 additional concentrationLiterature 26for a total of 73Writing 42 GRAND TOTAL MAJORS ............ 1,566Foreign Languages .................................... 42(awarded to 1,444 graduates)French 5German 11*This is a duplicative headcount that includes double degrees and double majors.**Please see page 80 for a more complete description of independent majors.Note: These totals reflect majors from September 1 through July 1 of each academic year.Included inconcentration list is 1additional concentrationfor a total of 42NOTE: In five of the majors with concentrations, therewere 61 students who completed more than oneconcentration within that major. See details above inboxes.Compiled by: Office of Institutional Research and Assessment, October <strong>2012</strong>81
TEACHER PREPARATION<strong>Berea</strong> <strong>College</strong> considers the preparation of teachers one of its major areas of focus. Many programsat <strong>Berea</strong> <strong>College</strong> contribute to the education of teachers. Grounded in seven program goals that areclosely tied to the <strong>College</strong>’s Great Commitments, candidates in <strong>Berea</strong>’s Teacher Education Programare asked to think deeply about the nature of teaching, learning, and schooling.<strong>Berea</strong> <strong>College</strong> offers certification programs in: Elementary Education (primary-grade 5); Middle Grades Education with Teacher Certification in Science or Mathematics (grades 5-9); Secondary Education (grades 8-12) programs in Biology, Chemistry, English, Mathematics,Physics, and Social Studies (with majors in History, Political Science, and Sociology); Primary through grade 12 programs in Art, Health, Instrumental Music, Vocal Music, andPhysical Education; and a grades 5-12 program in Technology Education.The teacher certification programs at <strong>Berea</strong> <strong>College</strong> are accredited by the National Council for theAccreditation of Teacher Education (NCATE) and by the Kentucky Education Professional StandardsBoard.NUMBER OF STUDENTS CERTIFIED IN EDUCATION2007-2008 2008-2009 2009-2010 2010-2011 2011-<strong>2012</strong>Education Studies - General 2 6 5 7 9(no certification)Education – Middle Grades 2 0 2 1 5Elementary Education 11 7 12 11 7Teaching CertificationsArt 0 2 0 0 1Biology 0 0 0 1 0Child and Family StudiesEarly Childhood 3 2 1 0 1Family Consumer Science 0 0 0 0 0English 1 2 0 1 1German 0 1 0 0 0Spanish 0 1 0 0 0History 0 1 0 0 1Mathematics 0 1 0 0 1Music 1 1 1 0 3Physical Education 2 0 1 3 0Sociology 1 0 1 0 0Technology andIndustrial Arts 1 1 0 2 1TOTAL 24 25 23 26 30Source: <strong>Berea</strong> <strong>College</strong> Catalog and Student Handbook, <strong>2012</strong>-<strong>2013</strong>Office of Institutional Research and Assessment, October <strong>2012</strong>82
SUMMARY OF MINORS* AWARDED TO GRADUATES5 Year Summary: Academic Years 2007–08 through 2011–12African and African AmericanStudies/Black Studies 13 (3.5%)Agriculture and NaturalResources 10 (2.7%)Appalachian Studies 7 (1.9%)Art History 8 (2.1%)Asian Studies 12 (3.2%)Business Administration 76 (20.3%)Communication/SpeechCommunication 7 (1.9%)Computer Science 8 (2.1%)Dance 14 (3.7%)Economics 51 (13.6%)French 19 (5.1%)German 10 (2.7%)Health 20 (5.3%)Health Teaching Minor 2 (0.5%)History 18 (4.8%)Latin 7 (1.9%)Music 5 (1.3%)Peace and Social Justice Studies 13 (3.5%)Philosophy 10 (2.7%)Physics 1 (0.3%)Political Science 5 (1.3%)Religion 5 (1.3%)Sociology 7 (1.9%)Spanish 22 (5.9%)Sustainability and EnvironmentalStudies 11 (2.9%)Women’s and Gender Studies/Women’s Studies 13 (3.5%)TOTAL 374 (100.0%)*This is a duplicative headcount that includes double minors. The 374 minors were awarded to 351graduates. The 351 graduates who received a minor represent 24% of the 1,444 graduates duringthis five-year time period.Note: These totals reflect majors from September 1 through July 1 of each year.Compiled by: Office of Institutional Research and Assessment, October <strong>2012</strong>83
NUMBER OF MINORS* AWARDED TO GRADUATESFive-Year HistoryMinors 2007-2008 2008-2009 2009-2010 2010-2011 2011-<strong>2012</strong>African and African AmericanStudies/Black Studies 6 1 1 5 0Agriculture and NaturalResources 1 0 1 3 5Appalachian Studies 2 3 0 0 2Art History n/a n/a n/a 1 7Asian Studies 3 3 2 4 0Business Administration 14 17 17 14 14Communication/SpeechCommunication 0 0 2 2 2Computer Science 1 1 3 3 1Dance 4 3 3 2 2Economics 8 11 9 9 14French 7 2 3 4 3German 3 6 0 1 0Health 4 5 5 5 1Health Teaching 1 0 0 1 0History 3 6 1 3 5Latin 2 0 1 1 3Music 1 0 1 1 2Peace and Social JusticeStudies 2 1 2 4 4Philosophy 0 5 0 3 2Physics 0 0 0 0 1Political Science 0 0 2 1 2Religion 2 1 1 1 0Sociology 5 0 2 0 0Spanish 7 1 4 2 8Sustainability andEnvironmental Studies 1 5 1 0 4Women’s Studies 2 2 3 3 3TOTAL 79 73 64 73 85*These are duplicative headcounts that include double minors.Note: These totals reflect majors from September 1 through July 1 of each year.Compiled by the Office of Institutional Research and Assessment, October <strong>2012</strong>84
MAJORS* AWARDED TO GRADUATES BY GENDER5 Year SummaryAcademic Years2007 - 2008 through 2011 - <strong>2012</strong>Males Females TotalN % N % N % of Grand TotalAfrican and African AmericanStudies 6 40% 9 60% 15 1.0%Agriculture and NaturalResources 20 44% 25 56% 45 2.9%Applied Science andMathematics (first grad: 2010-11) 2 100% 0 0% 2 0.1%Art 17 26% 48 74% 65 4.2%Asian Studies 10 56% 8 44% 18 1.1%Biology 27 25% 80 75% 107 6.8%Business Administration 74 50% 75 50% 149 9.5%Chemistry 15 45% 18 55% 33 2.1%Child and Family Studies 12 12% 92 88% 104 6.6%Communication (2011-12)/Speech Communication 24 40% 36 60% 60 3.8%Computer and InformationScience 27 96% 1 4% 28 1.8%Economics 14 67% 7 33% 21 1.3%Education StudiesGeneral 8 28% 21 72% 29 1.9%Elementary Education 4 8% 44 92% 48 3.1%Middle Grades Education 4 40% 6 60% 10 0.6%English 20 28% 52 72% 72 4.6%Foreign LanguagesFrench 1 20% 4 80% 5 0.3%German 5 42% 7 58% 12 0.8%Spanish 4 16% 21 84% 25 1.6%History 24 47% 27 53% 51 3.3%Independent** 26 33% 52 67% 78 5.0%Mathematics 32 71% 13 29% 45 2.9%Music 20 49% 21 51% 41 2.6%Nursing 8 12% 59 88% 67 4.3%Philosophy 17 71% 7 29% 24 1.5%Physical Education 31 54% 26 46% 57 3.6%Physics 13 81% 3 19% 16 1.0%Political Science 21 58% 15 42% 36 2.3%Psychology 19 25% 57 75% 76 4.9%Religion 12 71% 5 29% 17 1.1%Sociology 6 14% 37 86% 43 2.7%Technology and IndustrialArts 83 79% 22 21% 105 6.7%Theatre 16 37% 27 63% 43 2.7%Women’s and GenderStudies (2011-12)/ 0 0% 19 100% 19 1.2%Women’s studiesGRAND TOTAL* 622 40% 944 60% 1,566 100.0%* These are duplicative headcounts that include double degrees and double majors. The 1,566 majorsrepresent 1,444 graduates during this five-year time period.**Please see page 80 for a more complete description of independent majors.Note: These totals reflect majors from September 1 through July 1 of each year.Compiled by: Office of Institutional Research and Assessment, September <strong>2012</strong>85
86MAJORS* AWARDED TO GRADUATES BY COHORT TYPE5 Year Summary: Academic Years 2007– 2008 through 2011 – <strong>2012</strong>African American** All Other Domestic F-1 International TotalN (%) N (%) N (%) N (%)African and African American Studies 13 (87%) 2 (13%) 0 (0%) 15 (1.0%)Agriculture and Natural Resources 1 (2%) 44 (98%) 0 (0%) 45 (2.9%)Applied Science and Mathematics (first grad: 10-11) 0 (0%) 1 (50%) 1 (50%) 2 (0.1%)Art 3 (5%) 60 (92%) 2 (3%) 65 (4.2%)Asian Studies 2 (11%) 16 (89%) 0 (0%) 18 (1.1%)Biology 24 (22%) 74 (69%) 9 (8%) 107 (6.8%)Business Administration 19 (13%) 91 (61%) 39 (26%) 149 (9.5%)Chemistry 4 (12%) 17 (52%) 12 (36%) 33 (2.1%)Child and Family Studies 21 (20%) 81 (78%) 2 (2%) 104 (6.6%)Communication (11-12)/Speech Communication 16 (27%) 42 (70%) 2 (3%) 60 (3.8%)Computer and Information Science 0 (0%) 23 (82%) 5 (18%) 28 (1.8%)Economics 1 (5%) 6 (29%) 14 (67%) 21 (1.3%)Education StudiesGeneral 8 (28%) 19 (66%) 2 (7%) 29 (1.9%)Elementary Education Certification 6 (13%) 42 (88%) 0 (0%) 48 (3.1%)Middle Grades Education Certification 1 (10%) 9 (90%) 0 (0%) 10 (0.6%)English 9 (13%) 63 (88%) 0 (0%) 72 (4.6%)Foreign LanguagesFrench 0 (0%) 4 (80%) 1 (20%) 5 (0.3%)German 1 (8%) 9 (75%) 2 (17%) 12 (0.8%)Spanish 3 (12%) 22 (88%) 0 (0%) 25 (1.6%)History 7 (14%) 44 (86%) 0 (0%) 51 (3.3%)Independent*** 7 (9%) 66 (85%) 5 (6%) 78 (5.0%)Mathematics 2 (4%) 17 (38%) 26 (58%) 45 (2.9%)Music 10 (24%) 29 (71%) 2 (5%) 41 (2.6%)Nursing 12 (18%) 42 (63%) 13 (19%) 67 (4.3%)Philosophy 5 (21%) 19 (79%) 0 (0%) 24 (1.5%)Physical Education 15 (26%) 41 (72%) 1 (2%) 57 (3.6%)Physics 1 (6%) 6 (38%) 9 (56%) 16 (1.0%)Political Science 6 (17%) 22 (61%) 8 (22%) 36 (2.3%)Psychology 9 (12%) 62 (82%) 5 (7%) 76 (4.9%)Religion 1 (6%) 16 (94%) 0 (0%) 17 (1.1%)Sociology 10 (23%) 31 (72%) 2 (5%) 43 (2.7%)Technology and Industrial Arts 21 (20%) 82 (78%) 2 (2%) 105 (6.7%)Theatre 17 (40%) 26 (60%) 0 (0%) 43 (2.7%)Women’s and General Studies(11-12)/Women’s Std. 5 (26%) 14 (74%) 0 (0%) 19 (1.2%)TOTAL* 260 (17%) 1,142 (73%) 164 (10%) 1,566 (100%)* These are duplicative headcounts that include double degrees and double majors. The 1,566 majors represent 1,444 graduates during this five-year time period.**Includes students who identified themselves as “Black or African American” alone or in combination with another race.***Please see page 80 for a more complete description of independent majors.Note: These totals reflect graduates from September 1 through July 1 of each year. Percentages may not total 100% due to rounding.Compiled by: Office of Institutional Research and Assessment, September <strong>2012</strong>.
87MAJORS* AWARDED TO GRADUATES BY GENDER5 Year History2007 – 2008 2008 – 2009 2009-2010 2010-2011 2011-<strong>2012</strong>Major Programs Male Female Total Male Female Total Male Female Total Male Female Total Male Female TotalAfrican and AfricanAmerican Studies 2 2 4 0 3 3 1 1 2 2 1 3 1 2 3Agriculture and NaturalResources 4 4 8 4 5 9 5 6 11 4 5 9 3 5 8Applied Science/Mathematics 1 0 1 1 0 1Art 4 6 10 3 15 18 1 8 9 2 8 10 7 11 18Asian Studies 1 0 1 4 0 4 1 3 4 1 2 3 3 3 6Biology 7 16 23 5 15 20 2 19 21 7 18 25 6 12 18Business Administration 21 20 41 13 13 26 11 12 23 8 10 18 21 20 41Chemistry 3 3 6 2 2 4 5 4 9 4 2 6 1 7 8Child and Family Studies 1 24 25 2 16 18 2 17 19 5 15 20 2 20 22Communication** 3 10 13 2 4 6 7 8 15 9 10 19 3 4 7Computer and InformationScience 3 0 3 3 0 3 9 0 9 5 1 6 7 0 7Economics 7 0 7 1 3 4 4 3 7 0 0 0 2 1 3Education StudiesGeneral 0 2 2 3 3 6 2 3 5 0 7 7 3 6 9Elementary 1 10 11 0 7 7 2 10 12 1 10 11 0 7 7Middle 1 1 2 0 0 0 1 1 2 0 1 1 2 3 5English 2 15 17 5 6 11 4 10 14 4 10 14 5 11 16Foreign Languages 1 3 4 4 8 12 2 8 10 2 3 5 1 10 11History 7 5 12 8 4 12 3 6 9 3 4 7 3 8 11Independent*** 5 13 18 6 11 17 11 14 25 1 6 7 3 8 11Mathematics 10 0 10 4 3 7 7 4 11 4 4 8 7 2 9Music 4 5 9 2 2 4 5 6 11 5 5 10 4 3 7Nursing 2 17 19 3 10 13 2 6 8 1 14 15 0 12 12Philosophy 6 2 8 1 2 3 4 1 5 2 0 2 4 2 6Physical Education 7 4 11 3 7 10 3 6 9 5 7 12 13 2 15Physics 3 1 4 2 0 2 4 0 4 2 2 4 2 0 2Political Science 2 3 5 6 2 8 2 3 5 4 3 7 7 4 11Psychology 3 13 16 3 8 11 5 8 13 2 15 17 6 13 19Religion 3 1 4 2 2 4 3 0 3 1 2 3 3 0 3Sociology 2 13 15 0 5 5 2 5 7 1 4 5 1 10 11Technology andIndustrial Arts 16 1 17 16 6 22 22 5 27 14 4 18 15 6 21Theatre 6 1 7 1 7 8 4 7 11 3 7 10 2 5 7Women’s and GenderStudies** 0 2 2 0 2 2 0 7 7 0 5 5 0 3 3TOTAL* 334 279 327 288 338*These are duplicative headcounts that include double degrees and double majors. Please see page 78 for an unduplicated headcount.** Change in major name: Speech Communication to Communications and Women’s Studies to Women’s and Gender Studies.**Please see page 81 for a more complete description of independent majors.Note: These totals reflect majors from September 1 through July 1 of each year.Compiled by: Office of Institutional Research and Assessment, September <strong>2012</strong>.
GRADUATE TRENDSGraduates by Gender100%90%80%70%59% 59% 61% 64% 61% 61% 61% 60%64%59%60%50%40%30%20%41% 41% 39% 36% 39% 39% 39% 40%36%41%10%0%AcademicYear2002 - 2003 2003 - 2004 2004 - 2005 2005 - 2006 2006 - 2007 2007 - 2008 2008 - 2009 2009 - 2010 2010 - 2011 2011 - <strong>2012</strong>MalesFemalesGraduates by Cohort Type100%90%7% 8% 7% 8% 10% 8% 9% 11%6%10%80%70%60%50%81% 76% 76% 75% 73% 74%77%70% 79% 72%40%30%20%10%0%AcademicYear12%16% 16% 18% 17% 18%NOTE: African-American students include students who identified themselves as “Black or African American” alone or incombination with another race.*Includes Permanent Residents (non-citizens, including refugees and asylees who have formally established residency in theU.S.) and U.S. citizens living in foreign countries.Source: Office of Institutional Research and Assessment, October <strong>2012</strong>8814%20%15% 18%2002 - 2003 2003 - 2004 2004 - 2005 2005 - 2006 2006 - 2007 2007 - 2008 2008 - 2009 2009 - 2010 2010 - 2011 2011 - <strong>2012</strong>African-AmericanStudents*All Other Students*(Excluding F-1 International)F-1 InternationalStudents
Graduate Trends, continuedGraduates by Territory100%90%7% 8% 7% 8% 10% 8% 9% 11%6%10%80%20% 20%17% 18%20% 23% 22% 21%22%21%70%60%50%40%30%73% 72%76% 74%69% 69% 69% 68%71% 69%20%10%0%AcademicYear2002-2003 2003-2004 2004-2005 2005-2006 2006-2007 2007-2008 2008-2009 2009-2010 2010-2011 2011-<strong>2012</strong>In-Territory Out-of-Territory F-1 InternationalSource: Office of Institutional Research and Assessment, October <strong>2012</strong>89
EDUCATION ABROADFrom the <strong>Berea</strong> <strong>College</strong> Catalog and Student Handbook, <strong>2012</strong>-<strong>2013</strong>:The Francis and Louise Hutchins Center for International Education (CIE) at <strong>Berea</strong> <strong>College</strong> fostersunderstanding of, and respect for, all peoples of the earth. Many of the Eight Great Commitments of<strong>Berea</strong> <strong>College</strong> are achieved through international education – an integral part of a strong liberal-artscurriculum. The <strong>College</strong> prepares students to take an active role in global society by undertaking avariety of initiatives to help its students - tomorrow’s leaders - strengthen their internationalawareness. International education for <strong>Berea</strong> students takes place both on campus and abroad inmany ways, including: encouraging international perspectives in course work and curriculum acrossthe disciplines; hosting students, faculty, and guest lecturers from around the world; organizing avariety of programs that bring artists, musicians, and speakers from other countries to campus; andencouraging all students to participate in academically rigorous, cross-cultural, education-abroadprograms. The <strong>Berea</strong> <strong>College</strong> CIE is the campus focal point for international education.BEREA COLLEGE EDUCATION ABROAD PARTICIPANTSACADEMIC YEARS 2007 - 2008 THROUGH 2011 - <strong>2012</strong>Number of Participants for Academic YearLength of TimeSpent Abroad 2007-2008 2008-2009 2009-2010 2010-2011 2011-<strong>2012</strong>Full Year 2 0 0 0 0Semester 26 23 18 26 18Short Term 171 132 72 ** **Summer 58 63 32 111 115TOTAL 257 218 122 137 133Percent of Studentswho Participated*: 25% 22% 12% 13% 12%*The percentages above are based on the number of participants divided by the average of the Falland Spring full-time upperclassmen (sophomores, juniors, and seniors) degree-seeking studentenrollment.** The <strong>College</strong> changed their academic calendar from a 4-1-4 system to a semester system. Thischange eliminated the “Short Term.”Source: <strong>Berea</strong> <strong>College</strong> Catalog and Student Handbook, <strong>2012</strong> – <strong>2013</strong>Center for International Education, November <strong>2012</strong>90
EDUCATION ABROAD PARTICIPANTSBY PROGRAM/SPONSOR AND COUNTRYAcademic Year 2011 – <strong>2012</strong>Number ofParticipantsNumber ofParticipantsAcademic Year (0) 0Semester (18)BMW Math GrantScotland 1Department of Foreign LanguagesGermany 2Mexico 3Spain 2ExchangesJapan 1GEO ScholarshipAustralia 1Jamaica 1North Ireland 2Peru 1Spain 2Uganda 1IndependentMexico 1Summer (115)CAUX ScholarsSwitzerland 2Faculty-Led <strong>Berea</strong> CoursesFrance 20Ghana 22Greece 10Turkey 18Faculty-Led ResearchHonduras 4Summer, continued:Kentucky Institute for InternationalStudies (KIIS)Argentina 1Austria 13Czech Republic 1Ecuador 1Greece 2Japan 1Mexico 2Spain 1Non <strong>Berea</strong>/Non KIISCosta Rica 2Greece 1Italy 2Scotland 1Non-Credit Service: Campus ChristianCenterChina 1Nigeria, Burkina Faso 1Non-Credit Service: Bonner ScholarsGhana 1Italy 1Mexico 1Turkey 1Internships for CreditGhana 1Honduras 1Italy 2Mexico 1TOTAL 133Source: Center for International Education, October <strong>2012</strong>91
ACADEMIC CREDIT INTERNSHIPSInternships, housed in the Center for Transformative Learning, is an experiential education programdesigned to allow students to learn and earn academic credit while gaining practical, professionalexperience in the workplace. Rising sophomores, juniors, and seniors in good standing are eligible,although typically it is rising juniors and seniors who participate. Students identify and apply forinternship positions in fields related to their career interest with support and assistance from theOffice of Internships.Although employers are encouraged to offer paid positions, most internships are unpaid by theorganization. As a result, the <strong>College</strong> provides financial support to help make it possible for eligiblestudents to participate in unpaid internships. Most students participate in summer internshipsbecause of time constraints during the fall and spring semesters, given the location of the campusand class and labor schedules.Internships help students define/clarify their career paths, gain career-related experience, makevaluable networking contacts, and may lead to a job upon graduation. Students are encouraged tomake an internship part of their <strong>Berea</strong> <strong>College</strong> experience.Fast <strong>Fact</strong>s(from Summer <strong>2012</strong> survey; 77-80% response rate)Of <strong>Berea</strong> Students, 33% who did an internship in the summer of <strong>2012</strong> reported that they received a full-time job offerfrom the organization 29% were in internships fully or partially paid by the organization 84% received full or partial funding from <strong>Berea</strong> 8% participated in internships in international settings 86% report that they are better prepared to enter the professional world as a result of theirinternship experience 83% reported that the internship experience provided a realistic view of their career field 87% reported that they achieved the learning goals specified in their internship proposals 100% rated their overall internship experience as excellent, very good, or good (61%, 29%, and10% respectively)NUMBER OF INTERNSHIPSAcademic Years 2007 - 2008 through 2011 – <strong>2012</strong>Term 2007 - 2008 2008 - 2009 2009 – 2010 2010-2011 2011-<strong>2012</strong>***Fall 9 2 0 4 3Short 29 26 37 ** **Spring 2 4 1 6 3Summer 82 100 95 99 125TOTAL 122 132 133 109 131Percent of Studentswho Participated*: 12% 13% 13% 10% 12%NOTE: Many other students participate in internships that do not involve academic credit.*The percentages above are based on the number of participants divided by the average of the Fall and Spring full-timeupperclassmen (sophomores, juniors, and seniors) degree-seeking student enrollment.** The college changed their academic calendar from a 4-1-4 system to a semester system. This change eliminated the“Short Term.”*** 2011-<strong>2012</strong> includes 12 off-campus Undergraduate Research Internships.Source: Office of Internships, November <strong>2012</strong>92
SERVICE-LEARNINGCenter for Excellence in Learning through Service (CELTS) and the Service-Learning ProgramThe Center for Excellence in Learning through Service (CELTS) coordinates the <strong>College</strong>’s academic servicelearningand community service programs, including a Bonner Scholars Program. The work of CELTS buildsupon <strong>Berea</strong>’s commitment to promote the Christian ethic of service and to serve the Appalachian region. In 2011-12, 34% of <strong>Berea</strong> <strong>College</strong> students participated in at least one service-learning or service activity.Co-curricular Community ServiceThrough their labor positions, students work in teams to lead service programs and coordinate co-curricularservice activities for student volunteers, including tutoring young children, mentoring at-risk teens, visiting eldersat long-term care facilities, helping to build houses for low-income families, organizing the annual communitywideHunger Hurts food drive, and taking on environmental and social-justice issues.Academic Service-LearningService-learning at <strong>Berea</strong> <strong>College</strong> is an educational experience based upon a collaborativepartnership between college and community. Learning through service enables students toapply academic knowledge and critical-thinking skills to meet genuine community needs.Through reflection and assessment, students gain deeper understanding of course contentand the importance of civic engagement. (<strong>Berea</strong> <strong>College</strong> definition of Service-Learning)Service-learning is a pedagogy through which students complete projects in cooperation with community-basedorganizations, as part of assigned coursework. These projects allow them to achieve academic learning goals byworking with local leaders to address community issues. Critical reflection is often called “the hyphen” in servicelearning,as it facilitates deeper learning by helping students to draw connections between the service andlearning experiences. Service-learning also facilitates the exchange of ideas, knowledge, and resources between<strong>Berea</strong> <strong>College</strong> and the community.Service-learning courses are taught each term in a variety of disciplines at <strong>Berea</strong> <strong>College</strong>. Designated Service-Learning Courses meet the Active Learning Experience (ALE) requirement in the General Education Program.NUMBER OF SERVICE-LEARNING COURSES AND PROJECTS,ACADEMIC PROGRAMS AND COMMUNITY PARTNER ORGANIZATIONS2007-08 2008-09 2009-10 2010-11 2011-12Courses and Projects 29 19 23 19 15Academic Programs Represented 16 13 16 17 15Community Partner Organizations 35 25 31 19 16Recent Community Partner Organizations, 2007 - <strong>2012</strong>:<strong>Berea</strong> Community Food Bank<strong>Berea</strong> Community School<strong>Berea</strong> Faith Community Outreach<strong>Berea</strong> Tourism CommissionClearfork Community InstituteEastern Kentucky Child Care CoalitionFarristown Middle School Youth Service CenterFoley Middle School Youth Service CenterHabitat for Humanity of Madison and Clark CountiesHead Start of Madison CountyHighlander Research and Education CenterHome Energy PartnersHope’s Wings for Domestic Violence ShelterHospice Care PlusKentuckians for the CommonwealthKentucky Association of Food BanksKentucky Environmental FoundationLeague of Women Voters of <strong>Berea</strong> and Madison CountyMadison County Cooperative Extension AgencyMadison County Health DepartmentMadison Southern High SchoolMACED (Mountain Association forCommunity and Economic Development)New Opportunity School for WomenPeacecraftProject ReadSouth Madison County Family Resource CenterSustainable <strong>Berea</strong>Source: Center for Excellence in Learning through Service (CELTS), November <strong>2012</strong>93
UNDERGRADUATE RESEARCH AND CREATIVE PROJECTS PROGRAMThe Undergraduate Research and Creative Projects Program (URCPP) was developed toprovide students in all majors learning opportunities not ordinarily found in courses or other formsof experiential learning. Typically, two or three students and a faculty mentor would engage aproject for eight to ten weeks during the summer. The central purpose should be to provideopportunities for students to experience research and creative activity through the structure of anapprentice-mentor relationship. This purpose requires that faculty mentors go beyondsupervising student learning to working alongside students in providing active models of howresearch and creative processes are engaged. The purpose also implies that projects will bechosen very carefully and structured to satisfy two conditions:1. Projects must be accessible to genuine student involvement. That is, students must becapable of understanding the project’s meaning and significance, and they must be capableof making creative contributions to project work. Absent these conditions, students have noopportunity to actually experience the nature of research and creative activity.2. Projects must also be at a level that elicits faculty involvement in research and creativeprocesses. That is, the project itself should be at a level expected of faculty professionals.This allows the faculty mentor to provide a model for engaging research and creativeactivity. In this regard, proposals should contain adequate background informationestablishing possible contributions of the faculty/student research to the current body ofknowledge in the area of interest.The goals of the program include:to enhance student learning by providing opportunities to engage challenging,collaborative and directed projects in an apprentice-mentor relationship with faculty;to foster student-faculty interaction in creative work;to help students understand the interplay between collaboration and independent thoughtand action in a complex, open-ended project;to enhance students’ communication skills;to provide experience that would be helpful to students who wish to pursue subsequentresearch and learning opportunities (e.g., off-campus, summer research programs orinternational learning opportunities);to allow students to build their self-confidence to pursue careers and further study beyond<strong>Berea</strong>; andto supply experience that will help students make informed career and graduate schooldecisions.Number of Undergraduate Research and Creative Projects and Participants*Number of Number of Number ofSummer Projects Faculty Students*2008 19 22 392009 8 8 19**2010 14 14 352011 15 15 33<strong>2012</strong> 15 19 38*Other students may have participated in the program but were funded by sources other than the URCPP budget.Additional department-approved undergraduate research experiences take place on and off campus, as well.**One project with one faculty member and one student was discontinued mid-summer when the student transferred.Source: Office of the Academic Vice President and Dean of the Faculty, September <strong>2012</strong>94
THE LABOR SUPERVISOR OF THE YEAR AWARDMembers of the student body are asked to submit recommendations for the Outstanding LaborSupervisor on campus. Because departments vary in the number of students an individual (faculty/staff)may be asked to supervise, more than one award may be appropriate. Therefore, the Labor ProgramOffice has categorized eligibility based on the number of students supervised. Provided there are enoughnominations submitted per category, there may be up to three labor supervisors of the year selected. TheAward Selection Committee consists of five to seven individuals (faculty/staff) from within the campuscommunity. The award and/or awards will be presented in the form of gift certificates and plaques.Recipients of the Labor Supervisor of the Year AwardNames of current <strong>Berea</strong> <strong>College</strong> faculty and/or staff members are italicized.Janet Tronc 2005Deloris Coleman 2006Linda Reynolds 2006Loretta Reynolds 2007Dave Porter 2008Larky Kim Crawford 2008Sandy Wells 2009Leslie Kaylor 2009Anthony BashamLarky Kim CrawfordJeanette Davidson2010 (Supervising 1-15 students)2010 (Supervising 16-30 students)2010 (Supervising 31+ students)Bob Harned 2011David Slinker <strong>2012</strong>Source: Labor Program Office, September <strong>2012</strong>95
SUMMARY OF LABOR CONTRACT ASSIGNMENTSBY DEPARTMENTAL CATEGORIESFALL <strong>2012</strong>(As of August <strong>2012</strong>)Primary Positions OnlyAll Degree-Seeking Total Hours Mean HoursFirst-Year Transfer Students* Contracted ContractedDepartmental Categories Students Students Primary Secondary Per Week Per WeekAcademic Support 20 3 129 54 1,678 9.17Alumni and <strong>College</strong> Relations 16 0 62 11 717 9.82Auxiliary Enterprises: Residence 109 8 204 10 2,319 10.84Halls (maintenance crews)Food Service<strong>College</strong> Community Service 22 2 94 8 1,065 10.44<strong>College</strong> Related 0 0 4 0 40 10.00Community Partnerships 3 0 12 0 142 11.83General and Administrative 28 5 132 5 1,497 10.93Instruction 52 7 392 109 4,914 9.81Plant Operations 50 6 113 3 1,217 10.49Student Industries: Crafts 30 10 103 4 1,095 10.23Student Industries: Services 6 2 40 5 458 10.18Student Services 55 4 295 38 3,788 11.38No Labor** 0 0 18 n/a - -SUB-TOTAL 391 47 1,598 247 - -No Status Form*** 0 0 6 n/a - -TOTAL 391 47 1,604 247 18,930 10.36369 - Extended primary position for more than ten hours per week.59 - Extended primary position for more than ten hours per week with a secondary position.183 - Contracted in both a primary and at least one secondary position.608 - Contracted for more than ten hours a week.*Includes first-year and transfer students**Includes degree-seeking students who are excused from labor for various reasons such as offcampusopportunities and student teaching.***Includes students who have withdrawn from school during the first week of class.NOTES: 1. For a breakdown of departments within the various categories, please see the next two pages.2. Minimum Labor Requirements: 10 hours per week for the full term3. Pay Ranges, <strong>2012</strong>– <strong>2013</strong>: $ 4.00 - $ 6.40; Unclassified $ 6.60Compiled by: Office of Institutional Research and Assessment, November <strong>2012</strong>96
LABOR DEPARTMENTSAcademic SupportAcademic ServicesAppalachian CenterBlack Culture CenterCareer DevelopmentCenter for International EducationConvocationsDraper Building Office ServicesEnvironmental Health and SafetyHutchins LibraryInternship OfficeLearning CenterScience LibraryStudent Support ServicesAlumni and <strong>College</strong> RelationsAlumni Relations<strong>College</strong> RelationsIntegrated Marketing and CommunicationAuxiliary Enterprises: Residence Halls (Only includes Dorm Maintenance Crews), Food ServiceAnna SmithBinghamBlue RidgeDanaDanforthEcovillageEdwardsElizabeth RogersFairchildJamesKentuckyKetteringPearsonsSeabury Residence HallTalcottFood Service<strong>College</strong> Community ServiceCELTS (Center for Excellence in Learning through Service)Adopt-a-Grandparent Hispanic Outreach Project (H.O.P) TRIO Programs<strong>Berea</strong> Buddies Micah 6 Transportation Project Upward Bound<strong>Berea</strong> Teen Mentoring One-on-One Tutoring Math and ScienceBonners Scholars Program People Who Care Woodson InstituteFirst <strong>Book</strong>-Madison County Students for Appalachia (SFA)Habitat for HumanitySummer Tutoring ProgramsHEALExternal Sponsored ProgramsGear Up Appalachia<strong>College</strong> RelatedBrushy Fork InstituteConference ServicesCommunity Partnerships (only includes projects to which students are assigned this academic year)ConsultwebsMACEDPeacecraftSave the ChildrenSustainable <strong>Berea</strong>General and AdministrativeChild Development Lab<strong>College</strong> Post OfficeFinancial AffairsInformation Systems and ServicesInstitutional Research and AssessmentOffice of People ServicesOffice of the Academic Vice PresidentOffice of the PresidentOffice of the Vice President for Operations andSustainabilityPrinting Services97
Labor Departments, continuedInstructionAfrican and African American StudiesAgriculture and Natural ResourcesArtBiologyBusinessChemistryChild and Family StudiesCommunicationComputer and Information ScienceEconomicsEducation StudiesEnglishEntrepreneurship for Public Good (EPG) ProgramForeign LanguagesGeneral EducationHistoryMathematicsMusicNursingPhilosophyPhysical Education and HealthPhysicsPolitical SciencePsychologyReligionSENS ProgramSociologyTechnology and Applied DesignTheatreTheatre LabWomen’s and Gender StudiesPlant OperationsCampus GardenersFacilities Management OfficeForest Property ManagementMaintenancePublic BuildingsSolid Waste and RecyclingStudent Industries: CraftsBoone Tavern Gift ShopBroomcraftCeramicsLog House Craft GalleryStudent Crafts Distribution CenterStudent Crafts on the SquareWeavingWoodcraftStudent Industries: ServicesBoone Tavern Hotel<strong>College</strong> <strong>Book</strong>storeStudent ServicesAdmissions OfficeAthletic DepartmentCampus Christian Center tCampus Life/Recreation and Wellness<strong>Berea</strong> BikesCampus Activities Board (CAB)ChimesIntramuralsOffice StaffPinnacleStudent Government Association (SGA)<strong>College</strong> Health ServiceCounseling and Disability ServicesLabor Program OfficeOffice of the Vice President for Labor andStudent LifePublic SafetySeabury CenterStudent Financial Aid ServicesStudent Life – Residence Halls/Family HousingStudent PayrollStudent Service CenterComplied by the Office of Institutional Research and Assessment, November <strong>2012</strong>98
Average Hours WorkedAVERAGE HOURS WORKED PER WEEKBY STUDENT CLASSIFICATION1614121086420Fall 2007 Fall 2008 Fall 2009 Fall 2010 Fall 2011Freshman 11.47 11.48 11.17 10.79 11.18Sophomore 13.41 13.13 12.27 11.82 12.45Junior 13.96 14.45 13.02 12.64 13.34Senior 14.53 14.13 13.69 13.16 13.60All Students 13.34 13.30 13.08 12.54 12.64Source: Office of Student Financial Aid Services, October <strong>2012</strong>99
100COST OF EDUCATION AND OTHER STUDENT COSTSAcademic Year Academic Year Academic Year Academic Year Academic Year2008-2009 2009-2010 2010-2011 2011-<strong>2012</strong> <strong>2012</strong>-<strong>2013</strong>Cost Of Education (COE)* $ 24,500 $ 25,500 $ 24,100 $ 21,300 $ 20,900Registration Costs:Room 3,082 3,082 2,910 3,012 3,102Board 2,686 2,686 2,664 2,780 2,864Accident Fund 20 20 20 20 20Campus Activities Fee 50 50 50 50 50Chimes (School Yearbook) 34 34 34 34 34Health Fee 100 100 100 100 100Health Insurance 340 350 384 384 414Pinnacle (School Paper) 12 12 12 12 12Student Government Association 10 10 10 10 10Technology Fee** 300 300 300 300 340SUBTOTAL $ 6,634 $ 6,644 $ 6,484 $ 6,702 $ 6,946Average other Costs:<strong>Book</strong>s and Supplies 750 750 750 700 700Personal 1,376 1,376 1,376 1,376 1,400Transportation 400 426 426 426 450SUBTOTAL $ 2,552 $ 2,552 $ 2,502 $ 2,502 $ 2,550TOTAL STUDENT COST $ 9,186 $ 9,196 $ 8,986 $ 9,204 $ 9,496*Cost of Education (COE) is provided by the <strong>College</strong> (not the student) from the endowment, gifts, scholarships, and grants brought by students. COE coversexpenses related to the faculty and staff, library, support services, etc.; it does not include costs of development and alumni programs.**Every student is equipped with a laptop computer provided by the <strong>College</strong> as part of the Universal Access Project. Students are expected to pay to offset thecost of networking all residence hall rooms, making classrooms usable for laptops, supplying and supporting software, and providing additional training to students.The laptop computer will become the property of the student at graduation.Source: Office of Student Financial Aid Services, October <strong>2012</strong>.
DollarsTOTAL STUDENT COST$26,000$24,000$22,000$20,000$18,000$16,000$14,000$12,000$10,000$8,000$6,000$4,000$2,000$0Cost of EducationRegistration CostsAverage Other Costs2008-2009 2009-2010 2010-2011 2011-<strong>2012</strong> <strong>2012</strong>-<strong>2013</strong>Academic YearLegendCost of Education (COE) is provided by the <strong>College</strong> (not the student) from the endowment, gifts,scholarships and grants brought by students. COE covers expenses related to the faculty andstaff, library, support services, etc.; it does not include costs of development and alumniprograms.Registration Costs include room, board, accident fund, campus activities fee, Chimes (schoolyearbook), health fee, Pinnacle (school paper), technology fee, health insurance and studentgovernment association fees. For more details, please see page 100.Average Other Costs include books and supplies, personal expenses, and transportation costs.For more details, please see page 100.Source: Office of Student Financial Aid Services, October, <strong>2012</strong>101
ALUMNI ASSOCIATION EXECUTIVE COUNCILACADEMIC YEAR <strong>2012</strong>-<strong>2013</strong>Executive CommitteePresidentLowell Hamilton, ‘61AlabamaPresident ElectTimothy B. Jones, ‘94KentuckyPast PresidentLarry Woods, ‘75KentuckyPresident of <strong>Berea</strong> <strong>College</strong>Dr. Lyle D. RoelofsKentuckyDirector of Alumni Relations(position currently vacant)VP for Alumni and <strong>College</strong> RelationsMichelle JanssenKentuckyTrustees, including year his/her term ends2014: Vicki Allums, ‘79 2015: Lynne Blankenship Caldwell, ‘78VirginiaVirginia2016: Jerry Hale, ‘73 2017: Robert F. Hawks, ‘77TennesseeGeorgiaMembers-At-Large, including year his/her term ends<strong>2013</strong>: Jason Cody, ’94 David Cook, ‘85TennesseeKentuckyCara Stewart Green, ’03Kentucky2014: Cheryl Ferguson, ’97 Crystal Baldwin Grewe, ’94OhioVermontMichael Murphy, ‘84 Ronnie Nolan, ‘95CaliforniaKentucky2015: Wally Campbell, ‘66 Paul Clawson, ‘03KentuckyColoradoBetina Conley Gardner, ’94 Andrew Hamilton, ‘96KentuckyTexas2016: Eric Crowden, ’84 Patricia Campbell Estepp, ‘77KentuckyVirginiaJack S. Marinelli, ’85 Jennifer Hale Stafford, ‘92IllinoisKentuckySource: Alumni Office, October <strong>2012</strong>102
YOUNG ALUMNI ADVISORY COUNCILACADEMIC YEAR <strong>2012</strong>-<strong>2013</strong>Rashaad Abdur-Rahman, ’03KentuckyMarkesha Flagg McCants,’ 03 (President)TennesseeApril Aldeen, ’07 Christian Motley, ‘09KentuckyAlabamaCharles Badger, ’11 (President-Elect) Missy Naseman, ‘05KentuckyOhioWayne Centers, ‘05 Elizabeth Novak, ‘06KentuckyNorth CarolinaDwayne Compton, ‘01KentuckyNolan Oberg, ’05 (Coordinator)KentuckyMarc Crenshaw, ‘02 Jeremy Rotty, ‘05KentuckyNorth CarolinaAmber Davis, ‘06 Jared Rowley, ‘09LouisianaMassachusettsMary Galloway, ‘07 Julie Stewart, ‘04KentuckyKentuckyDestiny Harper, ’06 (Past President) Lederrick Wesley, ’07WashingtonKentuckyJonathan Johnson, ‘99KentuckyHussene Youssouf,’05 (Executive Vice President)GeorgiaSource: Alumni Office, October <strong>2012</strong>< http://www.bereacollegealumni.com/s/925/index.aspx?sid=925&gid=1&pgid=814>103
ALUMNI* BY STATE AND U.S. TERRITORIESAs of October <strong>2012</strong>Alabama 441Alaska 20Arizona 110Arkansas 42California 344Colorado 113Connecticut 48Delaware 23District of Columbia 32Florida 619Georgia 542Hawaii 21Idaho 25Illinois 212Indiana 395Iowa 52Kansas 22Kentucky 6,481Louisiana 43Maine 33Maryland 244Massachusetts 89Michigan 185Minnesota 58Mississippi 40Missouri 107Montana 22Nebraska 20Nevada 28New Hampshire 17New Jersey 81New Mexico 47New York 187North Carolina 1,350North Dakota 3Ohio 1,184Oklahoma 30Oregon 77Pennsylvania 172Puerto Rico 2Rhode Island 9South Carolina 356South Dakota 7Tennessee 1,411Texas 330Utah 19Vermont 23Virgin Islands 4Virginia 1,103Washington 96West Virginia 563Wisconsin 54Wyoming 9Countries other than the U.S.** 214Armed Forces—Europe 6Armed Forces—Pacific 317,768*Alumni include graduates as well as anyone who received academic credit from <strong>Berea</strong><strong>College</strong>, for whom the Alumni Association has a current address.**For more detail about other countries, please see page 105.Source: Alumni Office, October <strong>2012</strong>Source: Alumni Office, October 2011104
ALUMNI* BY COUNTRIES ORGANIZED BY CONTINENTAs Of October <strong>2012</strong>Africa (15 countries)Cameroon 1Ethiopia 1Gambia 1Ghana 5Kenya 4Liberia 1Madagascar 1Mali 1Nigeria 6Senegal 1Seychelles 1South Africa 2Tanzania 2Uganda 1Zimbabwe 5Africa TOTAL 33Asia (23 countries)Azerbaijan 1Burma 3Cambodia 1China 7Hong Kong 6India 6Indonesia 1Iran 1Israel 3Japan 8Kazakhstan 1Korea 6Kyrgyzstan 1Lebanon 1Macau 1Malaysia 7Mongolia 1Nepal 1Russia 1Singapore 1Sri Lanka 2Thailand 6Turkey 4Asia TOTAL 70Oceania (3 countries)Australia 2Micronesia 1Palau 1Oceania TOTAL 4*Alumni Include graduates as well as anyone who received academic credit from <strong>Berea</strong> <strong>College</strong>, for whom the AlumniAssociation has a current address.**For more information about the United States, please see page 104.Source: Alumni Office, October <strong>2012</strong>.105Europe (22 countries)Austria 2Belgium 3Bulgaria 1Czech Republic 1Denmark 3France 2Georgia 2Germany 5Greece 8Hungary 1Ireland 2Italy 2Latvia 1Lithuania 1Macedonia 1Netherlands 3Romania 1Slovak Republic 2Spain 5Sweden 2Switzerland 1United Kingdom 15Europe TOTAL 64North America (not including U.S.) (8 countries)Canada 25Cayman Islands 2Costa Rica 1Dominica 1Haiti 1Mexico 3Nicaragua 1Trinidad and Tobago 2North America TOTAL 36South America (3 countries)Bolivia 1Brazil 1Ecuador 5South America TOTAL 7United States** 17,545Armed Forces-Europe 6Armed Forces-Pacific 3TOTAL 17,768
ALUMNI* BY OCCUPATIONAccounting 160 Journalism 10Administrative/Clerical/Secretarial 164 Judiciary 9Advertising 21 Labor/Human Resources 14Agriculture/Ranching 92 Landscaping 10Animal Science/Veterinary Medicine 17 Law/Legal Services 157Architecture/Urban Planning 13 Library Science 106Art 44 Management 333Arts-Fine 29 Manufacturing 130Arts-Performing/Creative 48 Marketing 42Aviation/Aerospace 10 Mathematics/Statistics 6Banking 71 Mechanical 6Biological Sciences 1 Media 8Brokerage/Securities/Investments 19 Medical/Health (not M.D., RN, Dentist, Pharmacy) 198Business-Administration 80 Merchandising/Sales/Marketing 25Business-Entrepreneur/Owner 181 Military 34Business-Management 105 Ministry 137Business-Owner 47 Missionary 5Childcare 25 Musician 1City Service Officer 2 Nonprofit 16Civil Service 15 Nursing 465Clergy 10 Nutrition 28Communications 24 Personal Services 5Computing/High Technology 227 Personnel/Human Resources 42Construction/Contracting 52 Pharmacology 5Consulting 49 Pharmacy 15Cosmetology 1 Physical Sciences/Mathematics 11Counseling 107 Physician 104Crafts 8 Public Relations 8Dentistry 21 Public Service (Firefighter, Police, Sanitation) 33Economics 1 Publishing 35Education – Administrative 354 Radio/TV/Film 4Education – Student Affairs 43 Real Estate 45Education – Teaching 1,470 Recreation/Leisure Services 15Energy Resources (Oil, etc.) 20 Research/Development 71Engineering 128 Restaurant 9Entertainment 9 Retired 2,195Environmental Science 32 Sales 129Estate Planning/Trusts/Taxation 1 Science 71Extension Work 21 Self-Employed 10Fashion/Beauty 2 Social Science 15Financial Services 71 Social Work 210Foreign Service 3 Sports/Recreation 16Foundations 1 Student 8Fund Raising 23 Support Staff/Secretarial/ Clerical 27Funeral Services 4 Trade/Craft 34Government – Elected 41 Transportation 33Government – Non–elected 171 Travel Industry 8Graphic Design 14 Utilities 19Health 64 Veterinarian 6Homemaking 243 Volunteerism 31Hotel/Restaurant/Catering 37 Writing 30Import/Export 3Insurance 75 Unknown (includes other) 8,301Interior Decorating/Design 9 TOTAL 17,768*Alumni include graduates as well as anyone who received academic credit from <strong>Berea</strong> <strong>College</strong>.NOTE: Updates from news items sent by alumni are used. Of the 17,768 alumni on record, information on occupations isknown for 53%.Source: Alumni Office, October <strong>2012</strong>106
107Percent ParticipationALUMNI* GIVING SUMMARYFiscal Year Ended June 302008 2009 2010 2011 <strong>2012</strong>Alumni <strong>Berea</strong> Fund - Goal $ 815,000.00 $ 835,000.00 $ 1,000,000.00 $1,000,000.00 $ 1,000,000.00Alumni <strong>Berea</strong> Fund - Received $ 985,191.81 $ 1,049,886.88 $ 970,431.89 $ 971,660.19 $ 1,076,007.99Other Gifts (includes gift-in-kind) $ 2,593,792.44 $ 15,669,649.10 $ 4,042,331.73 $ 3,545,222.18 $ 1,901,151.61TOTAL $ 3,578,984.25 $ 16,719,535.98 $ 5,012,763.62 $ 4,516,882.37 $ 2,977,159.60Percent Participation - All Alumni** 28.0% 28.3% 28.0% 24.5% 27.8%Percent Participation - All Graduates** 30.1% 29.6% 28.9% 25.4% 28.6%100%ALUMNI* PARTICIPATION90%80%70%60%50%40%30%28.0% 28.3% 28.0%24.5%27.8%20%10%0%2008 2009 2010 2011 <strong>2012</strong>Fiscal Year Ended June 30*Alumni include graduates as well as anyone who received academic credit from <strong>Berea</strong> <strong>College</strong>.**The percentage of alumni/graduates donor participation is based on the number of alumni/graduates solicited who are celebrating a reunion year, gift clubmembers, the ten most recent classes, and those whose last gift was made sometime during the last ten years. The participation rates include alumni/graduateswhose only gifts are through donor-advised funds and family foundations.Source: <strong>College</strong> Relations, October <strong>2012</strong>
BEREA COLLEGEDESIGNATION OF FUNDSFor Fiscal Year Ended June 30, <strong>2012</strong>Current Operations<strong>Berea</strong> Fund - Unrestricted $ 4,508,375.86Student Aid - Restricted 72,509.66Other - Restricted 1,615,644.63TOTAL CURRENT OPERATIONS $ 6,196,530.15Capital Purposes $ 1,437,309.05Student Loan Fund $ 2,100.00Endowment from Gifts and BequestsRestricted $ 934,678.46Unrestricted $ 6,312,575.62TOTAL ENDOWMENT $ 7,247,254.05Gift Value of Annuities and Life Income Agreements 485,700.35TOTAL GIFTS, BEQUESTS, AND GIFT VALUEOF ANNUITIES AND LIFE INCOME AGREEMENTS $ 15,368,893.60Gifts-In-Kind 35,804.29GRAND TOTAL $ 15,404,697.89Source: <strong>College</strong> Relations, October <strong>2012</strong>108
SOURCE OF CONTRIBUTIONSTO BEREA COLLEGEFor Fiscal Year Ended June 30, <strong>2012</strong>Number Percent of Dollar Percent ofof Gifts Total Gifts Amount Total DollarsSource of SupportGeneral welfare foundations 239 1.38% $ 2,629,864.77 17.07%Corporations and corporate foundations 475 2.74% $ 1,634,154.82 10.61%Organizations, associations, and clubs 71 0.41% $ 396,101.75 2.57%Religious groups 13 0.08% $ 25,035.00 0.16%Fund-raising consortia 6 0.03% $ 12,765.00 0.08%Individuals (other than alumni) 10,271 59.26% $ 2,551,101.19 16.56%Alumni 5,862 33.82% $ 1,173,775.55 7.62%Bequests – Alumni 43 0.25% $ 936,264.11 6.08%Bequests – Non-Alumni 226 1.30% $ 5,524,131.06 35.86%TOTAL GIFTS AND BEQUEST 17,206 99.28% $14,883,193.25 96.61%Gift Value of Annuities andLife Income AgreementsAlumni 9 0.05% $ 85,907.13 0.56%Non-Alumni 32 0.18% $ 399,793.22 2.60%TOTAL GIFTS, BEQUESTS, ANDGIFT VALUE OF ANNUITIES ANDLIFE INCOME AGREEMENTS 17,247 99.52% $15,368,893.60 99.77%Gifts-In-KindAlumni 25 0.14% $ 1,736.65 0.01%Non-Alumni 59 0.34% $ 34,067.64 0.22%GRAND TOTAL 17,331 100.00% $15,404,697.89 100.00%Source: <strong>College</strong> Relations, October, <strong>2012</strong>109
BEREA COLLEGE ALUMNI AND FRIENDS GIVING*BY STATE, U.S. TERRITORIES AND OTHER COUNTRIESFor Fiscal Year Ended June 30, <strong>2012</strong>Number Dollar Number Dollarof Gifts Amount of Gifts AmountAlabama 195 $ 113,080.07 Montana 24 $ 4,110.00Alaska 24 22,796.00 Nebraska 23 1,191.00Arizona 217 139,436.50 Nevada 40 2,683.00Arkansas 50 103,725.08 New Hampshire 64 360,307.31Armed Forces 1 50.00 New Jersey 429 323,092.03California 1,213 563,260.57 New Mexico 86 97,613.87Colorado 167 383,999.05 New York 859 875,840.34Connecticut 277 172,328.48 North Carolina 973 675,829.85D.C. 119 91,120.00 North Dakota 4 163.33Delaware 49 64,639.25 Ohio 1,046 1,211,503.56Florida 757 1,354,915.75 Oklahoma 47 3,322.60Georgia 329 93,769.48 Oregon 125 19,522.00Hawaii 24 1,674.00 Pennsylvania 536 342,568.72Idaho 29 4,591.20 Puerto Rico 7 130.00Illinois 627 576,496.68 Rhode Island 61 7,284.20Indiana 350 376,684.41 South Carolina 260 105,972.16Iowa 86 152,014.64 South Dakota 16 2,072.14Kansas 61 124,600.00 Tennessee 499 430,188.74Kentucky 3,536 1,665,628.73 Texas 428 780,691.41Louisiana 59 90,779.25 Utah 43 15,679.01Maine 91 72,036.13 Vermont 69 8,536.00Maryland 415 71,366.29 Virgin Islands 14 900.00Massachusetts 439 180,405.20 Virginia 797 508,487.48Michigan 547 351,114.12 Washington 226 97,678.47Minnesota 234 1,815,146.69 West Virginia 195 114,605.32Mississippi 28 15,040.00 Wisconsin 244 108,521.30Missouri 174 676,405.13 Wyoming 20 7,367.34STATE AND U.S. TERRITORIES TOTAL 17,233 $15,382,963.88Other Countries:Belgium 1 $ 500.00 Japan 1 $ 1,000.00Canada 4 8,425.00 Nigeria 1 50.00Ethiopia 16 32.00 Sri Lanka 12 120.00Federal States Thailand 1 1,000.00of Micronesia 1 12.00 Turkey 1 200.00Germany 12 252.00 United Kingdom 3 2,400.00Hong Kong 2 5,500.00 Zimbabwe 6 24.00OTHER COUNTRIES TOTAL 61 $ 19,515.00Anonymous 37 2,219.01TOTAL* 17,331 $15,404,697.89*Includes gifts-in-kind and bequests.Source: <strong>College</strong> Relations, October, <strong>2012</strong>110
Dollar Amount(in Millions)BEREA FUND GOALS AND AMOUNTS RECEIVEDFISCAL YEARS 2002-2003 THROUGH 2011-<strong>2012</strong>2002-2003 2003-2004 2004-2005 2005-2006 2006-2007Goal $4,150,000.00 $4,000,000.00 $4,000,000.00 $4,060,000.00 $4,120,000.00Received $4,091,713.70 $4,228,690.77 $4,000,022.32 $4,128,644.11 $4,117,084.912007-2008 2008-2009 2009-2010 2010-2011 2011-<strong>2012</strong>Goal $4,200,000.00 $4,245,000.00 $3,500,000.00 $4,000,000.00 $4,200,000.00Received $4,377,103.03 $4,540,940.92 $4,635,080.13 $4,516,252.45 $4,508,375.86<strong>Berea</strong> Fund: Goals and Amounts ReceivedFiscal Years 2002-2003 through 2011-<strong>2012</strong>$5.0$4.5$4.0$3.5$3.0$2.5$2.0$1.5$1.0$0.5$0.02002-2003 2003-2004 2004-2005 2005-2006 2006-2007 2007-2008 2008-2009 2009-2010 2010-2011 2011-<strong>2012</strong>ReceivedGoalSource: <strong>College</strong> Relations, October <strong>2012</strong>111
112DONATIONSFiscal Years 2002 - 2003 through 2011 - <strong>2012</strong>2002-2003 2003-2004 2004-2005 2005-2006 2006-2007Number of Gifts* 15,894 16,232 16,294 15,980 14,725Current Operations $ 4,740,355.97 $ 5,037,190.16 $ 5,214,231.69 $ 5,445,938.35 $ 4,930,859.98Endowment $ 15,795,603.73 $ 18,996,063.02 $ 16,745,745.23 $ 15,452,553.15 $ 19,038,878.79Other* $ 3,284,704.49 $ 2,744,041.93 $ 3,344,708.10 $ 1,357,828.10 $ 1,476,927.30TOTAL $ 23,820,664.19 $ 26,777,295.11 $ 25,304,685.02 $ 22,256,319.60 $ 25,446,666.07____________________________________________________________________________________________________________________2007-2008 2008-2009 2009-2010 2010-2011 2011-<strong>2012</strong>Number of Gifts* 15,699 16,058 17,043 16,016 17,206Current Operations $ 5,084,390.90 $ 5,567,605.97 $ 6,181,455.73 $ 5,348,253.20 $ 6,196,530.15Endowment $ 18,716,914.82 $ 28,921,895.98 $ 15,573,104.23 $ 13,072,473.56 $ 7,247,254.05Other* $ 2,469,575.52 $ 1,294,113.81 $ 1,242,381.42 $ 2,626,227.08 $ 1,925,109.40TOTAL $ 26,270,881.24 $ 35,783,615.76 $ 22,996,941.38 $ 21,046,953.84 $ 15,368,893.60*Does not include gifts-in-kind.Source: <strong>College</strong> Relations, October <strong>2012</strong>
GIFTS FROM ALUMNI AND FRIENDS ORGANIZED BY NUMBER OF DONORSFor Fiscal Year Ended June 30, <strong>2012</strong>Number Percent of Dollar Percent ofDollar Range of Donors* Total Donors Amount** Total $ AmountLess than 10 277 2.85% 1,034.33 0.01%10 – 24 874 8.99% 13,338.50 0.09%25 – 49 1,825 18.76% 50,950.07 0.33%50 – 99 1,929 19.83% 106,059.19 0.69%100 – 199 2,036 20.93% 221,393.83 1.44%200 – 499 1,314 13.51% 340,112.12 2.21%500 – 749 457 4.70% 241,749.02 1.57%750 – 999 59 0.61% 48,418.37 0.31%1,000 – 2,499 482 4.96% 616,513.78 4.00%2,500 – 4,999 143 1.47% 451,131.65 2.93%5,000 – 7,499 100 1.03% 535,043.63 3.47%7,500 – 9,999 20 0.21% 166,980.20 1.08%10,000 – 19,999 86 0.88% 1,079,266.12 7.01%20,000 – 29,999 38 0.39% 901,500.39 5.85%30,000 – 49,999 18 0.19% 655,558.96 4.26%50,000 – 69,999 32 0.33% 1,746,733.06 11.34%70,000 – 99,999 10 0.10% 843,034.56 5.47%100,000 – 149,999 13 0.13% 1,411,555.11 9.16%150,000 – 249,999 3 0.03% 552,972.08 3.59%250,000 – 499,999 6 0.06% 1,714,876.79 11.13%500,000 – 999,999 4 0.04% 2,576,476.13 16.73%1,000,000 – 2,499,999 1 0.01% 1,130,000.00 7.34%2,500,000 and up 0 0.00% 0.00 0.00%TOTALS 9,727 100.00% $15,404,697.89 100.00%The 9,727 donors gave 17,331 gifts in FY <strong>2012</strong> Average (Mean) $1,583.70for a total of $15,404,697.89 Median $80.00Mode $100.00NOTE: Please see page 114 for a breakdown of gifts by the Number of Gifts.*Donor category is based on total giving for the fiscal year. Only one donor is counted per gift even iftwo donors received credit.**Includes gifts-in-kind.Source: <strong>College</strong> Relations, October <strong>2012</strong>113
GIFTS FROM ALUMNI AND FRIENDS ORGANIZED BY NUMBER OF DONORSFor Fiscal Year Ended June 30, <strong>2012</strong>113
GIFTS FROM ALUMNI AND FRIENDS ORGANIZED BY NUMBER OF GIFTSFor Fiscal Year Ended June 30, <strong>2012</strong>Number Percent of Dollar Percent ofDollar Range of Gifts Total # of Gifts Amount* Total $ AmountLess than 10 2,197 12.68% 5,965.44 0.04%10 – 24 2,863 16.52% 40,961.70 0.27%25 – 49 3,663 21.14% 98,393.79 0.64%50 – 99 2,826 16.31% 151,264.38 0.98%100 – 199 2,864 16.53% 300,404.49 1.95%200 – 499 1,309 7.55% 331,279.65 2.15%500 – 749 488 2.82% 249,401.22 1.62%750 – 999 47 0.27% 38,905.53 0.25%1,000 – 2,499 508 2.93% 633,147.25 4.11%2,500 – 4,999 187 1.08% 607,482.74 3.94%5,000 – 7,499 127 0.73% 703,149.27 4.56%7,500 – 9,999 30 0.17% 258,234.59 1.68%10,000 – 19,999 93 0.54% 1,166,893.14 7.57%20,000 – 29,999 41 0.24% 981,877.12 6.37%30,000 – 49,999 18 0.10% 632,642.31 4.11%50,000 – 69,999 35 0.20% 1,888,726.35 12.26%70,000 – 99,999 9 0.05% 785,610.11 5.10%100,000 – 149,999 13 0.08% 1,362,492.88 8.84%150,000 – 249,999 4 0.02% 766,362.00 4.97%250,000 – 499,999 5 0.03% 1,622,205.93 10.53%500,000 – 999,999 3 0.02% 1,699,298.00 11.03%1,000,000 – 2,499,999 1 0.01% 1,080,000.00 7.01%2,500,000 and up 0 0.00% 0.00 0.00%TOTALS 17,331 100.00% $ 15,404,697.89 100.00%The 9,727 donors gave 17,331 gifts in FY <strong>2012</strong> Average (Mean) $888.85for a total of $15,404,697.89 Median $40.00Mode $25.00NOTE: Please see page 113 for a breakdown of gifts by the Number of Donors.*Includes gifts-in-kind.Source: <strong>College</strong> Relations, October <strong>2012</strong>114
FINANCIAL HIGHLIGHTSYEARS ENDED JUNE 30, <strong>2012</strong> AND 2011<strong>2012</strong> 2011OPERATING REVENUE $ 81,828,210 $ 79,088,086OPERATING EXPENSES $ 79,501,192 $ 67,658,991OPERATING REVENUE IN EXCESS OF EXPENSESFROM CONTINUING OPERATIONS $ 2,327,018 $ 11,429,095ADDITIONS TO PROPERTY, PLANT AND EQUIPMENT $ 4,573,022 $ 2,726,770LONG-TERM INVESTMENTS OF THE ENDOWMENTAND TUITION REPLACEMENT FUNDSOriginal gift value $ 444,416,884 $ 434,472,604Investments at market $ 942,618,000 $ 978,734,900Interest and dividends, net $ 15,986,973 $ 17,036,405Return 1.6% 2.0%Market price (decrease) increase $ (19,034,205) $ 146,976,983Return -1.9% 17.4%Total return $ (3,047,232) $ 164,013,388Percent – time weighted -0.3% 19.4%CASH AND IN-KIND CONTRIBUTIONSCash gifts $ 8,908,499 $ 7,005,168Bequests 6,460,395 14,041,786Total cash gifts 15,368,894 21,046,954Gifts-in-kind 35,804 89,008Total $ 15,404,698 $ 21,135,962Source: Office of Financial Affairs, September <strong>2012</strong>115
STATEMENTS OF FINANCIAL POSITIONJune 30, <strong>2012</strong> and 2011ASSETS<strong>2012</strong> 2011CURRENT ASSETSCash and cash equivalents $ 50,417,011 $ 49,615,614Accrued interest on investments 785,315 2,409,919Accounts and notes receivable 5,565,477 3,095,123Inventories 1,283,401 1,199,901Prepaid expenses and other assets 144,388 143,946Contributions receivable and bequests in probate 12,850,478 4,604,112Total current assets 71,046,070 61,068,615PREPAID EXPENSES AND OTHER ASSETS 964,656 1,024,817CONTRIBUTIONS RECEIVABLE AND BEQUESTS IN PROBATE 5,935,874 3,164,942LONG-TERM RECEIVABLES 5,731,712 1,739,638LONG-TERM INVESTMENTSDonor-restricted endowment 526,468,200 548,244,000Tuition replacement 416,149,800 430,490,900Annuity and life income 25,613,200 27,643,400Funds held in trust by others 23,708,800 24,424,000Total long-term investments 991,940,000 1,030,802,300PROPERTY, PLANT AND EQUIPMENT (net) 140,965,563 143,076,757Total assets $ 1,216,583,875 $ 1,240,877,069LIABILITIES AND NET ASSETSCURRENT LIABILITIESAccounts payable and accrued expenses $ 8,840,491 $ 4,228,157Accrued salaries and wages 2,728,112 2,585,871Deposits and agency funds 502,421 546,228Deferred income 198,518 182,428Current maturities of long-term debt 2,187,069 2,108,923Total current liabilities 14,456,611 9,651,607LONG-TERM LIABILITIESActuarial liability for annuities payable and other liabilities 20,179,991 16,385,423Long-term debt 53,099,642 55,811,711Total long-term liabilities 73,279,633 72,197,134Total liabilities 87,736,244 81,848,741NET ASSETSUnrestricted 501,766,649 522,911,190Temporarily restricted 356,849,577 366,689,029Permanently restricted 270,231,405 269,428,109Total net assets 1,128,847,631 1,159,028,328Total liabilities and net assets $ 1,216,583,875 $ 1,240,877,069NOTE: Fiscal Year 2011 balances reflect $254.9 million reclassification from unrestricted net assets totemporarily restricted net assets based on a change in law (Uniform Prudent Management of InstitutionalFunds Act).Source: Office of Financial Affairs, September October 2009 <strong>2012</strong>116
STATEMENT OF ACTIVITIESYEARS ENDED JUNE 30, <strong>2012</strong> AND 2011<strong>2012</strong> 2011OPERATING REVENUESpendable return from long-term investments $ 37,401,970 $ 41,173,362Gifts and donations 5,197,022 6,455,952Federal grants 14,015,203 8,067,225Cost of education fees paid by federal and state scholarships 3,850,000 3,650,000Fees paid by students 1,599,296 1,491,227Other income 3,325,633 3,434,001Residence halls and food service 7,998,618 7,413,041Student industries and rentals 4,427,429 4,173,354Net assets released from restrictions 7,775,772 5,708,358Gross operating revenue 85,590,943 81,566,520Less: Student aid (3,762,733) (2,478,434)Net operating revenue 81,828,210 79,088,086OPERATING EXPENSESProgram Services --Educational and general 52,669,579 42,990,211Residence halls and food service 7,926,822 7,161,121Student industries and rentals 5,156,052 4,872,553Total program services 65,752,453 55,023,885Support services 13,748,739 12,635,106Total operating expenses 79,501,192 67,658,991Operating revenue in excess of operating expensesfrom continuing operations 2,327,018 11,429,095OTHER CHANGES IN NET ASSETSGain on sale of property, plant, and equipment 64,939 75,108(Loss) gain on valuation of interest rate swaps (4,403,500) 999,300Investment return(less) more than amounts designatedfor current operations (46,776,380) 121,541,704Gifts and bequests restricted or designated for longterminvestments 5,030,842 11,328,689Restricted gifts for property, plant and equipment andother specific purposes 16,194,131 1,220,185Restricted spendable return on endowment investments 5,611,978 4,712,122Reclassification of net assets released from restrictions (7,775,772) (5,708,358)Net adjustment of annuity payment and deferred givingliability (453,953) 3,075,013Total change in net assets $ (30,180,697) $ 148,672,858Source: Office of Financial Affairs, September <strong>2012</strong>117
Millions of DollarsTEN-YEAR SUMMARY OFMARKET VALUES AND HISTORICAL BOOK VALUESFiscal Year-EndMarket ValueHistoricalOf Long-Term<strong>Book</strong>June 30, Investments Value*2003 695,812,000 270,794,6172004 794,962,600 291,178,3372005 861,678,500 310,184,7312006 948,737,700 328,194,0142007 1,102,272,000 349,235,6522008 1,023,254,700 368,689,4572009 791,209,800 399,186,4302010 846,776,300 420,641,9072011 978,734,900 434,472,604<strong>2012</strong> 942,618,000 444,416,884*Historical <strong>Book</strong> Value represents the accumulated value of alladditions to long-term investments from inception.GROWTH IN LONG-TERM INVESTMENT VALUES1200100080060040020002003 2004 2005 2006 2007 2008 2009 2010 2011 <strong>2012</strong>Fiscal Year Ended June 30,Fiscal Year-End Market Value Of Long Term InvestmentsHistorical <strong>Book</strong> ValueSource: Office of Financial Affairs, September <strong>2012</strong>118
ASSET ALLOCATION OF LONG-TERM INVESTMENTSJUNE 30, <strong>2012</strong> AND 2011<strong>2012</strong> 2011Endowment and Tuition Replacement:Pooled Investments -U.S. equities $ 225,550,600 $ 222,751,500International equities 253,397,000 230,037,500Corporate notes and bonds 60,445,700 58,650,300U.S. Government securities 63,819,100 70,210,400Structured notes - 43,933,900Private equity – venture capital 4,660,500 4,834,900Private equity – buy out 40,547,300 37,613,600Private equity – debt funds 9,061,300 9,661,700Private equity – fund of funds 24,467,000 37,273,900Hedge funds 149,575,300 152,006,200Commodities 49,878,900 18,869,400Real estate 12,026,900 25,256,500Short-term investments and cash 44,399,000 63,221,700Total 937,828,600 974,321,500Non Pooled Investments -U.S. equitiesCorporate notes and bonds38,0005,10029,6002,400Real estate 2,876,900 2,536,900Short-term investments and cash 1,869,400 1,844,500Total 4,789,400 4,413,400Total endowment and tuitionreplacement 942,618,000 978,734,900Annuity and Life Income:U.S. equities 8,724,900 12,286,600International equities 4,961,500 6,505,300Corporate notes and bonds 3,487,100 4,468,100U.S. Government securities 3,336,100 3,255,400International bonds 1,280,400 -Real estate 3,329,000 330,000Insurance policies 79,600 75,600Short-term investments and cash 414,600 722,400Total annuity and life income 25,613,200 27,643,400Funds Held in Trust by Others:Where <strong>Berea</strong> <strong>College</strong> receives all or astipulated percent of income 23,708,000 24,424,000Total long-term investments $ 991,940,000 $ 1,030,802,300Source: Office of Financial Affairs, September <strong>2012</strong>119
FISCAL YEAR <strong>2012</strong>-<strong>2013</strong>OPERATING BUDGET HIGHLIGHTSSOURCES OF REVENUES USED FOR EDUCATIONAL AND GENERAL PURPOSESEndowment Spendable Return $ 28,843,80073.1%Gifts for Current Operations $ 4,550,00011.6%Federal and State Sources $ 4,830,00012.3%Other Miscellaneous Income $ 1, 143,0002.9%Net Loss from Student Industries $ 102,200and Rentals 0.1%$ 39,469,000Source: Office of Financial Affairs, September 2011120
CURRENT OPERATING BUDGETREVENUES<strong>2012</strong>-13 2011-12 Dollar PercentageBudget Budget Change ChangeGross Endowment Income $ 38,645,714 $ 36,821,482 $ 1,824,232 4.95%Less: Capital and Plant Fund (4,627,220) (4,459,917) (167,303) 3.75%TCERF (5,174,694) (4,499,865) (674,829) 15.00%Net Endowment Income 28,843,800 27,861,700 982,100 3.52%Gifts for Current Operations 4,550,000 4,200,000 350,000 8.33%Cost of Education Fees 3,900,000 3,850,000 50,000 1.30%Federal Work Study Grant 930,000 930,000 - -Fees Paid by Students 718,000 633,000 85,000 13.43%Other Income 425,000 490,000 (65,000) (13.27%)TOTAL 39,366,800 37,964,700 1,402,100 3.69%Student Industries and Rentals 5,062,400 4,778,500 283,900 5.94%Residence Halls and Food Service 8,020,300 7,782,500 237,800 3.06%TOTAL REVENUES 52,449,500 50,525,700 1,923,800 3.81%EXPENDITURESEducational and General 39,469,000 38,047,600 1,421,400 3.74%Student Industries and Rentals 4,960,200 4,695,600 264,600 5.64%Residence Halls and Food Service 8,020,300 7,782,500 237,800 3.06%TOTAL EXPENDITURES 52,449,500 50,525,700 1,923,800 3.81%Excess of Revenues over Expenditures $ - $ - $ - -Source: Office of Financial Affairs, September <strong>2012</strong>121
EDUCATIONAL AND GENERAL BUDGET SUMMARYREVENUES<strong>2012</strong>-13 2011-12 Dollar PercentageBudget Budget Change ChangeGross Endowment Income $ 38,645,714 $ 36,821,482 $ 1,824,232 4.95%Less: Capital and Plant Fund (4,627,220) (4,459,917) (167,303) 3.75%TCERF (5,174,694) (4,499,865) (674,829) 15.00%Net Endowment Income 28,843,800 27,861,700 982,100 3.52%Gifts for Current Operations 4,550,000 4,200,000 350,000 8.33%Cost of Education Fees 3,900,000 3,850,000 50,000 1.30%Federal Work Study Grant 930,000 930,000 - -Fees Paid by Students 718,000 633,000 85,000 13.43%Other Income 425,000 490,000 (65,000) -13.27%Student Industries and Rentals 102,200 82,900 19,300 23.28%Residence Halls and Food Service - - - -TOTAL REVENUE 39,469,000 38,047,600 1,421,400 3.74%EXPENDITURESSalaries and Wages 22,462,800 21,078,150 1,384,650 6.57%Salary Churn (300,000) (300,000) - -Net Salaries and Wages 22,162,800 20,778,150 1,384,650 6.66%Fringe Benefits 5,655,300 5,296,600 358,700 6.77%Student Payroll 3,375,000 3,181,000 194,000 6.10%Net Controllable Expense 7,778,900 8,219,850 (440,950) -5.36%Computer Capital Fund 395,000 440,000 (45,000) -10.23%Equipment Reserve 102,000 102,000 - -Strategic Planning Initiatives - 30,000 (30,000) 100.00%TOTAL EXPENDITURES 39,469,000 38,047,600 1,421,400 3.74%Excess of Revenues over Expenditures $ - $ - $ -Source: Office of Financial Affairs, September <strong>2012</strong>122
CURRENT OPERATING EDUCATIONAL AND GENERAL EXPENDITURES5-Year History2007-08 % of 2008-09 % of 2009-10 % of 20010-11 % of 2011-12 % ofClassification by Function Actual Total Actual Total Actual Total Actual Total Actual TotalInstruction $ 14,419,651 36.0% $ 14,573,495 36.1% $ 13,595,840 35.3% $12,401,997 33.6% $13,413,747 34.1%Public Service 665,021 1.7% 672,540 1.7% 655,061 1.7% 494,790 1.3% 486,516 1.2%Academic Support 4,376,280 10.9% 4,327,149 10.7% 4,327,826 11.2% 3,946,424 10.7% 4,165,640 10.6%Student Services and Activities 5,010,511 12.5% 5,011,224 12.4% 5,013,100 13.0% 4,947,199 13.4% 4,970,564 12.6%General and Administrative 6,450,592 16.1% 6,900,806 17.1% 6,644,302 17.2% 6,825,037 18.5% 7,334,472 18.6%Development and Alumni 3,640,952 9.1% 3,500,017 8.7% 3,102,891 8.0% 3,170,958 8.6% 3,655,037 9.3%Plant Operations 4,745,671 11.9% 4,594,491 11.4% 4,459,959 11.6% 4,452,636 12.1% 4,788,669 12.2%Capital and Special Projects 731,000 1.8% 753,000 1.9% 753,000 2.0% 653,000 1.8% 572,000 1.4%TOTAL $ 40,039,678 100.0% $ 40,332,722 100.0% $ 38,551,979 100.0% $ 36,892,041 100.0% $ 39,386,645 100.0%123Source: Office of Financial Affairs, September <strong>2012</strong>
RESIDENCE LIVINGAcademic Year <strong>2012</strong>-<strong>2013</strong>The fourteen traditional residence halls comprise an important component of a <strong>Berea</strong> <strong>College</strong>education. Varying in architecture, size, room arrangement and traditions, the residential experienceis based on a shared sense of common good, something students should learn to value and seek tocreate throughout their lives. Via student staff and residents, a sense of community is fostered withineach hall to provide an environment that is conducive to both academics and friendships. Both firstyearand upperclassmen students live in the traditional residence halls.The Ecovillage is an ecologically-sustainable residential and learning complex designed to meethousing needs for student families, childcare for campus children, and provide a living/laboropportunity for students interested in sustainability. The Harrison-McLain Home Management Houseis utilized for the family resource management practicum and serves as an upper-level femaleresidence hall for selected majors.TraditionalResidence HallsCapacityAnna Smith 80Bingham 71Blue Ridge 100Dana 132Danforth 146Edwards 33Elizabeth Rogers (ER) 89Fairchild 73James 108Kentucky 94Kettering 146Pearsons 118Seabury 38Talcott 88Subtotal 1,316HousesHome Management House 11Hunt Acres Farm House 3SUBTOTAL 1,330Capacity for Women (751)Capacity for Men (579)Family HousingEcovillage 59TOTAL 1,389Note: Capacity by gender does not include EcovillageSource: Residential Life Services and Collegium, October <strong>2012</strong>124
CAPITAL CONSTRUCTION PROJECTS, 1980 - <strong>2012</strong>New ConstructionDate Project1980 Racquetball Courts 1993 Campus Child Care Program1980 Ross Jelkyl Drama Building 1994 Seabury Center1982 Farm Mix Mill and Hog Feeding Floor 1995 Farrowing House – <strong>College</strong> Farms1982 Athletic Track 1995 Tennis Courts1983 Mueller Woodcraft Building Track 1996 Tennis Pavilion1988 Married Student Housing 2004 Child Development Laboratory at EcoVillag1990 Hutchins Library Addition 2006 Central Plant Building/Distribution1990 Computer Center Addition 2009 Fee Glade1993 Married Student HousingRenovationsDate Project1980 Elizabeth Rogers Residence Hall 1999 Appalachian Center/Bruce Building1981 Pearsons Hall Fire Escape 1999 Student House/Jackson Street (Knight House)1981 Kentucky Residence Hall 1999 Danforth Residence Hall1981 James Residence Hall 2000 Kettering Residence Hall1983 Goldthwaite Agriculture Building 2000 Bruce/Trades (phase one)and Addition 2000 Drapper Carillon1983 Science Hall Renovation and Addition 2001 Bruce/Trades (phase two)/Connector1985 President's Home 2001 Blue Ridge Residence Hall1986 Talcott Residence Hall 2001 Student Parking Lot Improvements1987 Frost Basement - Computer Lab 2002 Draper Building1987 ARC House Renovation 2002 Kentucky Residence Hall1987 Pearson Residence Hall 2002 Art Gallery Addition1988 Boone Tavern 2002 Soccer Field Complex1988 Blue Ridge Residence Hall 2002 <strong>College</strong> <strong>Book</strong>store Renovation1989 Kentucky Annex 2002 Computer Center Renovation1990 Hutchins Library Renovation 2003 Talcott/Annex Residence Hall Renovation1990 <strong>Berea</strong> <strong>College</strong> Health Service 2003 Presser Hall Renovation1991 Draper Building - Center for Effective 2003 Lincoln Hall RenovationCommunication 2003 EcoVillage Apartments1991 Lincoln Hall Basement - 2003 EcoVillage SENS HouseDuplicating Services Center 2003 Baseball/Softball Fields1992 Utilities/Laundry 2004 James Hall Renovation1992 Students for Appalachia – Trades 2004 Boone Tavern Garage Renovation for:BuildingPublic Relations Department1993 Alumni Building Visitors Center at <strong>College</strong> Square1993 Draper Classrooms 2005 Central Plant1994 President’s Home 2006 Campus Building Retro Fits1994 Alumni Building 2006 Resurfacing of the Track1994 Boone Tavern 2006 Sturt Cottage1996 Edwards 1 st & 2 nd floors (Administrative Offices) 2007 Haaga House1997 Resurfacing of Track 2007 Pearsons Residence Hall1997 Systems upgraded in Dana Residence Hall 2007 Middletown School1997 Phelps Stokes – Seating and Refinishing 2008 Appalachian Center Gallery Renovation1998 Married Student Laundry 2008 Elizabeth Rogers Renovation1998 Frost Renovation 2008 Edwards 3 rd Floor(Residence Hall)Renovation1998 Food Service Renovation 2008 Seabury Center Gym Floor Replacement1998 Science Laboratories 2009 Emery Building1998 Computer Center 2009 Boone Tavern1999 Craft Center 2009 Edwards 3 rd Floor(Residence Hall) (phasetwo)1999 Crossroads Complex 2010 <strong>Berea</strong> Dining (Renovation)1999 Fairchild Residence Hall <strong>2012</strong> Alumni (Baird Lounge Renovation)1999 Log House Remodel <strong>2012</strong> Alumni (Hutchins Dining Room)1999 Phelps-Stokes Air Conditioning <strong>2012</strong> Alumni (New Woodson Center)1999 Alumni Building Remodel <strong>2012</strong> Papaleno’s (Dining Room Addition)Source: Facilities Management, November <strong>2012</strong>125
HUTCHINS LIBRARY(Fiscal Year <strong>2012</strong>)Total Net Total NumberAdded During Held at End ofLibrary Collections Fiscal Year Fiscal YearPrint Collection (books, bound serials and government documents)Volumes (item count) (1,377) 391,374Media Collection (LPs, videos, CDs, DVDs and audio tapes)Volumes (item count) 305 14,004Electronic CollectionE-books and cataloged websites 256 72,974Digitized audio (hours) 1,218 3,899<strong>Berea</strong> Digital (pages/images) 3,507 13,741Microforms (books, journals and newspapers)Physical units [307] 148,601Serials (journals and serials)Print and microform subscriptions: journals and serials (8) 447Electronic titles: journals and serials 0 983Full-text journals available through databases 3,106 63,437Manuscripts and Archives (in linear feet) 202 5,328Library ExpendituresDollarAmount<strong>Book</strong>s – paper and microforms $ 82,765Periodicals– paper and microforms 98,820Serials – paper and microforms 10,197Electronic resources 191,558Media 7,959Microform 11,354Preservation 3,640TOTAL ACQUISITIONS EXPENDITURES $ 406,293Acquisitions Expenditures per Student $ 248.04Source: Hutchins Library, October <strong>2012</strong>126
116
Hutchins Library, continued(Fiscal Year <strong>2012</strong>)Library ServicesMain Library hours open per week 94.25Special Collections hours open per week 26.00Library Instruction – General Studies ProgramSessionsGSTR 110 and 210 (first year) 81Other General Studies Courses 13Other Courses 31Special Collections 50Outside Groups 2TOTAL 177Percentage of GSTR First-Year courses with library sessionsGSTR 110 and 210 96%Reference and Research AssistanceLibrary Reference Desk Transactions Total 1,637Research Consultations 135Special Collections Reading Room Visits Total 848Special Collections Reference Requests (non-visits) 692Computer AccessPublic Access Workstations 12Public Network Connections 102Wireless Network ConnectionsYesAverage perCirculation Transactions Number Student FTEPrint and media collections – faculty and staff 4,636Print and media collections – students 18,471 11.3Print collections – town 1,416TOTAL 24,523Reserve materials 615Equipment (computers and media) uses 1,422Classrooms and study rooms uses 9,016Special Collections uses 3,524<strong>Berea</strong> Digital searchesn/aInterlibrary LoanNumberProvided to other libraries 3,064Received from other libraries 1,771Source: Hutchins Library, October <strong>2012</strong>127
INFORMATION SYSTEMS AND SERVICESInformation Systems and Services (IS&S) manages the campus information and communications infrastructurein support of student success and institutional effectiveness. This includes instructional and media technologies,administrative systems, analytical tools, web/portal applications, wireless, VoIP and much more. IS&S servesthe <strong>College</strong>’s mission by maintaining a robust technology infrastructure designed to address current needs andfuture growth.Technology Infrastructure:Campus Network: The campus is connected electronically by a fiber optic network backbone which providesaccess to resources from every residence hall, administrative, and academic building. Wireless networkconnectivity is provided in all academic, administrative and residence hall buildings as well as the Quad,Crossroads, and Fee Glade outdoor spaces. The campus network is secured by Microsoft Active Directoryaccount management and by Cloudpath Express Connect wireless access control. The network is subdividedinto VLAN’s to allow appropriate restrictions on traffic between different areas of the campus.Communications Capabilities: All faculty, staff, and students have e-mail accounts using MicrosoftExchange 2007 Server and Microsoft Outlook, available both on campus and via the Internet. E-mailaccounts are also offered to retirees. All faculty and staff offices and each residence hall room havetelephone extensions set up on the campus PBX system. Network-based VoIP phones are in use in severaldepartments, and over time the Cisco VoIP Call Manager will replace the Nortel Meridian PBX system. AT&Tmobile devices are provided to staff who need mobile communication for their jobs.Desktop Computers and Software: IS&S supports a large inventory of desktop and laptop computers foruse by students, faculty, and staff. Dell computers are the standard system, though some faculty and staffuse Apple computers due to the requirements of their discipline. IS&S is qualified as a self- maintainer forboth Dell and Apple computers so all computer repairs can be accomplished quickly on site. Software sitelicenses are provided for Microsoft Office 2010, Filemaker Pro, EndNote, and Microsoft Forefront Antivirus,making these functions available to all faculty, staff, and students. Concurrent user licenses are available formany software packages used in teaching and for Adobe Creative Suite CS5 graphics and publishingprograms and SPSS basic statistics used for both academic and administrative functions.Internet Access: The campus is connected to the Internet via a local ISP which provides 200Megabits/second bandwidth into and out of the campus. Campus systems are protected from hackers,viruses, and other threats by industry standard firewall, enterprise-wide virus protection and web-filteringdevices. Bandwidth is managed by a packet-shaping device to give priority to teaching and learning overrecreational use.Network Resources: In addition to e-mail, the network connects users to various servers which provide filestorage space or specific applications. Applications include the Moodle course management system, the IDcard and access control system, FileMaker database servers, the BANNER administrative database system,the My<strong>Berea</strong> web portal, and the <strong>Berea</strong>.edu website. The Equitrac Express print management systemoperated by the Printing Services department manages all network-connected laser printers and copiers. Allcampus copiers are multi-function devices that can also be used as scanners or printers.Technical Support: IS&S operates a Help Desk providing phone and e-mail support for faculty, staff andstudents who have computer, phone or media equipment problems or who need instruction in usingcomputers, phones, media equipment or core software. Laptop computer users can also bring their computerto the IS&S Technology Resource Center for assistance or for repair service. IS&S Technology ResourceCenter student and staff technicians are available to come to offices or classrooms to troubleshoot and repaircomputers or to provide support for projectors and other audio-visual equipment. The IS&S TechnologyResource Center is open 8-5 on weekdays.Source: Information Systems and Services, October <strong>2012</strong>128
Information Systems and Services, continuedSupporting Institutional Effectiveness:Enterprise Data Systems: The <strong>College</strong> uses the Banner software from Ellucian, an integrated administrativesystem for financial, student records, financial aid, human resources/payroll, and alumni/developmentfunctions. The Student, Finance, and Employee self-service modules of Banner allow for access to Bannerinformation and functions through the My<strong>Berea</strong> portal. BANNER is supplemented by NOLIJ, a documentimage management system which stores electronic copies of applications for admission, financial aidstatements, purchase orders, invoices, and other documents.My<strong>Berea</strong> Portal: The My<strong>Berea</strong> portal brings together a wide range of information, functions, and links tomake faculty and staff work life easier and more efficient. Faculty can view their class schedules, class lists,advisees’ transcripts and grades, and manage their advisees’ registration process using self-servicefunctions. Faculty and staff can view e-mail as well as personal employment and payroll information. Moodlelearning management system and Banner administrative system can be accessed via the portal whenapplicable.Personal Computers and Phones: All faculty and most staff are provided with a personal laptop or desktopcomputer for personal productivity and for access to e-mail and other campus network resources and theInternet. Faculty and staff offices are equipped with telephones for communication on and off campus, andmobile phones are provided to staff who need mobile communication for their job function.Specialized Applications: Specialized applications support various administrative functions across campusincluding Chemical Inventory, Electronic Lock Access Management, ID Card production, Printer/Copiercontrol/payment, Health Clinic appointment scheduling and others. IS&S assists departments with selectingsoftware to be sure it will function well on the network and standard computing equipment. IS&S will alsoestablish and refine operational and support structures as appropriate to support new and emergingtechnologies. Functional support for specialized software is typically obtained directly from softwareproviders.Statistics:2010-11 2011-12 <strong>2012</strong>-13Technology Infrastructure:Internet Connection Speed (megabits/second) 100 200 200Network Backbone Speed (megabits/second) 20,000 20,000 20,000Network Ports 7,000 7,000 7,000Campus phone extensions 2,180 2,180 2,200Personal computers 2,850 2,982 2,512Networked printers 124 117 114Networked MFD/copiers 61 62 63Supporting Student Success:Student laptop computers 1,700 1,700 1,627Computers in Campus labs 74 74 68Computers in departmental labs 105 115 152Classrooms with 1 port per seat 37 37 34Classrooms with Wireless Network 117 117 117Classrooms with projectors 73 73 n/aClassrooms with multimedia input 53 53 65Other meeting rooms with projectors and multimedia input 20 20 21Course sections utilizing Learning Management System 443 557 694Supporting Institutional Effectiveness:Staff and FacultyComputers 722 844 886Campus Phones 705 705 705Mobile Phones 72 90 92Source: Information Systems and Services, October <strong>2012</strong>129
Information Systems and Services, continuedSupporting Student Success:Academic Software: Students have access to a wide range of software applicable to various academicdisciplines. Examples include Maple for mathematics and physics students, Autodesk products for CAD,ChemDraw for chemistry classes, Sibelius for music scoring, and Final Cut Express for video editing. Mostsoftware will run on the EDGE laptop computers, though some are available only in specialized computerlabs.Course Management System: The Moodle Learning Management System (LMS) allows faculty to managecourses online, to post course information and syllabus documents, to communicate with students, tofacilitate student discussion and collaboration, to receive paperless assignment documents, and to accesssome electronic testing features. Students and faculty are able to access their Moodle account from theMy<strong>Berea</strong> portal via the campus network or over the Internet.EDGE Laptop Program: The EDGE (Empowering a Dynamic Generation in Education) program provides alaptop computer for each student. The program is primarily funded through a special endowment. Thelaptop computers are able to run almost all of the software used in teaching, allowing students to gain muchmore experience with the software than was available in traditional computer labs. Computer labs remainfor specialized software that require an Apple computer or that can be run more efficiently or at a lower costin a lab environment.Faculty Support: Faculty are provided with technology tools for their teaching based on their particulardiscipline’s best practices and their personal style. Each professor has a laptop computer comparable tothose in use by students, allowing him or her to develop electronic activities for students to engage in. Mostclassrooms are equipped with digital projectors and many also include multi-media systems providing arange of media input options. The Applied Technology Faculty Studio in the Hutchins Library is available toassist faculty with technology usage and to support students whose assignments require specializedsoftware or equipment. The IS&S Technology Resource Center is also available to faculty for checkout ofaudio-visual equipment and for media production services such as audio and video editing, poster andbanner printing, media conversions and copying, and lamination.My<strong>Berea</strong> Portal: My<strong>Berea</strong>, launched in Spring 2008, brings together many information resources and selfservicefeatures utilized by students. It provides web-browser-based access to e-mail, the coursemanagement system, and many units of information that will be helpful to students navigating college lifewithout requiring them to have special knowledge to find or access the resources. The portal interface toour Banner administrative system allows easy viewing of course schedules, grades, student financialaccounts, and payroll information, and provides for self-service course registration and emergency contactupdates. My<strong>Berea</strong> also offers features to faculty and advisors that allow them to communicate with studentsand monitor their status.Specialized Equipment Access: Through the Applied Technology Faculty Studio, faculty can utilizetechnology that is not yet widely available in classrooms or labs. Examples have included high end digitalaudio and video editing software, smartboards, ipads, and classroom feedback clicker devices. IS&S staffand student technicians are available at the Studio to assist faculty with projects. Students and faculty canalso check out equipment from the IS&S Technology Resource Center located in the Computer Center anduse the equipment for projects. Examples of available equipment include portable PA systems, cameras,audio recorders and projectors.Source: Information Systems and Services, October <strong>2012</strong>130