Determining feasibility of acoustic tag attachment and documenting ...
Determining feasibility of acoustic tag attachment and documenting ...
Determining feasibility of acoustic tag attachment and documenting ...

Create successful ePaper yourself
Turn your PDF publications into a flip-book with our unique Google optimized e-Paper software.
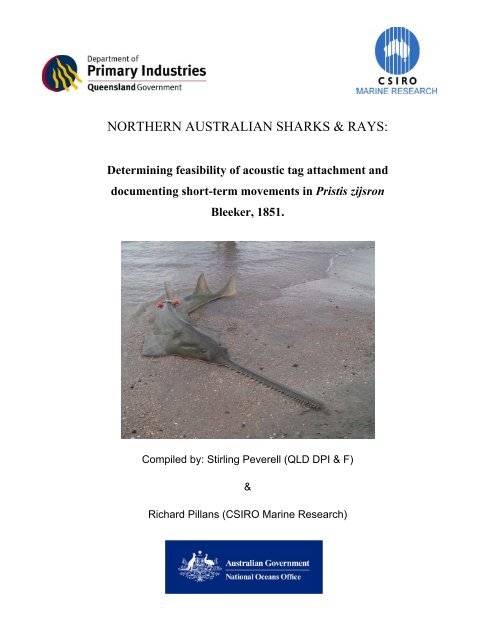
NORTHERN AUSTRALIAN SHARKS & RAYS:<strong>Determining</strong> <strong>feasibility</strong> <strong>of</strong> <strong>acoustic</strong> <strong>tag</strong> <strong>attachment</strong> <strong>and</strong><strong>documenting</strong> short-term movements in Pristis zijsronBleeker, 1851.Compiled by: Stirling Peverell (QLD DPI & F)&Richard Pillans (CSIRO Marine Research)
AcknowledgmentsThe authors would like to thank the owner (Mr Peter Tonon) <strong>and</strong> skipper (TimDudgeon) for their goodwill <strong>and</strong> assistance with the data collection. The commitment<strong>and</strong> support given by Andrew Taylor is also acknowledged <strong>and</strong> greatly appreciated.The project team would also like to thank QBFP Weipa, Peter McCulkin (DPI ProjectOfficer) <strong>and</strong> the Mapoon Aboriginal Council for their logistical support <strong>and</strong>assistance. We thank Ge<strong>of</strong>f McPherson <strong>and</strong> Dr Neil Gribble <strong>of</strong> the Department <strong>of</strong>Primary Industries Northern Fisheries Centre for their time in critiquing thisdocument. This project would not have been made possible if wasn’t for the fundingsupport <strong>of</strong> the National Oceans Office administered by Steve Jackson.III
Executive summaryA female Pristis zijsron was tracked for 27 h in the Port Musgrave estuary using anultrasonic tracking <strong>tag</strong> <strong>and</strong> depth recorder, both <strong>of</strong> which were recovered after 27hours, leaving the animal unharmed. This represents the first track <strong>of</strong> a sawfish inAustralia <strong>and</strong> provides important data on habitat usage for the management <strong>and</strong>conservation <strong>of</strong> sawfish within Australia. Overall, the sawfish moved 28 714 m at anaverage speed <strong>of</strong> 28.4 m.min -1 <strong>and</strong> was at all times within 200 m <strong>of</strong> the shoreline invery shallow water. Average water depth was 0.69 m. During the day, the sawfish wasin slightly deeper water (0.84 m) compared to the night (0.48 m). These observationswere most likely attributed to the tidal cycle during the time <strong>of</strong> the study or acombination <strong>of</strong> tidal cycle <strong>and</strong> diurnal preferences. The conservation <strong>and</strong> managementimplication <strong>of</strong> these data as well as the use <strong>of</strong> these data for future research into themovement <strong>and</strong> habitat requirements <strong>of</strong> sawfish are discussed.IV
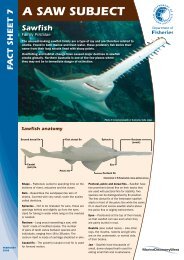
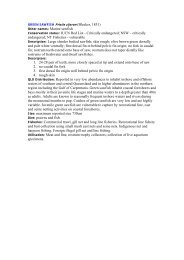
Table <strong>of</strong> contentsAcknowledgments........................................................................................................IIIExecutive summary......................................................................................................IVList <strong>of</strong> Figures...............................................................................................................VList <strong>of</strong> Tables ...............................................................................................................VIIntroduction....................................................................................................................1Methods..........................................................................................................................3Study site....................................................................................................................3Acoustic tracking <strong>and</strong> depth recording equipment ....................................................4Tagging protocol........................................................................................................6Tracking protocol.......................................................................................................7Analysis <strong>and</strong> presentation <strong>of</strong> tracking data ................................................................7Activity budget...........................................................................................................8Depth data ..................................................................................................................8Results............................................................................................................................9Depth..........................................................................................................................9Activity budget.........................................................................................................10Observations ............................................................................................................11Discussion....................................................................................................................14Movement ................................................................................................................14Depth........................................................................................................................15Management issues ..................................................................................................15Future research.........................................................................................................16References....................................................................................................................18List <strong>of</strong> FiguresFigure 1. Sawfish <strong>acoustic</strong> tracking site location map for the Mapoon region northwestern Cape York Peninsula, Queensl<strong>and</strong>. The water layer is presented as anaerial photograph with the darker patches indicative <strong>of</strong> deeper water...................4Figure 2: Position <strong>and</strong> size <strong>of</strong> <strong>acoustic</strong> <strong>tag</strong> <strong>and</strong> floats. A = LTD_10, B = <strong>acoustic</strong> <strong>tag</strong>,<strong>and</strong> C = galvanic time release. Horizontal line <strong>and</strong> arrows indicate where waterdepth was measured. ..............................................................................................6V
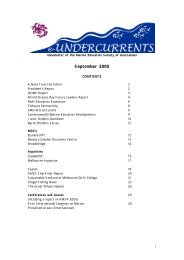
Figure 3: Data from the TDR recorded over 27 h, showing the depth pr<strong>of</strong>ile over time...............................................................................................................................10Figure 4: Map <strong>of</strong> the track <strong>of</strong> a P. zijsron <strong>acoustic</strong>ally <strong>tag</strong>ged on the 1/5/04, <strong>tag</strong>released <strong>and</strong> recovered after 27 hours..................................................................11Figure 5: Foraging area calculated from the tracking route <strong>of</strong> P. zijsron monitoredover a period <strong>of</strong> 27 hours .....................................................................................12Figure 6: Time activity budget for <strong>acoustic</strong>ally <strong>tag</strong>ged P. zijsron; top – tidal cycle <strong>and</strong>day night; middle – activity measured in metres travel per minute; <strong>and</strong> bottom –activity measured as distance in metres travelled between successive waypoints...............................................................................................................................13List <strong>of</strong> TablesTable 1: Summary <strong>of</strong> tracking data (<strong>acoustic</strong> <strong>tag</strong>) <strong>of</strong> P. zijsron at Port Musgrave......12VI
IntroductionIn Australia the family Pristidae is represented by four species, Pristis microdon, P.zijsron, P. clavata <strong>and</strong> Anoxypristis cuspidata, all <strong>of</strong> which are recognized by theIUCN Red List <strong>of</strong> Species as endangered or critically endangered (Cavanagh et al.,2003). Within Australia, the freshwater sawfish (P. microdon) is listed as threatenedunder the EPBC Act <strong>and</strong> a nomination to list the green sawfish Pristis zijsron asthreatened under the EPBC has recently been submitted.Our knowledge <strong>of</strong> the biology, ecology <strong>and</strong> behaviour <strong>of</strong> sawfish is very limited withonly two publications on their distribution <strong>and</strong> biology in Australia (Thorburn et al2003, <strong>and</strong> Peverell in press). Of the four species identified inhabiting the Queensl<strong>and</strong>Gulf <strong>of</strong> Carpentaria, Peverell (in press) documented that P. zijsron posses the lowestcatch per unit <strong>of</strong> effort (max 0.21 sawfish/500m net /day). The abundance <strong>of</strong> thisspecies was documented to be greatest in the northern region <strong>of</strong> the GoC, Weipa.There is an almost complete lack <strong>of</strong> data on habitat usage <strong>and</strong> movement patterns <strong>of</strong>sawfish both in the Australia <strong>and</strong> worldwide. Information on habitat utilization bysawfish, mainly through direct observation, suggests that mud/s<strong>and</strong> flats adjacent tomajor river <strong>and</strong> tributary channels is one <strong>of</strong> this families preferred habitats.Stobutzki et al (2002) identified sawfish as being at high risk <strong>of</strong> population decline innorthern Australia based on limited data on their life history <strong>and</strong> biology. Concernshave been expressed by scientists, resource managers, industry <strong>and</strong> conservationgroups worldwide over the observed decline in sawfish populations throughout theirrange. This is primarily due to sawfish being long-lived, slow to mature <strong>and</strong> havinglow fecundity. Sawfish’s association with the inshore coastal regions <strong>of</strong> tropical <strong>and</strong>sub-tropical waters makes them vulnerable to commercial/recreational net <strong>and</strong> linefisheries <strong>and</strong> habitat degradation. This combined with their heavily toothed rostrum,which is easily tangled in nets, results in sawfish being extremely prone to capture inany form <strong>of</strong> net fishing practice.1
Failure to underst<strong>and</strong> the life-history <strong>and</strong> habitat requirements <strong>of</strong> sawfish could resultin some fishing practices, such as gillnetting, becoming ‘key threatening processes’. Ifthis occurs, it will be necessary for fisheries to produce “threat mitigation plans” toreduce their impact. This can only be done with better knowledge <strong>of</strong> the speciesbehaviour, habitat requirements <strong>and</strong> life history patterns.The interaction <strong>of</strong> gill net fisheries with sawfish is an unknown but criticallyimportant issue that can only be addressed by developing methods <strong>of</strong> studying thesebehaviours. Knowledge <strong>of</strong> habitat usage <strong>of</strong> sawfish over a range <strong>of</strong> spatio-temporalscales is extremely important because habitat usage influences population distribution<strong>and</strong> abundance. Spatial distribution will in turn dictate the availability <strong>of</strong> a species totarget or bycatch fisheries, which in the case <strong>of</strong> sawfish will have importantconservation <strong>and</strong> fisheries management implications. A better underst<strong>and</strong>ing <strong>of</strong> thehabitat utilization <strong>of</strong> sawfish will assist in the management <strong>of</strong> specific habitatrequirements <strong>and</strong> the better management <strong>of</strong> activities threatening sawfishsustainability.The specific aims <strong>of</strong> this project are:1) To attach <strong>acoustic</strong> <strong>tag</strong>s <strong>and</strong> time depth recorders to two sub-adult (2 – 3 m TL)sawfish (either P. microdon, P. clavata or P. zijsron) <strong>and</strong> track the animalsover a 48 hour period.2) Acoustic <strong>tag</strong>s will determine short-term activity patterns, swimming speed,movement <strong>and</strong> diurnal activity within shallow coastal marine environments.3) Time depth recorders will record swimming depth <strong>and</strong> temperature. Thesedata will be then be analysed with a track <strong>of</strong> water depth to determine whicharea <strong>of</strong> the water column is utilized by the animals.4) This study will also provide additional data on the <strong>feasibility</strong> <strong>of</strong> a potentiallylarger sawfish project addressing similar objectives on a national scale. Datafrom daily movement patterns (tidal <strong>and</strong> diurnal patterns) will also assist indetermining the <strong>feasibility</strong> <strong>of</strong> using listening station arrays to monitor sawfishmovement patterns over long periods (months to years) in future research.5) Data from this research will contribute to the baseline information on sawfishbiology <strong>and</strong> ecology already collected under the FRDC funded Northern2
Australian sharks <strong>and</strong> rays: the sustainability <strong>of</strong> target <strong>and</strong> bycatch species,phase 2 FRDC 2002/064.MethodsStudy siteFour species <strong>of</strong> sawfish inhabit the northern Gulf <strong>of</strong> Carpentaria (GoC) <strong>and</strong> this areamost likely supports the largest population <strong>of</strong> sawfishes in Queensl<strong>and</strong>.Mapoon Aboriginal Community is situated on the southern side <strong>of</strong> Port Musgravelocated approximately 80km north <strong>of</strong> Weipa, latitude 12° 00’ S longitude 141° 53’ E(Figure 1). Port Musgrave was chosen as the site for this study because <strong>of</strong> thelogistical support provided by Mappon Fishing Enterprises <strong>and</strong> the known abundance<strong>of</strong> sawfish inhabiting the waters. Commercial fisher contacts obtained through theFRDC Project 99/125 - Tropical Resource Assessment Program Phase 2 observerprogram provided the project staff with accurate historical records <strong>of</strong> sawfishabundance in the region, including Weipa.Port Musgrave is a relatively shallow embayment made up <strong>of</strong> vast s<strong>of</strong>t mud flats <strong>and</strong>rocky headl<strong>and</strong>s with mangroves dominating the shoreline. The Wenlock <strong>and</strong> theDucie Rivers drain into Port Musgrave before flowing into the GoC. Water salinitylevels in Port Musgrave are heavily influenced by the freshwater flows <strong>of</strong> both theseriver systems during the monsoonal wet season. The area is part <strong>of</strong> the operationalarea <strong>of</strong> the GoC barramundi commercial net fishery. Mapoon Aboriginal communityoperates two commercial fishing licences in the area <strong>and</strong> also fish traditionally.Recreational line fishers also frequent the area during the dry season months fromMay through to October.3
Figure 1. Sawfish <strong>acoustic</strong> tracking site location map for the Mapoon region north western CapeYork Peninsula, Queensl<strong>and</strong>. The water layer is presented as an aerial photograph with thedarker patches indicative <strong>of</strong> deeper water.Acoustic tracking <strong>and</strong> depth recording equipmentThe equipment used to track the sawfish included a Sonotronics CHP-87S <strong>tag</strong> <strong>and</strong>Sonotronics ultrasonic receiver (model USR-91) <strong>and</strong> hydrophone mounted on the side<strong>of</strong> a 3.5m punt. This equipment was chosen because it has been used successfully totrack Carcharhinus leucas in freshwater <strong>and</strong> estuarine waters <strong>of</strong> the Brisbane River.The signal transmitted from the <strong>acoustic</strong> <strong>tag</strong> can be detected from a distance <strong>of</strong> 600 to1000 m. Salinity, water depth, substrate pr<strong>of</strong>ile <strong>and</strong> underwater obstacles <strong>and</strong> surface4
chop can interfere with the strength <strong>of</strong> the signal. The position <strong>of</strong> the sawfish wasestablished by using a directional hydrophone which was kept in the water with the<strong>acoustic</strong> signal monitored on a continuous basis.A Lotek LTD_10 TDR (time depth recorder) was programmed to record depth <strong>and</strong>temperature every 10 seconds. The TDR was attached to the <strong>acoustic</strong> <strong>tag</strong>, which wasthen attached to the animal via a corroding <strong>tag</strong>. A galvanic time release corrodingswivel was designed to release the <strong>tag</strong> after approximately 38 hours. This wasdependent on salinity levels <strong>and</strong> a time release trial was performed under marineconditions prior to attaching the <strong>tag</strong> to check the systems reliability. This <strong>tag</strong> corrodedafter 41 hours. Salinity levels in Port Musgrave however were a lot lower (average24ppt) than those used during the time trial. For this reason a 24 hour swivel was usedin replace <strong>of</strong> the 38 hour galvanic time release corroding swivel.A small high-density float was attached to the TDR <strong>and</strong> <strong>acoustic</strong> <strong>tag</strong> to aid in therecovery <strong>of</strong> the <strong>tag</strong> (Figure 2). Water depth (m) was recorded as the distance from thewater surface to the origin <strong>of</strong> the first dorsal fin (Figure 2).5
Figure 2: Position <strong>and</strong> size <strong>of</strong> <strong>acoustic</strong> <strong>tag</strong> <strong>and</strong> floats. A = LTD_10, B = <strong>acoustic</strong> <strong>tag</strong>, <strong>and</strong> C =galvanic time release. Horizontal line <strong>and</strong> arrows indicate where water depth was measured.Tagging protocolA sawfish (P. zijsron) was captured by gill net on the foreshore at Port Musgrave;latitude 11 57’ 192”, longitude 141 54’ 168”. It was originally planned that twosawfish were to be <strong>acoustic</strong>ally tracked over the week, however only one animal wascaught during the study. The sawfish was removed from the net using a net hook <strong>and</strong>the procedures set out by Peverell (2002). Following removal from the net a fin clipwas taken for future genetic analysis <strong>and</strong> total length (T L ) <strong>and</strong> lower jaw total length(L JTL ) were recorded. The ultrasonic <strong>tag</strong> <strong>and</strong> time depth recorder were attached via thegalvanic time release swivel attached to the first dorsal fin. The hole for the timereleaseswivel was made using a leather hole punch. A wet towel was placed over thehead <strong>of</strong> the sawfish to reduce stress.6
Tracking protocolFollowing <strong>tag</strong>ging the animal was released <strong>and</strong> the <strong>tag</strong> signal checked. Throughoutthe course <strong>of</strong> the tracking period, we tried to maintain our position so that the sawfishwas between the shoreline <strong>and</strong> the vessel. The position <strong>of</strong> the <strong>tag</strong>ged sawfish wasrecorded using a Garmin 12 portable global positioning system. Waypoints wererecorded on an opportunistic basis (but never more than 20 minutes apart) when theanimal demonstrated periods <strong>of</strong> movement. Waypoints (latitude <strong>and</strong> longitude) weretaken as close as possible to the animal (as determined by the strength <strong>of</strong> the signal)<strong>and</strong> in all instances were within 50 m <strong>of</strong> the actual position. Distance <strong>of</strong> the observingdinghy from the sawfish had no apparent influence on the animal’s behaviour.Salinity <strong>and</strong> water temperature was recorded hourly using a WTW LF340salinity/conductivity meter. The sawfish was monitored on a continuous basis untilthe time-release swivel dissolved freeing the <strong>acoustic</strong> <strong>and</strong> time depth recorder <strong>tag</strong>.Water temperature (°C) <strong>and</strong> salinity (ppt) was recorded a meter below the surface atthe beginning <strong>and</strong> end <strong>of</strong> the tracking study <strong>and</strong> at 6 hourly intervals.Analysis <strong>and</strong> presentation <strong>of</strong> tracking dataSawfish tracking waypoints were imported into MapInfo S<strong>of</strong>tware where they wereoverlayed on a geographic vector layer <strong>of</strong> Mapoon <strong>and</strong> Port Musgrave. The direction<strong>of</strong> the <strong>acoustic</strong> track was presented in the form <strong>of</strong> a route created by joining eachsuccessive waypoint with a directional arrow. A blue coloured directional arrowrepresents times <strong>and</strong> distances <strong>of</strong> rapid movement.Distance (Dist) was calculated by summing the distance (m) between successivewaypoints. Average rate (Av Rate) <strong>of</strong> foraging movement was calculated as the“Dist” divided by the “duration” <strong>of</strong> tracking; ie, total distance travelled divided by thetotal elapsed time. Maximum rate (Max Rate) was the maximum rate <strong>of</strong> displacementcalculated between any two successive waypoints. Rate <strong>of</strong> movement was recordedin metres per minute. Foraging area (km 2 ) was calculated using a modified version <strong>of</strong>the convex polygon method whereby, the foraging polygon was created by joining thewaypoints on the outer most margins <strong>of</strong> the route <strong>and</strong> the area calculated inMapInfo.7
Activity budgetAn activity time budget was calculated using Ms Excel <strong>and</strong> presented graphically as aline chart <strong>and</strong> histogram where the x-axis represents elapsed time st<strong>and</strong>ardised foreach plot; ie tidal cycle, distance moved <strong>and</strong> rate <strong>of</strong> movement. The data used tocalculate <strong>and</strong> interpret the sawfish activity budget included diurnal tide (m), route -distance travelled (m) <strong>and</strong> activity data (m.s -1 ).Depth dataData from the TDR <strong>tag</strong> was downloaded using TAGTALK s<strong>of</strong>tware provided byLotek. Pressure data was then converted into depth (m). The distance from the origin<strong>of</strong> the first dorsal fin to the TDR was subtracted from the depth recorded by the TDRto give depth at first dorsal fin origin (Figure 2).8
ResultsA female P. zijsron (355mm TL) was captured in a 165.5mm mon<strong>of</strong>ilment gillnet inapproximately 1.5 m <strong>of</strong> water <strong>and</strong> over a firm s<strong>and</strong>y substrate. The animal was <strong>tag</strong>gedwith an <strong>acoustic</strong> <strong>and</strong> time depth recorder <strong>tag</strong> (Figure 2) <strong>and</strong> released on the southernforeshore <strong>of</strong> Port Musgrave at 14:43 on the 1/5/04 <strong>and</strong> tracked continuously for a 27hour period at which time the galvanic dissolving swivel broke <strong>and</strong> released the <strong>tag</strong>.Following release the sawfish travelled in a north easterly direction along the s<strong>and</strong>yforeshore before rounding the s<strong>and</strong> spit on the southern bank <strong>of</strong> the entrance to PortMusgrave. Once in the embayment the animal travelled in a southerly directionparallel to <strong>and</strong> close to the shoreline in shallow water. In Port Musgrave the averagewater temperature was 31°C <strong>and</strong> 24ppt salinity.DepthThroughout the track the sawfish was in very shallow water (mean water depth = 0.69m) as shown by Figure 3. Water depth was recorded from the vessel <strong>and</strong> correspondedto depth <strong>of</strong> the animal. The sawfish being was in contact with or slightly above thesubstrate throughout the track. The maximum depth <strong>of</strong> the sawfish was 1.84 m whilethe minimum depth was 0.4 m. The minimum water depth recorded was limited bythe length <strong>of</strong> line attaching the <strong>tag</strong> to the dorsal fin with a depth <strong>of</strong> 0.4 m being thedepth at which the <strong>tag</strong> was on the surface. There was a significant difference betweensawfish depth during day <strong>and</strong> night, with the sawfish in deeper water (mean = 0.84 m)during the day compared to night (mean = 0.48 m).9
Time (hh:mm)015:4816:5217:5719:01Sunset20:0621:1022:1523:190:241:282:333:374:427:556:515:46Sunrise9:0010:0411:0912:1313:1814:2215:2716:3117:36-0.5Depth (m)-1-1.5-2Figure 3: Data from the TDR recorded over 27 h, showing the depth pr<strong>of</strong>ile over time.Activity budgetThe direction <strong>and</strong> position <strong>of</strong> the foraging pathway are presented in Figure 4. In totalthe sawfish travelled 28 714 m with an overall speed (distance/length <strong>of</strong> track) <strong>of</strong> 18.6m/min (Rate <strong>of</strong> movement = 0.31 m.s -1 ). The average speed (mean <strong>of</strong> distancetravelled between waypoints) was 28.4 (± 4.8 m.min -1 ). The minimum <strong>and</strong> maximumspeed recorded between 2 waypoints were 0.15 <strong>and</strong> 289 m.min -1 , respectively.The foraging area calculated over the 27 hours <strong>of</strong> continuous tracking was 8.032km 2(Figure 5)The <strong>tag</strong>ged sawfish demonstrated rapid movement on two occasions, <strong>and</strong> both were inthe early morning corresponding with the ebbing tide. During these two events thesawfish travelled a distance <strong>of</strong> 1921 <strong>and</strong> 868 metres respectively (Figure 6). Thisrapid movement took place along the channel edge between waypoints 58 – 59 <strong>and</strong> 63– 64 (Figure 4).10
ObservationsSightings <strong>of</strong> the <strong>tag</strong> breaking the surface were observed on 6 separate occasionstotalling approximately 3.5 hours. During this time the water depth was less than 0.5m. The sawfish was observed on five separate occasions <strong>and</strong> its behaviour wasinterpreted to be that <strong>of</strong> feeding with the rostrum breaching the surface in a thrashingmovement. This behaviour was usually associated with baitfish breaking the surfacefollowed by a sudden burst <strong>of</strong> movement creating large swirls <strong>and</strong> waterdisplacement.Figure 4: Map <strong>of</strong> the track <strong>of</strong> a P. zijsron <strong>acoustic</strong>ally <strong>tag</strong>ged on the 1/5/04. Tag released <strong>and</strong>recovered after 27 hours11
Figure 5: Foraging area calculated from the tracking route <strong>of</strong> P. zijsron monitored over a period<strong>of</strong> 27 hoursTable 1: Summary <strong>of</strong> tracking data (<strong>acoustic</strong> <strong>tag</strong>) <strong>of</strong> P. zijsron at Port MusgraveRate <strong>of</strong> movement (m.min -1 )T LDistance Duration <strong>of</strong>AverageSex (mm) travelled (m) track (hh:mm) Overall (± SEM) Minimum MaximumF 355 28714 27 18.6 28.4 (4.8) 0.15 28912
Tidal Range3.00Tide level (m)Activity (m/min)Distance (m)2.502.001.501.000.500.00350300250200150100500250020001500100050015:1016:33015:1016:3315:1016:3317:0117:4820:0021:1121:4522:2623:251:022:525:0617:0117:4820:0021:1121:4522:2623:25Activity time budget1:022:525:065:596:448:378:559:419:5610:4512:1312:4813:3414:0214:3515:0916:2717:356:448:378:559:419:5610:4512:1312:4813:3414:0214:3515:0916:2717:35Distance moved per observation period17:0117:4820:0021:1121:4522:2623:251:022:525:065:59Time (hh:mm)5:596:448:378:559:419:5610:4512:1312:4813:3414:0214:3515:0916:2717:35Figure 6: Time activity budget for <strong>acoustic</strong>ally <strong>tag</strong>ged P. zijsron; top – tidal cycle <strong>and</strong> day night;middle – activity measured in metres travel per minute; <strong>and</strong> bottom – activity measured asdistance in meres travelled between successive waypoints.13
DiscussionMovementA female P. zijsron (355 mm T L ) was successfully tracked for 27 h in a tropicalestuary in Northern Australia <strong>and</strong> represents the first continuous track <strong>of</strong> this speciesever recorded. This is also the first time any sawfish has been tracked in Australia.Our data show a pattern <strong>of</strong> slow near-shore movement along the southern foreshore <strong>of</strong>Port Musgrave. The position <strong>of</strong> the track <strong>and</strong> corresponding depth data gathered fromthe TDR indicate that the animal was in very shallow water (< 2.0 m) throughout thetrack (Figure 3).Despite being captured in a commercial gill net <strong>and</strong> having spent over 6 hours in thenet, the sawfish displayed a fast recovery. The animal did not move to deeper wateradjacent to release site after being released. In addition, the animal was observedfeeding within an hour <strong>of</strong> being released.Following release the animal moved parallel to the coast <strong>and</strong> into the Port Musgraveestuary. Once inside Port Musgrave, the animal spent approximately 5 h in a smallbay. During this time it was moving in an apparently r<strong>and</strong>om pattern within the bay<strong>and</strong> was observed feeding on several species <strong>of</strong> baitfish speciesDuring feeding the high density foam floats were observed on the surface for longperiods. A similar pattern <strong>of</strong> slow, short (< 1 km) <strong>and</strong> deliberate movements in asoutherly direction <strong>and</strong> parallel to shore punctuated by periods <strong>of</strong> apparently r<strong>and</strong>ommovement in a relatively small area were observed over the entire duration. Theperiods <strong>of</strong> r<strong>and</strong>om omnidirectional movement are interpreted as foraging in search <strong>of</strong>schools <strong>of</strong> baitfish located in the shallow water.Throughout the track the animal moved progressively further south <strong>and</strong> by 13:00 onthe 2 nd day had reached the most southerly point. Between 13:10 <strong>and</strong> 16:50, thesawfish moved approximately 2 km in a northerly direction along the coast. Between16:50 <strong>and</strong> the end <strong>of</strong> the track (18:19), the animal moved back <strong>and</strong> forth within asmall embayment.14
DepthA small diurnal shift in preferred water depth was apparent. On average, during theday the sawfish was in water twice as deep as during the night. This is most likelyattributed to the lack <strong>of</strong> water on the flats at low tide <strong>and</strong> the sawfish being forced intothe channel adjacent to the flats during the day. The tidal cycle would influence theforaging area made available to the sawfish for feeding.Comparing the tidal cycle data against the data from TDR <strong>tag</strong> it appears that theremight be a diurnal influence on the sawfish’s preference for water depth. Therelationship was significant for the sawfish’s preference for deeper water during theday <strong>and</strong> shallower water during the night. Further investigations are required to testthese preliminary findings. Despite these observations it appears that this sawfishdisplayed no inhibitions in moving into shallow water despite its large size (355 mmT L ).Management issuesThe preference for shallow water shown by the sawfish in this study <strong>and</strong> the fact thatit moved parallel to the shoreline suggests that sawfish may occupy a relatively smallarea <strong>of</strong> available habitat that is concentrated in a narrow strip <strong>of</strong> water adjacent to theshoreline, at least during feeding. These data are supported by studies on the smalltooth sawfish (P. perotetti) in North America (Simpfendorfer 2000; SimpfendorferPers. Comm 2003) where sawfish have been recorded along the shallow inshoreregions <strong>of</strong> the coastline. However, P zijsron have also been recorded in water depthgreater than 30 metres (Peverell & Gribble 2003) along the east coast <strong>of</strong> Queensl<strong>and</strong>.Pristis zijsron have been identified as a bycatch species <strong>of</strong> concern in the GoC inshoregill net fishery (Roel<strong>of</strong>s 2003 <strong>and</strong> Peverell in press). The reason for concern is thatsawfish are extremely vulnerable to capture because their toothed rostrum is easilyentangled in fishing net.Commercial inshore gillnet fishers in the GoC target species such as barramundi,queenfish, blue salmon, king salmon <strong>and</strong> sharks <strong>and</strong> use up to 600 m <strong>of</strong> 165.5 to15
200mm net. Generally the nets are set from the high water mark perpendicular to theshoreline in shallow water (Roel<strong>of</strong>s, 2003). Although the commercial fishers are nottargeting sawfish, given the behaviour <strong>of</strong> the sawfish we observed <strong>and</strong> the position <strong>of</strong>the nets, <strong>and</strong> it is likely that this activity would have an increased probability <strong>of</strong>capturing sawfish.This report further support the published literature on sawfish, which suggests P.zijsron have a preference at certain times for inshore shallow marine <strong>and</strong> estuarinewaters. The <strong>tag</strong>ged animal in this study was <strong>tag</strong>ged <strong>and</strong> released in a marineenvironment <strong>and</strong> was tracked in estuarine waters (salinity 24ppt).Future researchThere is clearly a need for more intensive research into the movement <strong>and</strong> habitatrequirements <strong>of</strong> sawfish as this study only provides a snapshot <strong>of</strong> movement <strong>and</strong>habitat preference for a single specimen <strong>of</strong> one species <strong>of</strong> sawfish. Due to the nature<strong>of</strong> the environment <strong>and</strong> the <strong>acoustic</strong> equipment, the animal must be constantlyfollowed to gather data on movement. A major drawback <strong>of</strong> <strong>acoustic</strong> telemetry studiesis the manpower <strong>and</strong> resources needed to continuously follow an individual for longperiods <strong>of</strong> time. While intensive experiments can be employed to obtain data overshort periods, there is a drastic need to obtain long term data on the movementpatterns <strong>and</strong> critical habitat requirements <strong>of</strong> sawfish populations.Data gathered from this present study suggest that sawfish spend a proportion <strong>of</strong> timein shallow water close to shore, which makes them an ideal c<strong>and</strong>idate for satellite <strong>tag</strong><strong>attachment</strong> as well as <strong>acoustic</strong> <strong>tag</strong> <strong>and</strong> listening stations. Swimming behaviour <strong>and</strong>depth play a major role in the success <strong>of</strong> satellite <strong>tag</strong>s which transmit a radio signal tosatellites fitted with ARGOS receivers. The <strong>tag</strong>s can only transmit a position when the<strong>tag</strong> antenna is clear <strong>of</strong> the water where there is an uninterrupted radio signal. Satellitefixes are accurate to within 150 m <strong>and</strong> position can be tracked anywhere in the world.Satellite <strong>tag</strong>s have been used to successfully track white sharks (Carcharodoncarcharias) <strong>and</strong> whale sharks (Rhychodon typus) within Australia.16
The use <strong>of</strong> arrays <strong>of</strong> listening stations to monitor sawfish movements in tropicalestuaries would also be feasible given the narrow track <strong>of</strong> the sawfish. Listeningstations (automated <strong>acoustic</strong> <strong>tag</strong> identification sites) record the presence <strong>of</strong> individual<strong>acoustic</strong> <strong>tag</strong>s <strong>and</strong> can be anchored on the sea bottom in several locations to determinerates <strong>of</strong> movement <strong>and</strong> movement patterns within an estuary. Listening station arrayshave been used to obtain critical information concerning the early life history <strong>and</strong> theimportance <strong>of</strong> nursery areas to the survival <strong>of</strong> young sharks in Florida (Heupel <strong>and</strong>Simpfendorfer 2002) as well as to gather information on the movement <strong>and</strong> migrationpatterns <strong>of</strong> critically endangered grey nurse sharks (Carcharias taurus) withinAustralia (J. D. Stevens Pers. Comm 2004)17
ReferencesCavanagh, R.D., Kyne, P.M., Fowler, S.L., Musick, J.A., <strong>and</strong> Bennett, M.B. (Ed)2003. The Conservation Status <strong>of</strong> Australasian Chondrichthans. Report <strong>of</strong> the IUCNShark Specialist Group Australia <strong>and</strong> Oceania Regional Red List workshop March2003. The University <strong>of</strong> Queensl<strong>and</strong>, School <strong>of</strong> Biomedical Sciences, Brisbane,Australia. 170 ppHeupel, MR, Simpfendorfer, CAE. 2002. Estimation <strong>of</strong> mortality <strong>of</strong> juvenile blacktipsharks, Carcharhinus limbatus, within a nursery area using telemetry data. Can. J.Fish. Aquat. Sci. 59 (4): 624 – 632.Peverell, SC. 2002 Queensl<strong>and</strong> Sawfish Identification Guide. Department <strong>of</strong> PrimaryIndustries Queensl<strong>and</strong>, QI03038Peverell SC, Gribble NA. 2003. Sawfish (F. Pristidae) in the Northern Planning Area– Description <strong>of</strong> key species groups for the National Oceans OfficeRoel<strong>of</strong>s, A. 2003. Ecological assessment <strong>of</strong> the Gulf <strong>of</strong> Carpentaria inshore finfishfishery - A report to Environment Australia on the sustainable management <strong>of</strong> a multispecies tropical gillnet fishery. Department <strong>of</strong> Primary Industries, Queensl<strong>and</strong>.Simpfendorfer, CA. 2000. Predicting population recovery rates for endangeredwestern Atlantic sawfishes using demographic analysis. Env. Biol. Fish. 58 (4): 371-377.Stobutzki, IC, Miller, JM, Heales, DS, <strong>and</strong> Brewer, DT. (2002). Sustainability <strong>of</strong>elasmobranchs caught as bycatch in a tropical prawn (shrimp) trawl fishery. FisheryBulletin. 100: 800-821.Thorburn, DC, Peverell, SC, Stevens, JD, Last, PR, <strong>and</strong> Rowl<strong>and</strong>, AJ. (2003). Status<strong>of</strong> freshwater <strong>and</strong> estuarine elasmobranchs in Northern Australia. Report to NaturalHeri<strong>tag</strong>e Trust, Canberra.18