Florida NYTD Survey: What Young Adults Who Have Aged Out of ...
Florida NYTD Survey: What Young Adults Who Have Aged Out of ...
Florida NYTD Survey: What Young Adults Who Have Aged Out of ...

Create successful ePaper yourself
Turn your PDF publications into a flip-book with our unique Google optimized e-Paper software.
<strong>Florida</strong> <strong>NYTD</strong> <strong>Survey</strong>:<strong>What</strong> <strong>Young</strong> <strong>Adults</strong> <strong>Who</strong> <strong>Have</strong> <strong>Aged</strong><strong>Out</strong> <strong>of</strong> Foster Care Can Tell Us
The <strong>Florida</strong>Department <strong>of</strong>Children and Familiesis listening to youngadults who haveaged out <strong>of</strong> thestate’s foster caresystem.With our partners across the state, each year we survey youngadults aged 18-22 who have aged out <strong>of</strong> the foster care systemto ask about their education, housing, employment, health andwell-being.Here are their answers.
About the <strong>Florida</strong> National Youth in Transition Database <strong>Survey</strong>The goal <strong>of</strong> the <strong>Florida</strong> <strong>NYTD</strong> survey is to have our young adults tell us from their perspective how they understand their lives and services tobe. The survey can be completed on the computer or paper and the survey response data can be used to evaluate and improve theindependent living services we provide as mandated by <strong>Florida</strong> Statutes.Congress established the John H. Chafee Foster Care Independence Program in 1999. In addition to providing states with funding to assistyouth transitioning out <strong>of</strong> the foster care system, the Chafee Foster Care Independence Program required the federal Administration forChildren and Families to collect data from each state on the independent living services provided to youth and young adults and to establishoutcome measures that can be used to evaluate the state’s ability and success in preparing the youth in care to transition into adulthood. Tomeet the requirements for data collection and measuring youth outcomes, the National Youth in Transition Database, or <strong>NYTD</strong>, wasdeveloped.In 2011, the <strong>Florida</strong> Department <strong>of</strong> Children and Families implemented an expanded version <strong>of</strong> <strong>NYTD</strong> to be used on an annual basis to surveyour young people ages 18-22 who have aged out the state foster care system. The Department <strong>of</strong> Children and Families’ commitment toensuring that we incorporate feedback from our youth and young adults as an integral part <strong>of</strong> our child welfare system has made <strong>Florida</strong> anational leader.The <strong>Florida</strong> <strong>NYTD</strong> online survey developed by Cby25 ® Initiative system replicates many <strong>of</strong> the <strong>NYTD</strong> Plus survey questions published in :National Youth in Transition Database: Instructional Guidebook and Architectural Blueprint © 2009, Authored by: Amy Dworsky, Chapin Hall atthe University <strong>of</strong> Chicago, and Christina Crayton, the American Public Human Services Association.Recognizing there is a difference in perspective from those who have grown up in the foster care system and those who are working in thefoster care system, <strong>Florida</strong>’s use <strong>of</strong> the <strong>NYTD</strong> survey gives our young adults who have aged out <strong>of</strong> foster care the ability to inform the decisionmakers in child welfare, the Legislature, and the courts on what is working and how they fare when they leave our foster care system.FINAL <strong>Florida</strong> <strong>NYTD</strong> <strong>Survey</strong> Report -Spring 2012: Ages 18-22 Version Page 1 <strong>of</strong> 30
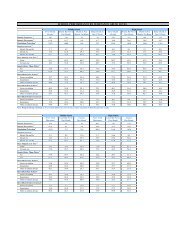
.<strong>Who</strong> completedthe survey?CBC Agency Female Male TotalBig Bend CBC East 14 21 35Big Bend CBC West 3 3 6Brevard Family Partnership 23 21 43CBC <strong>of</strong> Central <strong>Florida</strong> 54 53 107CBC <strong>of</strong> Central <strong>Florida</strong> /Seminole 19 13 32Child and Family Connections, Inc. 61 46 107ChildNet Inc. 133 95 228Children's Network <strong>of</strong> SW <strong>Florida</strong> 10 4 14Community Partnership for Children, Inc. 28 9 37Eckerd Community Alternatives Inc./Pinellas& Pasco 97 70 167Families First Network 67 43 110Family Support Services 144 86 230Heartland For Children Inc. 29 11 40Eckerd Community Alternatives Inc./Hillsborough 99 69 168Kids Central, Inc. 23 10 33Kids First <strong>of</strong> <strong>Florida</strong> Inc 15 10 25Our Kids Inc 178 110 288Partnership for Strong Families 35 28 63Family Integrity Program 6 4 10United For Families Inc. 17 10 27Safe Children Coalition 27 23 50Statewide 1082 739 18211,821 young adults ages 18-22, who aged out<strong>of</strong> <strong>Florida</strong>’s foster care system, completed theSpring 2012: <strong>Florida</strong> <strong>NYTD</strong> survey.Age Female Male Total18 271 211 48219 246 179 42520 255 155 41021 181 124 30522 129 70 199Total 1,082 739 1,821FINAL <strong>Florida</strong> <strong>NYTD</strong> <strong>Survey</strong> Report -Spring 2012: Ages 18-22 Version Page 2 <strong>of</strong> 30
Q: Which <strong>of</strong> the following documents do you currently have in your possession?Select all that apply*1,821 respondentsAGE 18 19 20 21 22 TotalSocial Security card 400 348 347 261 168 1,524Birth certificate 368 326 326 241 151 1,412Pro<strong>of</strong> <strong>of</strong> citizenship or residency(Green card) 80 69 60 56 25 290Pro<strong>of</strong> <strong>of</strong> immunization 124 97 105 80 33 439Driver's license 153 191 231 173 124 872Other state identification 223 188 149 103 52 715None <strong>of</strong> the above 11 13 12 7 5 48Declined 12 11 8 7 6 44Do not know 5 9 5 7 2 28Total 1376 1252 1243 935 566 5372ImportantDocumentsComment:More than 85% <strong>of</strong> <strong>Florida</strong>’ssurvey participants report theyare enrolled/attending aneducational or vocationalprogramQ: Currently are you enrolled in and attending high school, GED classes, post-highschool vocational training or college?AGE 18 19 20 21 22 TotalYes 422 354 345 255 145 1,521No 47 60 56 46 49 258Declined 13 11 9 4 5 42Total 482 425 410 305 199 1,821Percentage Yes [Does not include Declined] 90% 86% 86% 85% 75% 85%EducationStatusFINAL <strong>Florida</strong> <strong>NYTD</strong> <strong>Survey</strong> Report -Spring 2012: Ages 18-22 Version Page 3 <strong>of</strong> 30
Note: This question is asked if: <strong>Young</strong> adult responded Yes “they are enrolled in and attending high school,GED classes, post-high school vocational training or college”Q: Are you currently enrolled in school full-time or part-time?AGE 18 19 20 21 22 TotalFull-time 388 320 306 218 123 1,355Part-time 25 29 29 28 20 131Declined 1 2 5 6 2 16Do not know 8 3 5 3 0 19Total 422 354 345 255 145 1,521Note: This question is asked if: <strong>Young</strong> adult responded Yes “they are enrolled in and attendinghigh school, GED classes, post-high school vocational training or college”Q: In what type <strong>of</strong> school or educational program are you currently enrolled?AGE 18 19 20 21 22 Total %Regular high school 179 64 26 11 3 283 19%GED program 119 84 79 45 27 354 24%Vocational school 18 36 39 46 20 159 11%Community, junior or two year college 60 109 113 84 54 420 28%Four-year college or university 22 42 60 53 29 206 14%Graduate or pr<strong>of</strong>essional school 3 1 6 1 2 13 1%Other 14 12 17 11 9 63 4%Declined 2 0 4 3 0 9 **Do not know 5 6 1 1 1 14 **Total 422 354 345 255 145 1,521 **►Note: % does not include Declined and Do not knowEducationStatusFINAL <strong>Florida</strong> <strong>NYTD</strong> <strong>Survey</strong> Report -Spring 2012: Ages 18-22 Version Page 4 <strong>of</strong> 30
Note: This question is asked if: <strong>Young</strong> adult responded None <strong>of</strong> the above as the “highest educational degree that you havereceived” or <strong>Young</strong> adult responded they have a Vocational Certificate or Vocational License and respondedNo, Declined, Do not know when asked if they have a high school diploma or GEDQ: Which <strong>of</strong> the following best describes the highest grade you have completed? (If you arecurrently enrolled in school, do not include the grade that you are in.)*595 respondentsAGE 18 19 20 21 22 Total8th grade or less 11 7 4 6 0 289th grade 31 21 16 2 3 7310th grade 64 30 22 9 5 13011th grade 113 56 38 21 14 24212th grade 30 19 17 10 9 85Declined 14 1 3 5 0 23Do not know 7 5 1 1 0 14Total 270 139 101 54 31 595EducationalAchievementComment:Over 20% <strong>of</strong>, <strong>Florida</strong>’ssurvey participants report theirhighest grade completed as10 th or 11 th grade.Q: Are there any barriers that are preventing you from continuing youreducation?AGE 18 19 20 21 22 TotalYes 32 32 39 25 22 150No 306 183 137 87 64 777Declined 29 11 11 5 6 62Do not know 12 11 5 4 2 34Total 379 237 192 121 94 1,023Percentage Yes[Does notinclude: Declined /I do not know] 9% 15% 22% 22% 26% 16%If YES: there are barriers Q: <strong>What</strong> is the biggest barrier preventing you from continuing your education?*150 respondentsAGE 18 19 20 21 22 Total %I have no way to pay for school 2 1 2 2 1 8 6%I need to work full time 1 2 3 3 1 10 8%I have child care responsibilities 3 3 7 4 3 20 16%I don't have transportation 4 1 5 1 4 15 12%I have been discouraged bysignificant others 2 1 0 0 1 4 3%I have academic difficulties 4 5 8 1 4 22 18%Other 6 11 11 10 7 45 36%Declined 6 3 1 2 1 13 **Do not know 4 5 2 2 0 13 **Total 32 32 39 25 22 150 **►Note: % does not include Declined and Do not knowFINAL <strong>Florida</strong> <strong>NYTD</strong> <strong>Survey</strong> Report -Spring 2012: Ages 18-22 Version Page 6 <strong>of</strong> 30
Note: This question is asked if: <strong>Young</strong> adult responded High School Diploma/GED, Associate's Degree,If YES: Bachelor's there Degree, are barriers Higher Degree as the “highest educational degree that you have received” or<strong>Young</strong> adults who stated they have a Vocational Certificate or Vocational License and responded Yes when askedif they have a high school diploma or GEDQ: <strong>Have</strong> you completed one or more years <strong>of</strong> college?Education:Post -SecondaryAGE 18 19 20 21 22 TotalYes 23 86 160 127 102 498No 165 173 133 110 60 641Declined 1 8 4 2 2 17Do not know 6 4 2 7 1 20Total 195 271 299 246 165 1,176Percentage Yes [Does notinclude: Declined /I do not know] 12% 33% 55% 54% 63% 44%Note: This question is asked if: <strong>Young</strong> adult responded they are in a post-secondary program such as college, vocational, or graduate school.Q: How are you paying for your education? Select all that applyAGE 18 19 20 21 22 TotalScholarships/fellowships/grants 59 113 123 103 58 456Student loans 8 21 35 31 20 115Earnings from employment 0 0 3 0 2 5Savings 1 3 5 4 5 18Education and Training Voucher (ETV) 17 30 35 29 18 129Other assistance from a child welfare agency or independent livingprogram 26 55 69 59 26 235Assistance from family or friends (including spouse/partner and birth,foster parents or adoptive parents) 2 2 5 2 1 12Other (please specify) 4 8 5 11 4 32Declined 6 4 2 2 1 15Do not know 5 6 6 7 0 24Total 105 192 226 192 110 825FINAL <strong>Florida</strong> <strong>NYTD</strong> <strong>Survey</strong> Report -Spring 2012: Ages 18-22 Version Page 7 <strong>of</strong> 30
Q: Currently are you employed full- time?AGE 18 19 20 21 22 TotalYes 8 11 20 16 17 72No 460 396 382 284 175 1,697Declined 14 18 8 5 7 52Total 482 425 410 305 199 1,821Percentage Yes [Does notinclude: Declined] 2% 3% 5% 5% 9% 4%EmploymentQ: Currently are you employed part- time?AGE 18 19 20 21 22 TotalYes 42 51 67 49 41 250No 423 356 332 250 148 1,509Declined 17 18 11 6 10 62Total 482 425 410 305 199 1,821Percentage Yes [Does notinclude: Declined] 9% 13% 17% 16% 22% 14%CommentFor the 22 year olds whoresponded to the survey question:9% report they are employed full time22% report they are employed part-timeFINAL <strong>Florida</strong> <strong>NYTD</strong> <strong>Survey</strong> Report -Spring 2012: Ages 18-22 Version Page 8 <strong>of</strong> 30
part-About the questions on this page: The following questions are asked onlyUtime” *310 respondents Note: 12 young adults responded yes to both questionsU<strong>of</strong> young adults who state “they are employed full-time orQ: <strong>What</strong> is your hourly pay?AGE 18 19 20 21 22 Total< FL Min Wage+Tips 4 6 10 4 4 28FL Min Wage: $7.25/hour 19 24 25 21 20 109Above Minimum Wageto $8.00/hour 9 9 12 8 9 47$8.01 to $10.00/hour 10 13 24 18 14 79$10.01 to $12.00/hour 1 1 2 2 4 10$12.01 to $14.00/hour 0 1 3 2 3 9$14.01 to $16.00/hour 0 0 0 2 0 2Over $16.00/hour 0 0 0 1 0 1Declined 3 5 2 2 1 13Do not know 4 2 4 1 1 12Total 50 61 82 61 56 310Q: On average, how many hours do you work perweek?AGE 18 19 20 21 22 Total
notAbout the questions on this page: The following questions are asked only <strong>of</strong> young adults who state when asked in the survey “they areemployed full or part time” and/or “they have never had a job for which they were paid” or respond “do not know” or “declined” to these surveyquestionsQ: <strong>Have</strong> you had a job for which you were paid at any time during the past year?AGE 18 19 20 21 22 TotalYes 6 9 5 1 3 24No 246 170 107 74 23 620Declined 19 15 8 8 14 64Do not know 4 4 3 2 1 14Total 275 198 123 85 41 722Percentage Yes [Does not include: Declined/I do notknow] 2% 5% 4% 1% 12% 4%EmploymentQ: <strong>Have</strong> you been doing anything to find a job during the past month?AGE 18 19 20 21 22 TotalYes 230 216 201 164 100 911No 162 113 110 66 29 480Declined 32 26 11 10 13 92Do not know 8 9 6 4 1 28Total 432 364 328 244 143 1,511Percentage Yes[Does not include: Declined/I donot know] 59% 66% 65% 71% 78% 65%FINAL <strong>Florida</strong> <strong>NYTD</strong> <strong>Survey</strong> Report -Spring 2012: Ages 18-22 Version Page 10 <strong>of</strong> 30
Q. In the past year, did you complete an apprenticeship, internship, or other on-the-job training,either paid or unpaid?Preparation forEmployment AGE 18 19 20 21 22 TotalYes 72 87 83 68 43 353No 393 313 315 224 145 1,390Declined 17 25 12 13 11 78Total 482 425 410 305 199 1,821Percentage Yes [Does not include:Declined] 15% 22% 21% 23% 23% 20%FINAL <strong>Florida</strong> <strong>NYTD</strong> <strong>Survey</strong> Report -Spring 2012: Ages 18-22 Version Page 11 <strong>of</strong> 30
Q: Which best describes your current living situation? Select OneAGE 18 19 20 21 22 Total %Safe & StableHousingI am living in my own apartment, house, or trailer 216 207 226 182 121 952 54%I am living with birth or adoptive parents 43 30 24 10 5 112 6%I am living with a spouse/partner 16 21 19 15 15 86 5%I am living with other family members 51 44 35 15 13 158 9%I am living with former foster parents 27 14 14 13 7 75 4%I am living with friends or a roommate 66 51 53 36 20 226 13%I am living in a foster home 6 2 4 0 2 14 1%I am living in a group care setting (including a group home orresidential care facility 18 5 9 6 4 42 2%I am living in a college dormitory or residence hall 4 7 4 2 2 19 1%I am living in military barracks 1 0 0 0 1 2
Q: In how many different places have you lived during the past twelvemonths? Please include the place in which you are currently livingAGE 18 19 20 21 22 Total1 127 132 137 101 80 5772 134 127 122 87 46 5163 48 44 43 33 21 1894 21 20 19 20 7 875 or more 29 24 22 9 5 89Declined 75 47 45 36 31 234Do Not Know 48 31 22 19 9 129Total 482 425 410 305 199 1821Comment:Over 10% <strong>of</strong> <strong>Florida</strong>’ssurvey participants report theyhave lived in three differentplaces in the past12 mothsSafe & StableHousingFINAL <strong>Florida</strong> <strong>NYTD</strong> <strong>Survey</strong> Report -Spring 2012: Ages 18-22 Version Page 13 <strong>of</strong> 30
Safe & StableHousingQ: Do you feel safe inside your home?AGE 18 19 20 21 22 TotalYes 451 390 378 278 186 1,683No 11 13 17 13 5 59Declined 10 16 4 7 8 45Do not know 10 6 11 7 0 34Total 482 425 410 305 199 1,821Percentage Yes 98% 97% 96% 96% 97% 97%►Percentage Yes: [Does not include: Declined /I do not know]Q: Do you feel safe in your neighborhood?AGE 18 19 20 21 22 TotalYes 434 379 355 263 171 1,602No 29 24 41 26 18 138Declined 12 14 6 7 6 45Do not know 7 8 8 9 4 36Total 482 425 410 305 199 1,821Percentage Yes 94% 94% 90% 91% 90% 92%►Percentage Yes: [Does not include: Declined /I do not know]Q: <strong>Have</strong> you ever couch surfed or moved from house to house because you didn’t have apermanent place to stay?AGE 18 19 20 21 22 TotalYes 152 142 168 133 88 683No 283 259 222 159 95 1,018Declined 35 19 15 7 14 90Do not know 12 5 5 6 2 30Total 482 425 410 305 199 1,821Percentage Yes 35% 35% 43% 46% 48% 40%►Percentage Yes: [Does not include: Declined /I do not know]FINAL <strong>Florida</strong> <strong>NYTD</strong> <strong>Survey</strong> Report -Spring 2012: Ages 18-22 Version Page 14 <strong>of</strong> 30
About the questions on this page: The following questions are asked Uonly U<strong>of</strong> young adults who respond UyesU to thequestionQ: <strong>Have</strong> you ever been homeless?AGE 18 19 20 21 22 TotalYes 97 104 117 101 73 492No 368 305 277 193 117 1,260Declined 17 16 16 11 9 69Total 482 425 410 305 199 1,821Percentage Yes [Does not include: Declined] 21% 25% 30% 34% 38% 28%Safe & StableHousingQ: How many times were you homeless?AGE 18 19 20 21 22 Total0 1 0 0 0 0 11 36 39 50 45 32 2022 13 19 20 20 19 913 11 7 15 10 7 504 3 9 7 3 1 235 or more 10 5 7 7 5 34Declined 9 11 9 7 3 39Do not know 14 14 9 9 6 52Total 97 104 117 101 73 492Q: <strong>What</strong> is the longest period <strong>of</strong> homelessness you experienced?AGE 18 19 20 21 22 TotalOne night 6 6 14 3 5 34More than one night but lessthan one week 20 23 23 14 10 90At least one week but lessthan one month 16 19 19 24 13 91At least one month but lessthan three months 20 18 16 20 12 86At least three months but lessthan six months 11 16 19 18 11 75At least six months but lessthan 1 year 7 8 11 9 13 48At least one year 9 6 9 7 6 37Declined 4 6 2 3 2 17Do not know 4 2 4 3 1 14Total 97 104 117 101 73 492FINAL <strong>Florida</strong> <strong>NYTD</strong> <strong>Survey</strong> Report -Spring 2012: Ages 18-22 Version Page 15 <strong>of</strong> 30
Q: Do you pay for your housing?AGE 18 19 20 21 22 TotalYes 400 346 344 265 167 1,522No 59 58 50 27 25 219 Safe & StableDeclined 18 16 9 9 6 58HousingDo not know 5 5 7 4 1 22Total 482 425 410 305 199 1,821Percentage Yes 87% 86% 87% 91% 87% 87%►Percentage Yes: [Does not include: Declined /I do not know]If YES to the question: Do you pay for your housing?Q: After paying for your housing, do you still have enough for your otherliving expenses such as food, transportation, or utilities?AGE 18 19 20 21 22 TotalYes 320 254 239 185 101 1,099No 66 80 92 71 59 368Declined 3 6 9 2 3 23Do not know 11 6 4 7 4 32Total 400 346 344 265 167 1,522Percentage Yes 83% 76% 72% 72% 63% 75%►Percentage Yes: [Does not include: Declined /I do not know]FINAL <strong>Florida</strong> <strong>NYTD</strong> <strong>Survey</strong> Report -Spring 2012: Ages 18-22 Version Page 16 <strong>of</strong> 30
Q. Do you have a reliable means <strong>of</strong> transportation to school and/or work?AGE 18 19 20 21 22 TotalYes 365 316 323 228 147 1,379Transportation No 84 86 73 60 44 347Declined 20 12 9 9 6 56Do not know 13 11 5 8 2 39Total 482 425 410 305 199 1,821Percentage Yes 81% 79% 82% 79% 77% 80%►Percentage Yes: [Does not include: Declined /I do not know]Q. Do you currently have an open bank account, such as a checking or savingsaccount?AGE 18 19 20 21 22 TotalYes 355 292 273 201 118 1,239No 116 116 126 96 71 525Declined 8 10 5 6 8 37Do not know 3 7 6 2 2 20Total 482 425 410 305 199 1,821Percentage Yes 75% 72% 68% 68% 62% 70%►Percentage Yes: [Does not include: Declined /I do not know]BankingFINAL <strong>Florida</strong> <strong>NYTD</strong> <strong>Survey</strong> Report -Spring 2012: Ages 18-22 Version Page 17 <strong>of</strong> 30
Q: Currently are you receiving social security payments (Supplemental SecurityIncome (SSI, Social Security Disability Insurance (SSDI), or dependents’ payments)?AGE 18 19 20 21 22 TotalYes 84 39 29 29 11 192No 386 376 373 266 181 1,582Declined 12 10 8 10 7 47Total 482 425 410 305 199 1,821Percentage Yes[Does not include: Declined] 18% 9% 7% 10% 6% 11%Q: Currently are you using a scholarship, grant, stipend, student loan, voucher orother type <strong>of</strong> educational financial aid to cover any educational expenses?AGE 18 19 20 21 22 TotalYes 159 198 224 160 104 845No 305 214 177 136 90 922Declined 18 13 9 9 5 54Total 482 425 410 305 199 1,821Percentage Yes[Does not include: Declined] 34% 48% 56% 54% 54% 48%Other Income &Financial SupportQ: Currently are you receiving public food assistance?AGE 18 19 20 21 22 TotalYes 194 206 180 161 101 842No 274 212 227 139 92 944Declined 14 7 3 5 6 35Total 482 425 410 305 199 1821Percentage Yes[Does not include Declined] 41% 49% 44% 54% 52% 47%FINAL <strong>Florida</strong> <strong>NYTD</strong> <strong>Survey</strong> Report -Spring 2012: Ages 18-22 Version Page 18 <strong>of</strong> 30
Q: Currently are you receiving ongoing welfare payments from the government tosupport your basic needs?Other Income &Financial SupportAGE 18 19 20 21 22 TotalYes 57 39 29 22 15 162No 412 372 370 276 176 1606Declined 13 14 11 7 8 53Total 482 425 410 305 199 1821Percentage Yes[Does not include: Declined] 12% 9% 7% 7% 8% 9%Q: Currently are you receiving any sort <strong>of</strong> housing assistance from the government, suchas living in public housing or receiving a housing voucher?AGE 18 19 20 21 22 TotalYes 44 33 40 23 17 157No 423 378 363 275 174 1613Declined 15 14 7 7 8 51Total 482 425 410 305 199 1821Percentage Yes[Does not include: Declined] 9% 8% 10% 8% 9% 9%Q: Currently are you receiving any periodic and/or significant financial resources orsupport from another source not previously indicated and excluding paid employment?AGE 18 19 20 21 22 TotalYes 85 60 45 43 16 249No 378 343 353 253 177 1,504Declined 19 22 12 9 6 68Total 482 425 410 305 199 1,821Percentage Yes[Does not include: Declined] 18% 15% 11% 15% 8% 14%FINAL <strong>Florida</strong> <strong>NYTD</strong> <strong>Survey</strong> Report -Spring 2012: Ages 18-22 Version Page 19 <strong>of</strong> 30
Q: <strong>Have</strong> you ever been arrested?AGE 18 19 20 21 22 TotalYes180 155 157 122 74 688No272 244 232 164 111 1,023Declined21 23 18 16 14 92Do not know9 3 3 3 0 18Total482 425 410 305 199 1,821Percentage Yes 40% 39% 40% 43% 40% 40%►Percentage Yes: [Does not include: Declined /I do not know]Health & Well Being•Criminal JusticeSystemQ: <strong>Have</strong> you ever been confined in a jail, prison, correctional facility, or juvenile or communitydetention facility, in connection with allegedly committing a crime?AGE 18 19 20 21 22 TotalYes 142 110 117 86 51 506No 312 289 269 199 134 1,203Declined 25 24 20 17 13 99Do not know 3 2 4 3 1 13Total 482 425 410 305 199 1,821Percentage Yes 31% 28% 30% 30% 28% 30%►Percentage Yes: [Does not include: Declined /I do not know]FINAL <strong>Florida</strong> <strong>NYTD</strong> <strong>Survey</strong> Report -Spring 2012: Ages 18-22 Version Page 20 <strong>of</strong> 30
Comment:Of the 199 young adults age22 who completed the survey; over36% report they have childrenQ: <strong>Have</strong> you ever given birth or fathered any children that were born? * 1313 respondentsAGE 18 19 20 21 22Female Male Total Female Male Total Female Male Total Female Male Total Female Male TotalYes 47 14 61 75 23 98 94 18 112 84 19 103 63 9 72No 130 118 248 94 97 191 89 81 170 60 63 123 43 39 82Declined 10 13 23 4 5 9 6 5 11 4 4 8 2 0 2Total 187 145 332 173 125 298 189 104 293 148 86 234 108 48 156Percentage Yes 27% 11% 20% 44% 19% 34% 51% 18% 40% 58% 23% 46% 59% 19% 47%►Percentage Yes: [Does not include: Declined]Q: <strong>Have</strong> you received family planning counseling or services during the past two years?AGE 18 19 20 21 22 TotalYes 85 47 29 28 12 201No 343 337 352 242 167 1,441Declined 30 20 14 20 11 95Do not know 24 21 15 15 9 84Total 482 425 410 305 199 1,821Percentage Yes 20% 12% 8% 10% 7% 12%►Percentage Yes: [Does not include: Declined /I do not know]Health & Well Being•ChildrenFINAL <strong>Florida</strong> <strong>NYTD</strong> <strong>Survey</strong> Report -Spring 2012: Ages 18-22 Version Page 21 <strong>of</strong> 30
Q: Currently are you on Medicaid?Q: Currently do you have health insurance, other than Medicaid?AGE 18 19 20 21 22 TotalYes 395 350 305 123 67 1,240No 61 56 91 176 124 508Declined 26 19 14 6 8 73Total 482 425 410 305 199 1,821Percentage Yes[Does not include: Declined]87% 86% 77% 41% 35% 71%AGE 18 19 20 21 22 TotalYes 108 77 74 36 24 319No 324 303 308 248 165 1,348Declined 14 18 7 6 9 54Do not know 36 27 21 15 1 100Total 482 425 410 305 199 1,821Percentage Yes 25% 20% 19% 13% 13% 19%►Percentage Yes: [Does not include: Declined /I do not know]Q: Has there been a time during the past two years when you did not getmedical care for a physical health problem that you thought you needed?Health & Well Being•Access to HealthCareAGE 18 19 20 21 22 TotalYes 58 55 46 62 57 278No 362 327 327 211 119 1,346Declined 20 17 16 16 15 84Do not know 42 26 21 16 8 113Total 482 425 410 305 199 1,821Percentage Yes 14% 14% 12% 23% 32% 17%►Percentage Yes: [Does not include: Declined /I do not know]FINAL <strong>Florida</strong> <strong>NYTD</strong> <strong>Survey</strong> Report -Spring 2012: Ages 18-22 Version Page 22 <strong>of</strong> 30
Q: Has there been a time during the past two years when you did not gettreatment for a mental health problem that you thought you needed?AGE 18 19 20 21 22 TotalYes 29 18 18 31 21 117No 391 359 348 241 157 1,496Declined 26 22 24 21 14 107Do not know 36 26 20 12 7 101Total 482 425 410 305 199 1,821Percentage Yes 7% 5% 5% 11% 12% 7%►Percentage Yes: [Does not include: Declined /I do not know]Q: Has there been a time during the past two years when you did not get dentalcare that you thought you needed?AGE 18 19 20 21 22 TotalYes 83 63 70 77 73 366No 346 314 306 189 103 1,258Health & Well Being Declined 23 27 18 22 13 103•Access to HealthCareDo not know 30 21 16 17 10 94Total 482 425 410 305 199 1,821Percentage Yes 19% 17% 19% 29% 41% 23%►Percentage Yes: [Does not include: Declined /I do not know]FINAL <strong>Florida</strong> <strong>NYTD</strong> <strong>Survey</strong> Report -Spring 2012: Ages 18-22 Version Page 23 <strong>of</strong> 30
Q: When did you last have a physical examination by a doctor, nursepractitioner, physician’s assistant or other health care pr<strong>of</strong>essional?AGE 18 19 20 21 22 TotalLess than a year ago 333 227 222 160 96 1,0381 to 2 years ago 89 125 113 67 33 427More than 2 years ago 10 28 39 41 50 168Never 5 7 3 3 4 22Declined 14 12 10 14 9 59Do not know 31 26 23 20 7 107Total 482 425 410 305 199 1,821Health & Well Being•Physical HealthQ: How many times have you visited an emergency roomfor medical care during the past two years?18 19 20 21 22 Total0 113 96 91 67 46 4131 77 74 55 54 24 2842 45 36 50 33 26 1903 20 23 40 22 11 1164 14 16 11 12 5 585 10 10 15 4 13 526 or more 18 22 23 8 11 82Declined 75 64 55 51 24 269Do not know 110 84 70 54 39 357Total 482 425 410 305 199 1,821FINAL <strong>Florida</strong> <strong>NYTD</strong> <strong>Survey</strong> Report -Spring 2012: Ages 18-22 Version Page 24 <strong>of</strong> 30
Q: When did you last have a dental examination by a dentist or hygienist?AGE 18 19 20 21 22 TotalLess than a year ago 276 165 144 79 38 7021 to 2 years ago 135 148 125 96 64 568More than 2 years ago 24 56 97 85 71 333Never 4 5 4 2 5 20Declined 16 17 11 16 10 70Do not know 27 34 29 27 11 128Total 482 425 410 305 199 1,821Health & Well Being•DentalFINAL <strong>Florida</strong> <strong>NYTD</strong> <strong>Survey</strong> Report -Spring 2012: Ages 18-22 Version Page 25 <strong>of</strong> 30
Q: Are you currently receiving counseling for a psychological or emotional problem?AGE 18 19 20 21 22 TotalYes 57 38 29 14 14 152No 378 358 358 258 170 1,522Declined 31 19 14 24 9 97Do not know 16 10 9 9 6 50Total 482 425 410 305 199 1,821Percentage Yes 13% 10% 7% 5% 8% 9%►Percentage Yes: [Does not include: Declined /I do not know]Q: Were you prescribed medication or a psychological or emotional problem during thepast two years?Health & Well Being•Mental HealthAGE 18 19 20 21 22 TotalYes 87 46 46 27 22 228No 344 348 341 249 159 1,441Declined 34 18 13 21 11 97Do not know 17 13 10 8 7 55Total 482 425 410 305 199 1,821Percentage Yes 20% 12%►Percentage Yes: [Does not include: Declined /I do not know]12% 10% 12% 14%FINAL <strong>Florida</strong> <strong>NYTD</strong> <strong>Survey</strong> Report -Spring 2012: Ages 18-22 Version Page 26 <strong>of</strong> 30
Q: <strong>Have</strong> you ever referred yourself or has someone else referred you for an alcohol ordrug abuse assessment or counseling?AGE 18 19 20 21 22 TotalYes 71 39 38 24 13 185No 394 368 352 272 178 1,564Declined 17 18 20 9 8 72Total 482 425 410 305 199 1,821Percentage Yes[Does not include: Declined]15% 10% 10% 8% 7% 11%Health & Well Being•Substance AbuseQ: Are you currently receiving treatment for an alcohol or substance abuse problem?AGE 18 19 20 21 22 TotalYes 12 9 4 4 4 33No 416 387 384 267 177 1,631Declined 35 20 12 25 13 105Do not know 19 9 10 9 5 52Total 482 425 410 305 199 1,821Percentage Yes 3% 2% 1% 1% 2% 2%►Percentage Yes: [Does not include: Declined /I do not know]FINAL <strong>Florida</strong> <strong>NYTD</strong> <strong>Survey</strong> Report -Spring 2012: Ages 18-22 Version Page 27 <strong>of</strong> 30
Q: Currently is there at least one adult in your life, other than your caseworker, to whom youcan go for advice or emotional support?AGE 18 19 20 21 22 TotalYes 419 366 341 246 157 1,529No 51 49 59 51 36 246Declined 12 10 10 8 6 46Total 482 425 410 305 199 1,821Percentage Yes[Does not include: Declined]89% 88% 85% 83% 81% 86%PermanentRelationships &ConnectionsQ: Do you currently have a close relationship with any members <strong>of</strong> your biological family?AGE 18 19 20 21 22 TotalYes 338 287 279 200 120 1,224No 122 118 118 94 70 522Declined 13 17 8 7 7 52Do not know 9 3 5 4 2 23Total 482 425 410 305 199 1,821Percentage Yes 73% 71% 70% 68% 63% 70%►Percentage Yes: [Does not include: Declined /I do not know]FINAL <strong>Florida</strong> <strong>NYTD</strong> <strong>Survey</strong> Report -Spring 2012: Ages 18-22 Version Page 28 <strong>of</strong> 30
Q: Do you currently have a relationship that is trusting, supportive, and unconditional withat least one adult who will always be there for you?AGE 18 19 20 21 22 TotalYes 373 332 320 217 150 1,392No 65 61 63 68 37 294Declined 16 17 12 9 7 61Do not know 28 15 15 11 5 74Total 482 425 410 305 199 1,821Percentage Yes 85% 84% 84% 76% 80% 83%►Percentage Yes: [Does not include: Declined /I do not know]If YES to the question: Do you currently have a relationship that is trusting, supportive,and unconditional with at least one adult who will always be there for you?PermanentRelationships &ConnectionsQ: Did you know this person before you entered foster care?AGE 18 19 20 21 22 TotalYes 200 176 160 99 68 703No 166 152 157 118 77 670Declined 5 3 1 0 4 13Do not know 2 1 2 0 1 6Total 373 332 320 217 150 1,392Percentage Yes 55% 54% 50% 46% 47% 51%►Percentage Yes: [Does not include: Declined /I do not know]FINAL <strong>Florida</strong> <strong>NYTD</strong> <strong>Survey</strong> Report -Spring 2012: Ages 18-22 Version Page 29 <strong>of</strong> 30
Transition fromFoster CareQ: How would you describe the role that you have played in the development <strong>of</strong> yourindependent living plan?AGE 18 19 20 21 22 Total %I led the development <strong>of</strong> my independent living plan. 206 202 194 156 85 84349%I was involved in the development <strong>of</strong> my independentliving plan but did NOT lead it 134 127 118 72 64 51530%I was NOT involved in the development <strong>of</strong> myindependent living plan 18 7 12 5 5 47 3%I am not aware <strong>of</strong> my independent living plan 14 9 20 12 7 62 4%Do not know 80 56 51 40 25 252Declined 30 24 15 20 13 10215%**Total►Percentage Yes: [Does not include: Decline]4824254103051991,821**FINAL <strong>Florida</strong> <strong>NYTD</strong> <strong>Survey</strong> Report -Spring 2012: Ages 18-22 Version Page 30 <strong>of</strong> 30
<strong>Survey</strong> Questions & Comments:Please contact :Cby25 Initiative, Inc.Email: ILchecklist@Cby25i.orgTelephone: 813-222-0099Mail: 1228 E. 7 th AveTampa, <strong>Florida</strong> 33605www.Cby25i.org