The Pilgrim Tides
The Pilgrim Tides
The Pilgrim Tides

You also want an ePaper? Increase the reach of your titles
YUMPU automatically turns print PDFs into web optimized ePapers that Google loves.
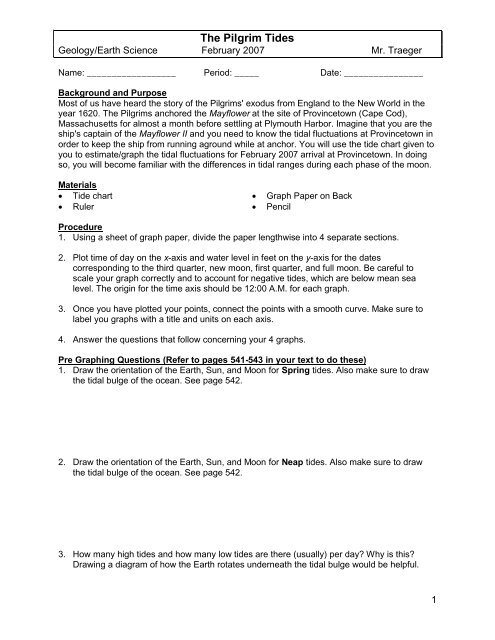
<strong>The</strong> <strong>Pilgrim</strong> <strong>Tides</strong>Geology/Earth Science February 2007 Mr. TraegerName: __________________ Period: _____ Date: ________________Background and PurposeMost of us have heard the story of the <strong>Pilgrim</strong>s' exodus from England to the New World in theyear 1620. <strong>The</strong> <strong>Pilgrim</strong>s anchored the Mayflower at the site of Provincetown (Cape Cod),Massachusetts for almost a month before settling at Plymouth Harbor. Imagine that you are theship's captain of the Mayflower II and you need to know the tidal fluctuations at Provincetown inorder to keep the ship from running aground while at anchor. You will use the tide chart given toyou to estimate/graph the tidal fluctuations for February 2007 arrival at Provincetown. In doingso, you will become familiar with the differences in tidal ranges during each phase of the moon.Materials· Tide chart · Graph Paper on Back· Ruler · PencilProcedure1. Using a sheet of graph paper, divide the paper lengthwise into 4 separate sections.2. Plot time of day on the x-axis and water level in feet on the y-axis for the datescorresponding to the third quarter, new moon, first quarter, and full moon. Be careful toscale your graph correctly and to account for negative tides, which are below mean sealevel. <strong>The</strong> origin for the time axis should be 12:00 A.M. for each graph.3. Once you have plotted your points, connect the points with a smooth curve. Make sure tolabel you graphs with a title and units on each axis.4. Answer the questions that follow concerning your 4 graphs.Pre Graphing Questions (Refer to pages 541-543 in your text to do these)1. Draw the orientation of the Earth, Sun, and Moon for Spring tides. Also make sure to drawthe tidal bulge of the ocean. See page 542.2. Draw the orientation of the Earth, Sun, and Moon for Neap tides. Also make sure to drawthe tidal bulge of the ocean. See page 542.3. How many high tides and how many low tides are there (usually) per day? Why is this?Drawing a diagram of how the Earth rotates underneath the tidal bulge would be helpful.1
<strong>The</strong> <strong>Pilgrim</strong> <strong>Tides</strong>Geology/Earth Science February 2007 Mr. TraegerMaking Tide GraphsUse the following graph sheet to plot your tides. Make sure to make 4 separate graphs, one foreach phase of the moon. Plot time of day (hours) on x axis and height variation (feet) on y axis.Full Moon (Thursday, February 1, 2007)Third Quarter (Saturday, February 10, 2007)New Moon (Monday, February 19, 2007)First Quarter (Monday, February 26, 2007)3