Education - PPAI
Education - PPAI
Education - PPAI

Create successful ePaper yourself
Turn your PDF publications into a flip-book with our unique Google optimized e-Paper software.
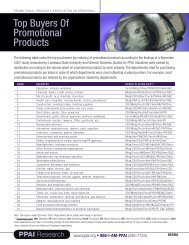
<strong>Education</strong>a profile of the No. 1 buyer of promotional products<strong>PPAI</strong> is committed to providingpromotional products professionalswith access to the most robust researchstatistics available, including studiesfrom other industries and organizations.This document is a compilation of thelatest research on education—the No. 1buyer of promotional products.*Provided by <strong>PPAI</strong>.
<strong>Education</strong>—a profile of the No. 1 buyer of promotional productsTable 4. Actual and projected numbers for total enrollment in K-12 by region: 2009-2011(In Thousands) 2009 2010 2011United States 49,312.21 49,386.40 49,553.85Northeast 7,899.85 7,817.48 7,750.15Midwest 10,593.54 10,524.88 10,475.81South 18,711.36 18,869.73 19,064.03West 12,107.46 12,174.31 12,263.86Table 5. Enrollment in educational institutions, by level and control of institution: Selected years,2008-2009(In Thousands) Fall 2008 Projected ProjectedFall 2009 Fall 20101. All Levels 74,338 75,710 75,900Public 63,238 64,123 64,281Private 11,100 11,587 11,6192. Elementary and Secondary 55,235 55,282 55,350Public 49,266 49,312 49,386Private 5,969 5,970 5,9643. Pre-K to Grade 8 38,860 39,086 39,312Public 34,286 34,505 34,730Private 4,574 4,580 4,5824. Grade 9 to 12 16,375 16,196 16,038Public 14,980 14,807 14,657Private 1,395 1,389 1,3825. Postsecondary 19,103 20,428 20,550Public 13,972 14,811 14,895a) Undergraduate 12,591 13,387 13,428b) 1st-Professional 1,381 1,424 1,467Private 5,131 5,617 5,655a) Undergraduate 3,775 4,179 4,116b) 1st-Professional 1,356 1,438 1,5395
<strong>Education</strong>—a profile of the No. 1 buyer of promotional productsTable 6. Actual and projected numbers for total enrollment in all degree-granting institutionsgender, age group, and attendance status: 2009-2011(In Thousands) 2009 2010 2011United States 19,524.14 19,641.14 19,712.69RaceWhite 12,337.85 12,353.60 12,292.03Black 2,644.86 2,666.03 2,708.59Hispanic 2,317.38 2,352.45 2,411.12Asian/Pacific Islander 1,331.73 1,354.68 1,375.50American Indian/ 197.36 197.85 196.28Alaska NativeNonresident Alien 695.57 716.55 729.17GenderMen 8,451.30 8,510.74 8,512.76Women 11,073.46 11,073.46 11,199.93Age Group14 to 17 years old 200.92 198.58 196.2018 and 19 years old 4,205.39 4,181.03 4,134.4020 and 21 years old 4,015.39 4,125.34 4,183.8322 to 24 years old 3,525.12 3,563.17 3,613.9225 to 29 years old 2,787.51 2,792.44 2,790.9330 to 34 years old 1,493.75 1,526.57 1,565.3335 years old and over 3,296.59 3,254.00 3,228.086
<strong>Education</strong>—a profile of the No. 1 buyer of promotional products<strong>Education</strong>al AttainmentPost Secondary Degrees Trends–Numbers:• During the 2010–11 academic year, postsecondary degrees are projected to number818,000 associate’s degrees; 1,696,000 bachelor’s degrees; 687,000 master’s degrees;100,700 first-professional degrees; 71,700 doctoral degrees.• The number of associate’s degrees was 41 percent higher in 2008–09 than in 1998–99,the number of bachelor’s degrees was 33 percent higher, the number of master’s degreeswas 49 percent higher, the number of first-professional degrees was 17 percent higherand the number of doctoral degrees was 54 percent higher.Demographic Trends:• Between 1998–99 and 2008–09, the number of bachelor’s degrees awarded to malesincreased 32 percent, while the number awarded to females increased 34 percent.Females earned 57 percent of all bachelor’s degrees in 2008–09, similar to thepercentage for 1998–99.• Between 1998–99 and 2008–09, the number of Caucasian students earning bachelor’sdegrees increased 26 percent, compared with the larger increases of 53 percent forAfrican-American students, 85 percent for Hispanic students, 52 percent for Asian/Pacific Islander students, and 45 percent for American Indian/Alaska Native students.• In 2008–09, Caucasian students earned 71 percent of all bachelor’s degrees awarded (vs.76 percent in 1998–99), African-American students earned 10 percent (vs. 9 percent in1998–99), Hispanic students earned 8 percent (vs. 6 percent in 1998–99), and Asian/Pacific Islander students earned 7 percent (vs. 6 percent in 1998–99). American Indian/Alaska Native students earned about 1 percent of the degrees in both years.• The U.S. Census Bureau collects annual statistics on the educational attainment of thepopulation. Between 2000 and 2010, the percentage of the adult population 25 yearsof age and over who had completed high school rose from 84 percent to 87 percent,and the percentage of adults with a bachelor’s degree increased from 26 percent to 30percent.• High school completers include those people who graduated from high school with adiploma, as well as those who completed high school through equivalency programs.The percentage of young adults (25- to 29-year-olds) who had completed high schoolin 2010 was about the same as it was in 2000 (89 and 88 percent, respectively).8
<strong>Education</strong>—a profile of the No. 1 buyer of promotional products• The percentage of young adults who had completed a bachelor’s degree increased from29 percent in 2000 to 32 percent in 2010.Table 8. Workplace Trends: This section presents data on the number of establishments ineducational services.(In Thousands) 4th Quarter 1st Quarter 2nd Quarter 3rd Quarter2009 2010 2010 2010Private Industry 91,987 (P) 92,043 (P) 93,188 (P) 94,176Local Government 61,056 (P) 62,851 (P) 62,784 (P) 62,865State Government 7,462 (P) 7,503 (P) 7,564 (P) 7,590Federal Government 99 (P) 112 (P) 113 (P) 114Resources:• National Center for <strong>Education</strong> Statistics: www.nces.ed.gov• United States Department of Labor, Bureau of Labor Statistics: www.bls.govDownload:Digest of <strong>Education</strong> Statistics 2010 by US Department of <strong>Education</strong>:http://nces.ed.gov/pubs2011/2011015.pdf9