3458N.K. Sahoo et al. / Applied Surface Science 253 (2007) 3455–34635. Refractive index modelingIt has already been discussed earlier that the macroscopicparameters <strong>and</strong> microstructures have a strong interdependence.Results <strong>of</strong> refractive index dispersion below the interb<strong>and</strong>absorption edge correspond to the fundamental electronicexcitation spectrum may assist very important discussion on thedielectric constant <strong>of</strong> the material. Wemple <strong>and</strong> Di Domenicohave analyzed more than 100 widely different solids <strong>and</strong> liquidsusing a single-effective oscillator model [34]. Based upon thevalidity <strong>of</strong> Kramers–Kronig relationship, equations fordielectric constants e r <strong>and</strong> e i were given by them. Equationfor the real part takes the form:e 2 rFðEÞ ¼1 þE0 2 E 2 (5)where the two parameters E 0 <strong>and</strong> F have straightforwardrelations to the electric dipole strength <strong>and</strong> the correspondingtransition frequencies <strong>of</strong> all oscillators. The parameters usedin this expression have fundamental as well as physicalsignificances. By a special combination <strong>of</strong> parameters, Wemple<strong>and</strong> Di Domenico defined a <strong>microstructural</strong> variable E d as[34]:E d ¼ F E 0(6)Combination <strong>of</strong> the above equations <strong>and</strong> neglecting values <strong>of</strong> kin the transparent region gives:e r ðEÞ ¼n 2 ðEÞ ¼1 þ E dE 0E 2 0E 2 (7)Values <strong>of</strong> the parameters E 0 <strong>and</strong> E d were estimated by plotting(n 2 1) 1 versus E 2 <strong>and</strong> fitting the relation to a straight line.These two parameters <strong>of</strong> the model play significant role inexplaining the experimental observations. For example, thedispersion energy E d that measures the average strength <strong>of</strong>interb<strong>and</strong> <strong>optical</strong> transitions is associated with the changes inthe structural order <strong>of</strong> the material. Similarly, the effectiveoscillation energy E 0 can be directly correlated with the <strong>optical</strong>b<strong>and</strong> gap by an empirical formula. The increase <strong>of</strong> the dispersionenergy value (E d ) is usually associated with evolution <strong>of</strong>the thin film microstructure to a more ordered phase [39]. Theoscillator energy E 0 is independent <strong>of</strong> the scale <strong>of</strong> e 2 <strong>and</strong> issubsequently an ‘‘average’’ energy gap, where as E d depends onthe scale <strong>of</strong> e 2 , <strong>and</strong> thus serves as an interb<strong>and</strong> strengthparameter.6. Experimental detailsUnder the present investigation, we have carried out somesystematic experiments <strong>and</strong> analysis <strong>of</strong> co-deposited thin films<strong>of</strong> Gd 2 O 3 /SiO 2 system using phase modulated ellipsometry,spectrophotometry <strong>and</strong> multimode scanning probe microscope(SPM) techniques. The samples were deposited in afully automatic thin film vacuum system ‘‘VERA-902’’ byadopting the reactive electron beam deposition technique. Thedepositions <strong>of</strong> the films were carried out using two 8 kW VTDelectron beam guns with sweep <strong>and</strong> automatic emissioncontrols. The film materials for SiO 2 <strong>and</strong> Gd 2 O 3 were chosenfrom Cerac’s batch number ‘‘S-1060’’ (purity 99.99%) <strong>and</strong>‘‘G-1076’’ (purity 99.9%), respectively. The substratetemperature was maintained at 70 8C for the deposited films.The total pressure inside the chamber during the depositionprocess was maintained at 1 10 4 mbar through MKS massflow controllers. The constituents <strong>of</strong> the gases present duringthe deposition were analyzed by a residual gas analyzer(RGA) model; Pffeier’s Prisma-200. The film thicknesseswere monitored both using the Leybold’s OMS-2000 <strong>optical</strong>thickness monitor (OTM) as well as Inficon’s XTC/2 QCM(quartz crystal monitors). The individual rates <strong>of</strong> depositionswere very accurately monitored as well as controlled inautomatic mode as per the requirements <strong>of</strong> the co-depositionprocess. The proportional, integration <strong>and</strong> differential (PID)parameters <strong>of</strong> the thickness as process control system werejudiciously optimized in order to avoid unwanted ratefluctuations during co-deposition processes. By such appropriate<strong>and</strong> accurate rate controls, it was possible to obtainGd 2 O 3 /SiO 2 co-deposited composite films with the desiredcompositions in the ranges <strong>of</strong> 10–90%. The entire depositionprocess parameters such as substrate temperature, <strong>optical</strong>thicknesses, rates <strong>of</strong> deposition, total reacting gas pressurewere monitored <strong>and</strong> controlled by a Siemen’s industrialprogrammable logic controller (PLC) with appropriate GUIbased front-end s<strong>of</strong>tware. The co-deposited film <strong>optical</strong>thicknesses were decided to remain 6–8 quarter-wave (l/4) ata wavelength (l) <strong>of</strong> 600 nm, in order to obtain appropriatenumbers <strong>of</strong> interference fringes for spectrophotometric as wellas ellipsometric analysis techniques.For ellipsometric studies, Jobin Yvon’s phase modulatedspectroscopic ellipsometer model UVISEL has been employedto analyze the growth dependent spectral <strong>optical</strong> <strong>properties</strong>. Asdescribed above Tauc–Lorentz formulation <strong>and</strong> effectivesingle oscillator models have been adopted to probe the codepositedfilms for their refractive index pr<strong>of</strong>iles using adiscrete multilayer approach. For AFM characterization, NT–MDT’s solver P-47H multimode ambient-based scanningprobe system has been utilized. The cantilever used was aSi 3 N 4 with typical spring constant <strong>of</strong> 0.6 N/m <strong>and</strong> resonantfrequency <strong>of</strong> 75 kHz. We have adopted the contact modeoperation without any image filtering technique for thetopographic measurements. For Fourier analysis, the built-inFFT module <strong>of</strong> the control s<strong>of</strong>tware ‘‘NOVA-SPM’’ wasemployed to generate the mappings. Similarly, for autocorrelationfunction analysis the built in features are employed tocompute both the 2-D <strong>and</strong> 3-D ACF parameters. In order tohave the consistency in the experimental results, the samecantilever was used for all the topographic measurements. Allthe co-deposited films were spectrally measured for theirreflectance as well as transmittance characteristics usingShimadzu UV3101PC spectrophotometer system equippedwith an integrating sphere accessory. The results <strong>of</strong> variouscharacterization techniques have been presented in thesubsequent section.
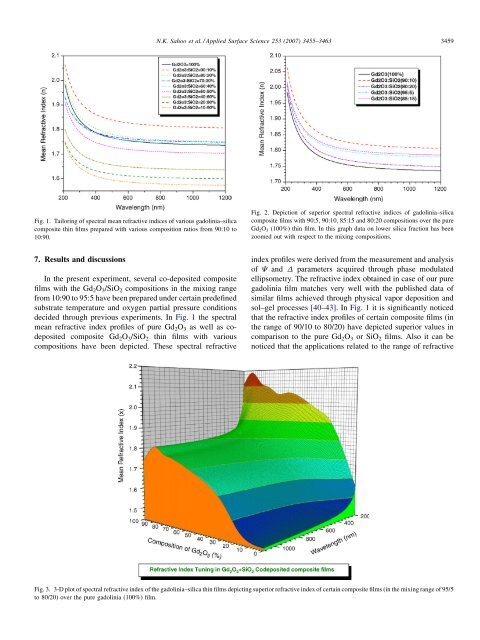
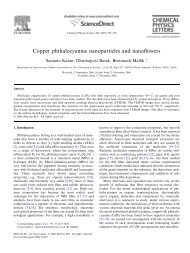
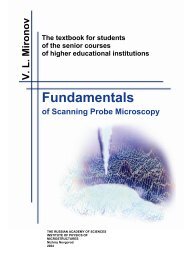
N.K. Sahoo et al. / Applied Surface Science 253 (2007) 3455–3463 3459Fig. 1. Tailoring <strong>of</strong> spectral mean refractive indices <strong>of</strong> various gadolinia–silicacomposite thin films prepared with various composition ratios from 90:10 to10:90.Fig. 2. Depiction <strong>of</strong> superior spectral refractive indices <strong>of</strong> gadolinia–silicacomposite films with 90:5, 90:10, 85:15 <strong>and</strong> 80:20 compositions over the pureGd 2 O 3 (100%) thin film. In this graph data on lower silica fraction has beenzoomed out with respect to the mixing compositions.7. Results <strong>and</strong> discussionsIn the present experiment, several co-deposited compositefilms with the Gd 2 O 3 /SiO 2 compositions in the mixing rangefrom 10:90 to 95:5 have been prepared under certain predefinedsubstrate temperature <strong>and</strong> oxygen partial pressure conditionsdecided through previous experiments. In Fig. 1 the spectralmean refractive index pr<strong>of</strong>iles <strong>of</strong> pure Gd 2 O 3 as well as codepositedcomposite Gd 2 O 3 /SiO 2 thin films with variouscompositions have been depicted. These spectral refractiveindex pr<strong>of</strong>iles were derived from the measurement <strong>and</strong> analysis<strong>of</strong> C <strong>and</strong> D parameters acquired through phase modulatedellipsometry. The refractive index obtained in case <strong>of</strong> our puregadolinia film matches very well with the published data <strong>of</strong>similar films achieved through physical vapor deposition <strong>and</strong>sol–gel processes [40–43]. InFig. 1 it is significantly noticedthat the refractive index pr<strong>of</strong>iles <strong>of</strong> certain composite films (inthe range <strong>of</strong> 90/10 to 80/20) have depicted superior values incomparison to the pure Gd 2 O 3 or SiO 2 films. Also it can benoticed that the applications related to the range <strong>of</strong> refractiveFig. 3. 3-D plot <strong>of</strong> spectral refractive index <strong>of</strong> the gadolinia–silica thin films depicting superior refractive index <strong>of</strong> certain composite films (in the mixing range <strong>of</strong> 95/5to 80/20) over the pure gadolinia (100%) film.