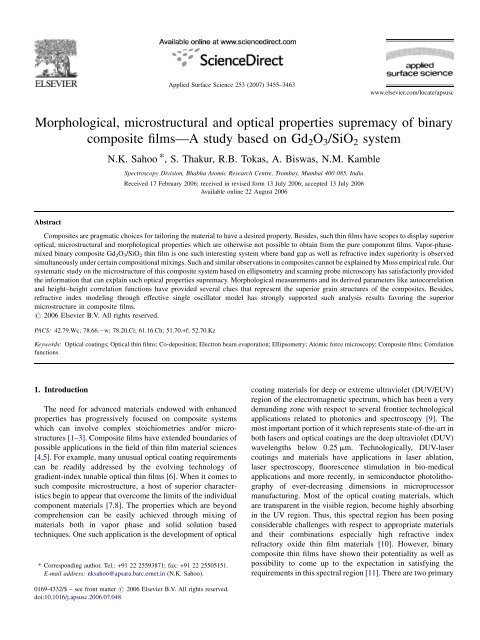
Morphological, microstructural and optical properties supremacy of ...
Morphological, microstructural and optical properties supremacy of ...
Morphological, microstructural and optical properties supremacy of ...

You also want an ePaper? Increase the reach of your titles
YUMPU automatically turns print PDFs into web optimized ePapers that Google loves.
N.K. Sahoo et al. / Applied Surface Science 253 (2007) 3455–3463 3457macroscopic dielectric response will also depend on theseparameters. The definition <strong>of</strong> the dielectric function as thedipole moment per unit volume suggests that the magnitude <strong>of</strong>the dielectric response <strong>of</strong> a polycrystalline or amorphous filmwith respect to a st<strong>and</strong>ard spectrum can provide a simple,convenient <strong>and</strong> contactless means <strong>of</strong> measuring the density <strong>of</strong>the film. The macroscopic dielectric response <strong>of</strong> a thin film istherefore connected in an intimate way with the, grainstructures, compositional <strong>and</strong> <strong>microstructural</strong> parameters thatdetermine its other physical <strong>properties</strong>. It is probably for thesereasons earlier researchers have predicted the <strong>microstructural</strong>densifications in the composite film through refractive indexanalyses [24–26]. There are also several other model basedtechniques such as Tauc–Lorentz (TL) parametric <strong>and</strong> Wemple<strong>and</strong> Di Domenico’s single-effective oscillator models that canbe used to probe the <strong>microstructural</strong> interaction process deeper[32–34].With the advent <strong>of</strong> atomic force microscopy the visualization<strong>of</strong> microstructure <strong>and</strong> its derived functional correlationparameters in thin films have added better underst<strong>and</strong>ing aswell as interpreting physical <strong>properties</strong> <strong>and</strong> phenomena.<strong>Morphological</strong> measurements <strong>and</strong> other derived factors likeautocorrelation <strong>and</strong> height–height correlation functions havecontributed substantially to this underst<strong>and</strong>ing. In the presentwork we have made use <strong>of</strong> these parametric analyses to explainthe superior <strong>properties</strong> <strong>of</strong> the certain composite films.4. Analyses with autocorrelation <strong>and</strong> height–heightcorrelation functionsAlthough, at the first sight, thin film morphology appears tobe r<strong>and</strong>om, a close analysis reveals volumes <strong>of</strong> correlated<strong>properties</strong>. The best way the thin film morphology can beprobed is by analyzing its autocorrelation function (ACF) aswell as height–height correlation function (HHCF) [35]. Spatialautocorrelation is, conceptually as well as empirically, the twodimensionalequivalent <strong>of</strong> redundancy. It measures the extent,to which the occurrence <strong>of</strong> an event in a designated unitconstrains, or makes more probable, the occurrence <strong>of</strong> an eventin its neighboring unit. In other words, the autocorrelationfunction can be used to detect non-r<strong>and</strong>omness in surface dataas well as to identify an appropriate space or time series modelif the data are not r<strong>and</strong>om. Within the AFM measurements weusually evaluate the one-dimensional autocorrelation function(A x ) determined only from the height pr<strong>of</strong>iles (z n + m,l <strong>and</strong> z n,l )in the fast scanning axis which can be evaluated from thediscrete (N M) AFM data values as [36],A x ðt x Þ¼1NðMmÞX NXMml¼1 n¼1z nþm;l z n;l (2)Here t x is the distance between the two points in the x-direction(fast scanning axis) in pixel units <strong>and</strong> m refers to the currentdata point. In the present studies several co-deposited thin films<strong>of</strong> gadolinia–silica systems have been analyzed for theirmorphologies as well as autocorrelation functions using thedata <strong>and</strong> information acquired through the Solver P47H atomicforce microscope (AFM) measurements. The autocorrelationfunctions <strong>of</strong> pure film <strong>and</strong> the composites have shown verydifferent trends in their evolution. However, in most <strong>of</strong> the codepositedfilms, such functions can be fitted well with theappropriate realistic Gaussian models. Height–height correlationfunction is also very intimately associated with the autocorrelation<strong>and</strong> very prominently represents the grain structuresin thin film morphology. Mathematically, it is given by [37],H x ðr x Þ¼1NðMmÞX NXMml¼1 n¼1ðz nþm;l z n;l Þ 2 (3)Here H x is the one-dimensional function <strong>and</strong> r x is the distancebetween the two points in the x-direction (fast scanning axis) inpixel units. In order to get insight into the dynamic behavior <strong>and</strong>the growth processes related evolution <strong>of</strong> morphology in thepure <strong>and</strong> composite films, we calculated the height–heightcorrelation function H(r) based on the AFM data. Like mostthin film experiments, here also it is expected that for each film,log H(r) should increase linearly with log r for small distance r,depicting a power-law behavior represented by, H(r) / r 2a , <strong>and</strong>then leading to saturation for large r. At the initial regime <strong>of</strong> thecorrelation function there exist variant slopes representingdifferent <strong>microstructural</strong> evolutions in composite <strong>and</strong> purefilms. With this concept, we have tried to fit the height–heightcorrelation function with the self-affine <strong>properties</strong> using therelationship [38], 2a rHðrÞ ¼2w1 2 exp(4)jwhere r is the relative distance between a pair <strong>of</strong> points on thesurface, w the interface width, a the roughness exponent <strong>and</strong> j isthe lateral correlation length. All these parameters have veryspecial significances with the respect to the qualitative as wellas quantitative behavior <strong>of</strong> the surface morphology. Forinstance, a, the roughness exponent, signifies the how ‘‘wiggly’’the local slope is. It is also an indicative <strong>of</strong> the ‘‘jaggedness’’<strong>of</strong> the topography as well as signifies the relativecontribution <strong>of</strong> high frequency fluctuations to the roughness.Its value is directly correlated with ‘‘Herst’’ exponent thatdefine the fractal dimension <strong>of</strong> the surfaces. On the very shortlength scale, this parameter a is connected with the fractaldimension as ‘‘D =3 a’’. It is worth mentioning that thefractal dimension is the measure <strong>of</strong> contribution <strong>of</strong> two- <strong>and</strong>three-dimensional mechanism during the film growth. Twodimensionalmechanism <strong>of</strong> growth gives the value <strong>of</strong> fractaldimension close to two- <strong>and</strong> three-dimensional close to 3. Weconsider that fractal dimension is one <strong>of</strong> the most informativeparameter <strong>of</strong> surface geometry. Moreover, most experimentalstudies have indicated that fractal dimension <strong>and</strong> thermodynamicgrowth condition <strong>of</strong> film are very much interconnected.The lateral correlation length, j, describes the largest distancein which the height is still correlated. It is to be further notedthat, j provides a length scale which distinguishes the shortrange<strong>and</strong> long-range behaviors <strong>of</strong> the rough surface. Theinterface width, w, is a measure <strong>of</strong> the surface height fluctuation,i.e., it signifies the RMS fluctuation about the mean height.
3458N.K. Sahoo et al. / Applied Surface Science 253 (2007) 3455–34635. Refractive index modelingIt has already been discussed earlier that the macroscopicparameters <strong>and</strong> microstructures have a strong interdependence.Results <strong>of</strong> refractive index dispersion below the interb<strong>and</strong>absorption edge correspond to the fundamental electronicexcitation spectrum may assist very important discussion on thedielectric constant <strong>of</strong> the material. Wemple <strong>and</strong> Di Domenicohave analyzed more than 100 widely different solids <strong>and</strong> liquidsusing a single-effective oscillator model [34]. Based upon thevalidity <strong>of</strong> Kramers–Kronig relationship, equations fordielectric constants e r <strong>and</strong> e i were given by them. Equationfor the real part takes the form:e 2 rFðEÞ ¼1 þE0 2 E 2 (5)where the two parameters E 0 <strong>and</strong> F have straightforwardrelations to the electric dipole strength <strong>and</strong> the correspondingtransition frequencies <strong>of</strong> all oscillators. The parameters usedin this expression have fundamental as well as physicalsignificances. By a special combination <strong>of</strong> parameters, Wemple<strong>and</strong> Di Domenico defined a <strong>microstructural</strong> variable E d as[34]:E d ¼ F E 0(6)Combination <strong>of</strong> the above equations <strong>and</strong> neglecting values <strong>of</strong> kin the transparent region gives:e r ðEÞ ¼n 2 ðEÞ ¼1 þ E dE 0E 2 0E 2 (7)Values <strong>of</strong> the parameters E 0 <strong>and</strong> E d were estimated by plotting(n 2 1) 1 versus E 2 <strong>and</strong> fitting the relation to a straight line.These two parameters <strong>of</strong> the model play significant role inexplaining the experimental observations. For example, thedispersion energy E d that measures the average strength <strong>of</strong>interb<strong>and</strong> <strong>optical</strong> transitions is associated with the changes inthe structural order <strong>of</strong> the material. Similarly, the effectiveoscillation energy E 0 can be directly correlated with the <strong>optical</strong>b<strong>and</strong> gap by an empirical formula. The increase <strong>of</strong> the dispersionenergy value (E d ) is usually associated with evolution <strong>of</strong>the thin film microstructure to a more ordered phase [39]. Theoscillator energy E 0 is independent <strong>of</strong> the scale <strong>of</strong> e 2 <strong>and</strong> issubsequently an ‘‘average’’ energy gap, where as E d depends onthe scale <strong>of</strong> e 2 , <strong>and</strong> thus serves as an interb<strong>and</strong> strengthparameter.6. Experimental detailsUnder the present investigation, we have carried out somesystematic experiments <strong>and</strong> analysis <strong>of</strong> co-deposited thin films<strong>of</strong> Gd 2 O 3 /SiO 2 system using phase modulated ellipsometry,spectrophotometry <strong>and</strong> multimode scanning probe microscope(SPM) techniques. The samples were deposited in afully automatic thin film vacuum system ‘‘VERA-902’’ byadopting the reactive electron beam deposition technique. Thedepositions <strong>of</strong> the films were carried out using two 8 kW VTDelectron beam guns with sweep <strong>and</strong> automatic emissioncontrols. The film materials for SiO 2 <strong>and</strong> Gd 2 O 3 were chosenfrom Cerac’s batch number ‘‘S-1060’’ (purity 99.99%) <strong>and</strong>‘‘G-1076’’ (purity 99.9%), respectively. The substratetemperature was maintained at 70 8C for the deposited films.The total pressure inside the chamber during the depositionprocess was maintained at 1 10 4 mbar through MKS massflow controllers. The constituents <strong>of</strong> the gases present duringthe deposition were analyzed by a residual gas analyzer(RGA) model; Pffeier’s Prisma-200. The film thicknesseswere monitored both using the Leybold’s OMS-2000 <strong>optical</strong>thickness monitor (OTM) as well as Inficon’s XTC/2 QCM(quartz crystal monitors). The individual rates <strong>of</strong> depositionswere very accurately monitored as well as controlled inautomatic mode as per the requirements <strong>of</strong> the co-depositionprocess. The proportional, integration <strong>and</strong> differential (PID)parameters <strong>of</strong> the thickness as process control system werejudiciously optimized in order to avoid unwanted ratefluctuations during co-deposition processes. By such appropriate<strong>and</strong> accurate rate controls, it was possible to obtainGd 2 O 3 /SiO 2 co-deposited composite films with the desiredcompositions in the ranges <strong>of</strong> 10–90%. The entire depositionprocess parameters such as substrate temperature, <strong>optical</strong>thicknesses, rates <strong>of</strong> deposition, total reacting gas pressurewere monitored <strong>and</strong> controlled by a Siemen’s industrialprogrammable logic controller (PLC) with appropriate GUIbased front-end s<strong>of</strong>tware. The co-deposited film <strong>optical</strong>thicknesses were decided to remain 6–8 quarter-wave (l/4) ata wavelength (l) <strong>of</strong> 600 nm, in order to obtain appropriatenumbers <strong>of</strong> interference fringes for spectrophotometric as wellas ellipsometric analysis techniques.For ellipsometric studies, Jobin Yvon’s phase modulatedspectroscopic ellipsometer model UVISEL has been employedto analyze the growth dependent spectral <strong>optical</strong> <strong>properties</strong>. Asdescribed above Tauc–Lorentz formulation <strong>and</strong> effectivesingle oscillator models have been adopted to probe the codepositedfilms for their refractive index pr<strong>of</strong>iles using adiscrete multilayer approach. For AFM characterization, NT–MDT’s solver P-47H multimode ambient-based scanningprobe system has been utilized. The cantilever used was aSi 3 N 4 with typical spring constant <strong>of</strong> 0.6 N/m <strong>and</strong> resonantfrequency <strong>of</strong> 75 kHz. We have adopted the contact modeoperation without any image filtering technique for thetopographic measurements. For Fourier analysis, the built-inFFT module <strong>of</strong> the control s<strong>of</strong>tware ‘‘NOVA-SPM’’ wasemployed to generate the mappings. Similarly, for autocorrelationfunction analysis the built in features are employed tocompute both the 2-D <strong>and</strong> 3-D ACF parameters. In order tohave the consistency in the experimental results, the samecantilever was used for all the topographic measurements. Allthe co-deposited films were spectrally measured for theirreflectance as well as transmittance characteristics usingShimadzu UV3101PC spectrophotometer system equippedwith an integrating sphere accessory. The results <strong>of</strong> variouscharacterization techniques have been presented in thesubsequent section.
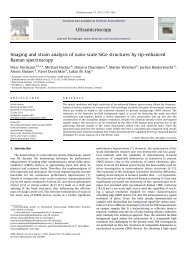
N.K. Sahoo et al. / Applied Surface Science 253 (2007) 3455–3463 3459Fig. 1. Tailoring <strong>of</strong> spectral mean refractive indices <strong>of</strong> various gadolinia–silicacomposite thin films prepared with various composition ratios from 90:10 to10:90.Fig. 2. Depiction <strong>of</strong> superior spectral refractive indices <strong>of</strong> gadolinia–silicacomposite films with 90:5, 90:10, 85:15 <strong>and</strong> 80:20 compositions over the pureGd 2 O 3 (100%) thin film. In this graph data on lower silica fraction has beenzoomed out with respect to the mixing compositions.7. Results <strong>and</strong> discussionsIn the present experiment, several co-deposited compositefilms with the Gd 2 O 3 /SiO 2 compositions in the mixing rangefrom 10:90 to 95:5 have been prepared under certain predefinedsubstrate temperature <strong>and</strong> oxygen partial pressure conditionsdecided through previous experiments. In Fig. 1 the spectralmean refractive index pr<strong>of</strong>iles <strong>of</strong> pure Gd 2 O 3 as well as codepositedcomposite Gd 2 O 3 /SiO 2 thin films with variouscompositions have been depicted. These spectral refractiveindex pr<strong>of</strong>iles were derived from the measurement <strong>and</strong> analysis<strong>of</strong> C <strong>and</strong> D parameters acquired through phase modulatedellipsometry. The refractive index obtained in case <strong>of</strong> our puregadolinia film matches very well with the published data <strong>of</strong>similar films achieved through physical vapor deposition <strong>and</strong>sol–gel processes [40–43]. InFig. 1 it is significantly noticedthat the refractive index pr<strong>of</strong>iles <strong>of</strong> certain composite films (inthe range <strong>of</strong> 90/10 to 80/20) have depicted superior values incomparison to the pure Gd 2 O 3 or SiO 2 films. Also it can benoticed that the applications related to the range <strong>of</strong> refractiveFig. 3. 3-D plot <strong>of</strong> spectral refractive index <strong>of</strong> the gadolinia–silica thin films depicting superior refractive index <strong>of</strong> certain composite films (in the mixing range <strong>of</strong> 95/5to 80/20) over the pure gadolinia (100%) film.
3460N.K. Sahoo et al. / Applied Surface Science 253 (2007) 3455–3463Fig. 4. Plots <strong>of</strong> (n 2 1) 1 vs. E 2 <strong>of</strong> various composite films depicting straightline behavior. The results derived from this plot have been utilized to computetwo important parameters E d <strong>and</strong> E 0 which represent the dispersion energy <strong>and</strong>oscillator energy, respectively.Fig. 6. Plot <strong>of</strong> n 4 <strong>and</strong> 1/E g depicting non-linear characteristic <strong>and</strong> stronglysupporting the violation <strong>of</strong> Moss semi-empirical rule in composite gadolinia–silica films.index tunability can make use <strong>of</strong> this extended region veryconveniently. Fig. 2 has highlighted this fact where thecomparison is made amongst the pure gadolinia <strong>and</strong> thecomposite (Gd 2 O 3 :SiO 2 ) films with zooming out the experimentalco-deposition data under lower silica fractions. Fromthis figure the superior spectral refractive index <strong>of</strong> thecomposite film in the silica mixing range <strong>of</strong> 5–20% can bedistinctly noticed. For a more distinct representation we haveplotted the 3-D fit to our experimental observation in Fig. 3. Itcan be seen in this 3-D figure that there is a range <strong>of</strong>compositions over which the composite films depicted superiorspectral refractive index values. In order to analyze theFig. 5. Variation refractive index (at a wavelength <strong>of</strong> 600 nm) <strong>and</strong> b<strong>and</strong> gap ingadolinia–silica composite thin film system. As it can be seen the shaded areadepicted a continuous increase in the b<strong>and</strong> gap <strong>of</strong> the composite film. In this areathe numerical values <strong>of</strong> the refractive index parameter for the composite filmsare more than the pure gadolinia system.Fig. 7. (a) Morphology <strong>and</strong> (b) 3-D autocorrelation function <strong>of</strong> pure gadoliniafilm depicting the dominance <strong>of</strong> aggregates or mound structures.
N.K. Sahoo et al. / Applied Surface Science 253 (2007) 3455–3463 3461<strong>microstructural</strong> evolution through effective single oscillatormodel, we have plotted (n 2 1) versus E 2 in Fig. 4. It can benoticed that pure gadolinia film has demonstrated differentdispersion behavior in comparison to the most composite films.Also as an added advantage, the composite films are alsoassociated with better b<strong>and</strong> gap values. This result is distinctlydepicted in Fig. 5. The shaded region in the plot has highlightedthis fact that under these compositions both the refractive index<strong>and</strong> b<strong>and</strong> gap <strong>supremacy</strong> can be achieved which is quitedifferent from the monotonic tailoring <strong>of</strong> the <strong>optical</strong> <strong>properties</strong>in conventional composite films. This is a very definite situation<strong>of</strong> the violation <strong>of</strong> Moss rule. This violation is highlighted inFig. 6 where the plot between n 4 <strong>and</strong> 1/E g has demonstrated aninteresting non-linear characteristic. Such situations are highlyuseful for developing multilayer <strong>optical</strong> coatings for the deepultraviolet region utilizing the advantages <strong>of</strong> the b<strong>and</strong> gap <strong>and</strong>the refractive index parameters. Such improved <strong>optical</strong><strong>properties</strong> <strong>of</strong> composite films violating Moss rule have beenearlier observed in certain other co-deposited thin film systems[32–34]. Although earlier researchers have only predictedpossible <strong>microstructural</strong> superiority in composite films, wehave very authentically verified this observation throughatomic force microscopic measurements as well as refractiveindex modeling. In Fig. 7(a) the topography <strong>of</strong> the puregadolinia film has been presented. One can easily see a poorgrain structure distribution in the morphology. There are veryprominent localized aggregates or mound structures distributedin the morphology. The 3-D-autocorrelation function <strong>of</strong>this morphology is depicted in Fig. 7(b). The presence <strong>of</strong>dominating mound structures (grain clustering) is highlightedin this measurement result. Besides, the correlation length hasa higher numerical value that supports the presence <strong>of</strong> suchcorrelated superstructures or aggregates. As a contrast, thecomposite gadolinia–silica films have shown a denser,amorphous type <strong>of</strong> grain structures in the morphologypresented in Fig. 8(a). The dense morphology looks morelike the result that is very much similar to the outcome <strong>of</strong> ionassisteddeposition. The 3-D-autocorrelation function alsosupported this observation which can be seen from Fig. 8(b).The autocorrelation function has displayed a more self-affinequality in the analysis result. 2-D analysis depicted in Fig. 9(a<strong>and</strong> b) <strong>of</strong> such autocorrelation functions distinctly highlightedsuch transition <strong>of</strong> the grain structures from mound to selfaffine.Fig. 10 depicted the height–height correlation functionalanalysis to the morphologies. Such an analysis has alsoFig. 8. (a) Morphology <strong>and</strong> (b) 3-D autocorrelation function <strong>of</strong> compositegadolinia–silica film depicting a more smooth self-affine micro grain structures.Fig. 9. Two-dimensional autocorrelation function <strong>of</strong> (a) pure gadolinia (100%)film <strong>and</strong> (b) composite gadolinia–silica (90/10) film demonstrating moundstructure <strong>and</strong> self-affine nature <strong>of</strong> the morphology, respectively.
3462N.K. Sahoo et al. / Applied Surface Science 253 (2007) 3455–34638. ConclusionFig. 10. Two-dimensional height–height correlation <strong>of</strong> (a) pure gadolinia(100%) <strong>and</strong> (b) composite gadolinia–silica (90/10) film. The composite filmmicrostructure has a smaller correlation length which represents more like anamorphous <strong>and</strong> self-affine type <strong>of</strong> grain structure.very appropriately highlighted the self-affine nature <strong>of</strong> thecomposite film topography. The correlation length for such astructure has depicted a relatively lower value supportingdense <strong>and</strong> amorphous like quality. Microstructural ordering isalso an important parameter which is more or less reflected inthe refracting index modeling. Such a result is highlightedthrough Fig. 11. The structural order parameter E d <strong>of</strong> the singleoscillator model has shown a very close association withrefractive index. This analysis implies that local microstructureordering can predominantly influence the density <strong>and</strong> thegrainmorphologywhichinturncanleadtoabetterrefractiveindex value, as is the case with certain composite films withlower silica components.Fig. 11. Analysis <strong>of</strong> refractive index using the effective single oscillator model.The <strong>microstructural</strong> ordering parameter, ‘‘E d ’’ can be seen to follow therefractive index evolution. This distinctly points out the structural orderinghas a close association with the polarizability that ultimately decides therefractive index property.The refractive index tunability as well as <strong>optical</strong> <strong>and</strong><strong>microstructural</strong> superiority in gadolinia–silica composite filmsunder certain compositional ratios has been probed with phasemodulated ellipsometry <strong>and</strong> scanning probe microscopy.Spectral refractive index pr<strong>of</strong>iles were derived from theellipsometric parameters through Tauc–Lorentz parameterization.Composite films depicted an evolution in morphology aswell as grain structure ordering which are reflected inautocorrelation <strong>and</strong> height–height correlation functional analysis.The structural ordering parameter <strong>of</strong> effective singleoscillator model followed almost a similar trend as in theevolution <strong>of</strong> the refractive index. Besides the <strong>optical</strong> <strong>and</strong><strong>microstructural</strong> <strong>properties</strong> have shown to violate the mostpopular ‘‘Moss rule’’ that establishes a reciprocal relationbetween the refractive index <strong>and</strong> the energy gap. Althoughprime objective <strong>of</strong> such composite structure is to achieve thetunability in the refractive index, as an added advantage some<strong>of</strong> the composite films depicted superior <strong>optical</strong> <strong>and</strong> <strong>microstructural</strong><strong>properties</strong> simultaneously. Such <strong>properties</strong> can beutilized not only in extending the range <strong>of</strong> refractive indextunability but also in developing superior multilayer devices inthe deep ultraviolet spectral region.References[1] L. Armelao, C. Eisenmenger-Sittner, M. Groenewolt, S. Gross, C. Sada, U.Schubert, E. Tondello, A. Zattin, J. Mater. Chem. 15 (2005) 1838.[2] W.J. Gunning, R.L. Hall, F.J. Woodberry, W.H. Southwell, N.S. Gluck,Appl. Opt. 28 (1989) 2945.[3] M.F. Ouellette, R.V. Lang, K.L. Yan, R.W. Bertram, R.S. Owles, D.Vincent, J. Vac. Sci. Technol. A 9 (1991) 1188.[4] J. Chen, S. Chao, J. Kao, H. Niu, C. Chen, Appl. Opt. 35 (1996) 90.[5] M. Kobayashi, H. Terui, Appl. Opt. 22 (1983) 3121.[6] R. Jacobsson, Inhomogeneous <strong>and</strong> coevaporated homogeneous films for<strong>optical</strong> applications, in: G. Hass, M.H. Francombe, R.W. H<strong>of</strong>fman (Eds.),Physics <strong>of</strong> Thin Films, vol. 8, Academic, New York, 1975, pp. 51–98.[7] H.O. Sankur, J. DeNatale, W.J. Gunning, Appl. Opt. 30 (1991) 497.[8] H. Sankur, W. Gunning, J. Appl. Phys. 66 (1989) 807.[9] F. Cheliebou, A. Boyer, L. Martin, Thin Solid Films 249 (1994) 86.[10] F. Rainer, W.H. Lowdermilk, D. Milam, C.K. Carniglia, T.T. Hart, T.L.Lichtenstein, Appl. Opt. 24 (1985) 496.[11] N.K. Sahoo, A.P. Shapiro, Appl. Opt. 37 (1998) 698.[12] H. Demiryont, Appl. Opt. 24 (1985) 2647.[13] M. Gajdardziska-Josifovska, R.C. McPhedran, D.J.H. Cockayne, D.R.McKenzie, R.E. Collins, Appl. Opt. 28 (1989) 2736.[14] N.M. Ravindra, J. Narayan, J. Appl. Phys. 60 (1986) 1139.[15] T.S. Moss, Proc. Phys. Soc. Lond. Sect. B 63 (1950) 167.[16] J.S. Seeley, R. Hunneman, A. Whatley, Appl. Opt. 20 (1981) 31.[17] J.R. Dixon, H.R. Riedl, Phys. Rev. 140 (1965) A1283.[18] M. Bertolotti, V. Bogdanov, A. Ferrari, A. Jascow, N. Nazorova, A.Pikhtin, L. Schirone, J. Opt. Soc. Am. B 7 (1990) 918.[19] K.L. Vodopyanov, J. Opt. Soc. Am. B 16 (1999) 1579.[20] R.A. Soref, Appl. Opt. 31 (1992) 4627.[21] J. Fesquet, J. Opt. Soc. Am. A 3 (1986) 369.[22] M. Kano, K. Sugiyama, Electron. Lett. 16 (1980) 146.[23] J. Fesquet, J. Opt. Soc. Am. A 3 (1986) 369.[24] A. Feldman, X. Ying, E.N. Farabaugh, Appl. Opt. 28 (1989) 5229.[25] W.H. Koo, S.M. Jeoung, S.H. Choi, S.J. Jo, H.K. Baik, S.J. Lee, K.M.Song, Thin Solid Films 468 (2004) 28.[26] A. Feldman, E.N. Farabaugh, W.K. Haller, D.M. S<strong>and</strong>ers, R.M. Stempniak,J. Vac. Sci. Technol. A 4 (1986) 2969.
N.K. Sahoo et al. / Applied Surface Science 253 (2007) 3455–3463 3463[27] A. Iraji Zad, G. Kavei, M. Reza Rahimi Tabar, S.M. Vaez Allaei, J. Phys.Condens. Matter 15 (2003) 1889.[28] D.C. Law, L. Li, M.J. Begarney, R.F. Hicks, J. Appl. Phys. 88 (2000) 508.[29] E. Pelletier, F. Flory, Y. Hu, Appl. Opt. 28 (1989) 2918.[30] M. Cevro, Thin Solid Films 258 (1995) 91.[31] M. Jerman, Z. Qiao, D. Mergel, Appl. Opt. 44 (2005) 3006.[32] J. Price, P.Y. Hung, T. Rhoad, B. Foran, A.C. Diebold, Appl. Phys. Lett. 83(2004) 1701.[33] H. Lee, I.Y. Kim, S.S. Han, B.S. Bae, M.K. Choi, I.S. Yang, J. Appl. Phys.90 (2001) 813.[34] S.H. Wemple, M. DiDomenico Jr., Phys. Rev. B 3 (1971) 1338.[35] H.N. Yang, A. Chan, G.C. Wang, J. Appl. Phys. 74 (1993) 101.[36] Y. Chen, W. Huang, Meas. Sci. Technol. 15 (2004) 2005.[37] Z.J. Liu, N. Jiang, Y.G. Shen, Y.W. Mai, J. Appl. Phys. 92 (2002) 3559.[38] C.H. Zhang, Z.J. Liu, K.Y. Li, Y.G. Shen, J.B. Luo, J. Appl. Phys. 95(2004) 1460.[39] S.H. Wemple, Phys. Rev. B 7 (1973) 3767.[40] A.A. Dakhel, J. Opt. A Pure Appl. Opt. 3 (2001) 452.[41] A. García-Murillo, C. Le Luyer, C. Garapon, C. Dujardin, E. Bernstein, C.Pedrini, J. Mugnier, Opt. Mater. 19 (2002) 161–168.[42] H. Guo, X. Yang, T. Xiao, W. Zhanga, L. Lou, J. Mugnier, Appl. Surf. Sci.230 (2004) 215.[43] C. Le Luyer, A. García-Murillo, E. Bernstein, J. Mugnier, J. RamanSpectrosc. 34 (2003) 234.