- Page 1 and 2: GUIDELINES FOR THE IDENTIFICATION A
- Page 3 and 4: This document is dedicated to the m
- Page 5 and 6: XIV Template for Letter to Construc
- Page 8 and 9: EXECUTIVE SUMMARYDespite improvemen
- Page 10 and 11: pregnant women with BLL
- Page 12 and 13: MEMBERS OF THE WORK GROUP ON LEAD A
- Page 14 and 15: MEMBERS OF THE ADVISORY COMMITTEE O
- Page 16 and 17: Sally OdlePresident and Owner, Safe
- Page 18 and 19: GLOSSARYabatement: any set of measu
- Page 20 and 21: cumulative: increasing by successiv
- Page 22 and 23: lead-safe work practices: low-techn
- Page 24: enovation: construction and/or home
- Page 27 and 28: Finally, there is evidence that a s
- Page 30 and 31: CHAPTER 2.ADVERSE HEALTH EFFECTS OF
- Page 32 and 33: lead exposure (Tabacova et al. 1994
- Page 34 and 35: The strongest evidence to date is a
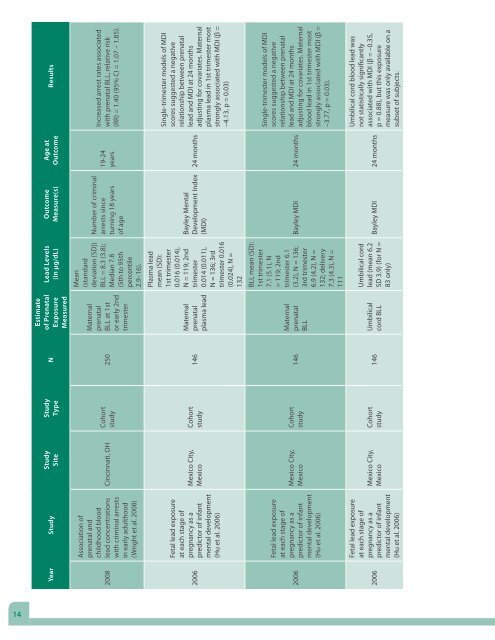
- Page 36 and 37: Epidemiologic Evidence for Neurodev
- Page 40 and 41: EstimateStudy Study of Prenatal Lea
- Page 44 and 45: EstimateStudy Study of Prenatal Lea
- Page 46 and 47: EstimateStudy Study of Prenatal Lea
- Page 48 and 49: EstimateStudy Study of Prenatal Lea
- Page 50 and 51: EstimateStudy Study of Prenatal Lea
- Page 52 and 53: CHAPTER 3.BIOKINETICS AND B
- Page 54 and 55: this biomarker may be a useful rese
- Page 56 and 57: Recent studies have documented that
- Page 58: Figure 3-1. Major Lead Exposure Pat
- Page 61 and 62: Additionally, recent evidence has s
- Page 63 and 64: in the study population was 12%
- Page 65 and 66: Mobilization of Endogenous Bone Lea
- Page 67 and 68: Most of the published literature re
- Page 69 and 70: On occasion, imported foods and foo
- Page 71 and 72: Case Study 4-3. A Case of Lead Pois
- Page 73 and 74: Table 4-1. Risk Factors for Lea
- Page 76 and 77: CHAPTER 5.BLOOD LEAD TESTING
- Page 78 and 79: Blood Lead Testing in the General P
- Page 80 and 81: absorption spectrophotometry (GFAAS
- Page 82 and 83: ally, the measured BLL of pregnant
- Page 84 and 85: Table 5-2. Schedule for Follow-up B
- Page 86 and 87: Figure 5-1. New York City Departmen
- Page 88 and 89:
CHAPTER 6.MANAGEMENT OF PRE
- Page 90 and 91:
y providing information to health d
- Page 92 and 93:
upon eliciting accurate information
- Page 94 and 95:
tivity that disturbs paint can incr
- Page 96 and 97:
Case management of pregnant women w
- Page 98 and 99:
Interpretation and follow-up of blo
- Page 100:
Table 6-2. Suggested Factors to Ass
- Page 103 and 104:
Decades of laboratory and clinical
- Page 105 and 106:
tion of skeletal mineral. Observati
- Page 107 and 108:
of follow up, suggesting decreased
- Page 109 and 110:
Supplemental Nutrition Program for
- Page 111 and 112:
Inadequate vitamin D status is comm
- Page 114 and 115:
CHAPTER 8.CHELATION OF PREGNANT
- Page 116 and 117:
CLINICAL EVIDENCE IN PREGNANCY AND
- Page 118 and 119:
Table 8-1. Chelating Agents Used
- Page 120 and 121:
Table 8-3. Published Experience wit
- Page 122 and 123:
CHAPTER 9.BREASTFEEDINGKey Consid
- Page 124 and 125:
maternal blood exceeds 40 µg/dL (L
- Page 126 and 127:
guidance for breastfeeding by women
- Page 128 and 129:
Table 9-1. Frequency of Maternal Bl
- Page 130 and 131:
Table 9-3. Estimated a Increase in
- Page 132 and 133:
CHAPTER 10.RESEARCH, POLICY, AND HE
- Page 134 and 135:
Identification and development of n
- Page 136 and 137:
Mandatory Reporting of All Adult Bl
- Page 138 and 139:
CHAPTER 11. RESOURCES AND REFERRAL
- Page 140 and 141:
Offce of Pollution Prevention and T
- Page 142 and 143:
Marino PE, Landrigan PJ, Graef J, N
- Page 144 and 145:
Dietrich KN, Ris MD, Succop PA, Ber
- Page 146 and 147:
McMichael AJ, Vimpani GV, Robertson
- Page 148 and 149:
Vigeh M, Yokoyama K, Mazaheri M, Be
- Page 150 and 151:
Gulson BL, Jameson CW, Mahaffey KR,
- Page 152 and 153:
Satin KP, Neutra RR, Guirguis G, Fl
- Page 154 and 155:
Centers for Disease Control and Pre
- Page 156 and 157:
Lee MG, Chun OK, Song WO. 2005. Det
- Page 158 and 159:
Simpson E, Mull JD, Longley E, East
- Page 160 and 161:
Rothenberg SJ, Khan F, Manalo M, Ji
- Page 162 and 163:
Piazza C, Fisher W, Hanley G, LeBla
- Page 164 and 165:
Godwin HA. 2001. The biological che
- Page 166 and 167:
Looker AC, Loyevsky M, Gordeuk VR.
- Page 168 and 169:
Willoughby RA, Thirapatsakun T, McS
- Page 170 and 171:
Bachrach VR, Schwarz E, Bachrach LR
- Page 172 and 173:
U.S. Food and Drug Administration.
- Page 174 and 175:
Appendices 149
- Page 176 and 177:
Appendix IExisting State Legislatio
- Page 178 and 179:
Guidelines for the Identification &
- Page 180 and 181:
Appendix IICharge Questions to the
- Page 182 and 183:
Guidelines for the Identification &
- Page 184 and 185:
Appendix IIICommonly Ingested Subst
- Page 186 and 187:
Guidelines for the Identification &
- Page 188 and 189:
Appendix IVList of Occupations and
- Page 190 and 191:
Guidelines for the Identification &
- Page 192 and 193:
Appendix VAlternative Cosmetics, Fo
- Page 194 and 195:
Guidelines for the Identification &
- Page 196 and 197:
Appendix VIRecommendations for Medi
- Page 198 and 199:
Research | Mini-Monograph Recommend
- Page 200 and 201:
Recommendations for medical manag
- Page 202 and 203:
Recommendations for medical manag
- Page 204 and 205:
Recommendations for medical managem
- Page 206 and 207:
Recommendations for medical managem
- Page 208 and 209:
Appendix VIIMedical Management Guid
- Page 210 and 211:
Medical Management Guidelines for L
- Page 212 and 213:
Because lead interferes with bioche
- Page 214 and 215:
The clinician, with the patient’s
- Page 216 and 217:
i.e., at least monthly. In general,
- Page 218 and 219:
If elevated maternal blood lead is
- Page 220 and 221:
TABLE 2Non-occupational and Environ
- Page 222 and 223:
TABLE 4TABLE 4Health Based Health M
- Page 224 and 225:
Gulson BL, Mizon KJ, Korsch MJ, Pal
- Page 226 and 227:
Appendix VIIIPregnancy Risk Assessm
- Page 228 and 229:
EDC:_________________ID:___________
- Page 230 and 231:
ID:___________________________B. HO
- Page 232 and 233:
ID:___________________________10. I
- Page 234 and 235:
ID:___________________________14a.
- Page 236 and 237:
ID:___________________________G. NO
- Page 238 and 239:
ID:___________________________I. PA
- Page 240 and 241:
SUMMARYInstructions: Check all thos
- Page 242 and 243:
ID:___________________________APPEN
- Page 244 and 245:
Appendix IXAssessment Interview For
- Page 246 and 247:
RISK ASSESSMENT INTERVIEW FORMDate:
- Page 248 and 249:
Appendix XLead Based Paint Risk Ass
- Page 250 and 251:
Lead-Based Paint Risk Assessment Re
- Page 252 and 253:
(Use one of the following sentences
- Page 254 and 255:
Appendix ATesting Locations229
- Page 256 and 257:
Appendix CDust Wipe and Soil Sample
- Page 258 and 259:
Appendix XIPrimary Prevention Infor
- Page 260 and 261:
LI #:NEW YORK CITY DEPARTMENT OF HE
- Page 262 and 263:
LI #:8a. If yes >> Please tell me h
- Page 264 and 265:
Appendix XIIChild Risk Assessment F
- Page 266 and 267:
CHILD ID: Page 1 of 12PNEW YORK CIT
- Page 268 and 269:
CHILD ID: Page 3 of 126. Does [chil
- Page 270 and 271:
CHILD ID: Page 5 of 1217a. If yes >
- Page 272 and 273:
CHILD ID: Page 7 of 1224. [Imported
- Page 274 and 275:
CHILD ID: Page 9 of 12Home renovati
- Page 276 and 277:
CHILD ID: Page 11 of 12Provide the
- Page 278 and 279:
Appendix XIIINutritional Reference
- Page 280 and 281:
Nutrition Reference InformationRECO
- Page 282 and 283:
Blood hemoglobin levels are routine
- Page 284 and 285:
Beef, chuck, blade roast, lean, coo
- Page 286 and 287:
Sunflower oil, 1 TbspCottonseed oil
- Page 288 and 289:
Appendix XIVTemplate for Letter to
- Page 290 and 291:
Template for Letter to Construction
- Page 292 and 293:
Appendix XVWorkplace Hazard Alert f
- Page 294 and 295:
WORKPLACE HAZARD ALERTNew Health Da
- Page 296 and 297:
What should I tell my doctor?Your d
- Page 298 and 299:
Make sure you don’t accidentally
- Page 300 and 301:
Worksite Evaluation FormWhat your e
- Page 302:
CS2016857