Download this file
Download this file
Download this file

You also want an ePaper? Increase the reach of your titles
YUMPU automatically turns print PDFs into web optimized ePapers that Google loves.
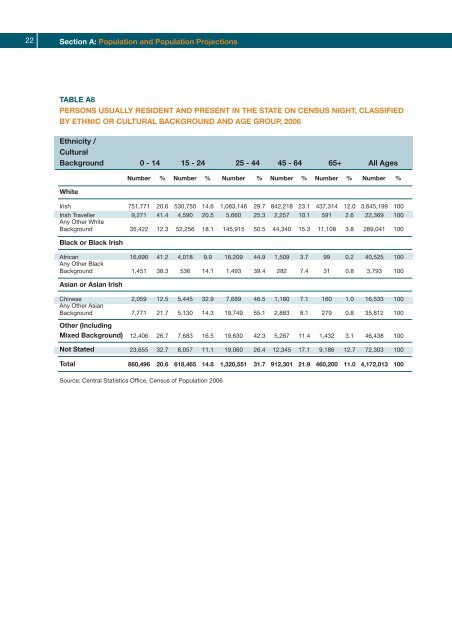
22Section A: Population and Population ProjectionsTABLE A8PERSONS USUALLY RESIDENT AND PRESENT IN THE STATE ON CENSUS NIGHT, CLASSIFIEDBY ETHNIC OR CULTURAL BACKGROUND AND AGE GROUP, 2006Ethnicity /CulturalBackground 0 - 14 15 - 24 25 - 44 45 - 64 65+ All AgesWhiteIrish 751,771 20.6 530,750 14.6 1,083,146 29.7 842,218 23.1 437,314 12.0 3,645,199 100Irish Traveller 9,271 41.4 4,590 20.5 5,660 25.3 2,257 10.1 591 2.6 22,369 100Any Other WhiteBackground 35,422 12.3 52,256 18.1 145,915 50.5 44,340 15.3 11,108 3.8 289,041 100Black or Black IrishAfrican 16,690 41.2 4,018 9.9 18,209 44.9 1,509 3.7 99 0.2 40,525 100Any Other BlackBackground 1,451 38.3 536 14.1 1,493 39.4 282 7.4 31 0.8 3,793 100Asian or Asian IrishNumber % Number % Number % Number % Number % Number %Chinese 2,059 12.5 5,445 32.9 7,689 46.5 1,180 7.1 160 1.0 16,533 100Any Other AsianBackground 7,771 21.7 5,130 14.3 19,749 55.1 2,883 8.1 279 0.8 35,812 100Other (IncludingMixed Background) 12,406 26.7 7,683 16.5 19,630 42.3 5,287 11.4 1,432 3.1 46,438 100Not Stated 23,655 32.7 8,057 11.1 19,060 26.4 12,345 17.1 9,186 12.7 72,303 100Total 860,496 20.6 618,465 14.8 1,320,551 31.7 912,301 21.9 460,200 11.0 4,172,013 100Source: Central Statistics Office, Census of Population 2006