- Page 8 and 9: PageF. Juste, L. Val, C. Gracia and
- Page 10 and 11: PageT. Szalal, M. Blrkis, L. Radlcs
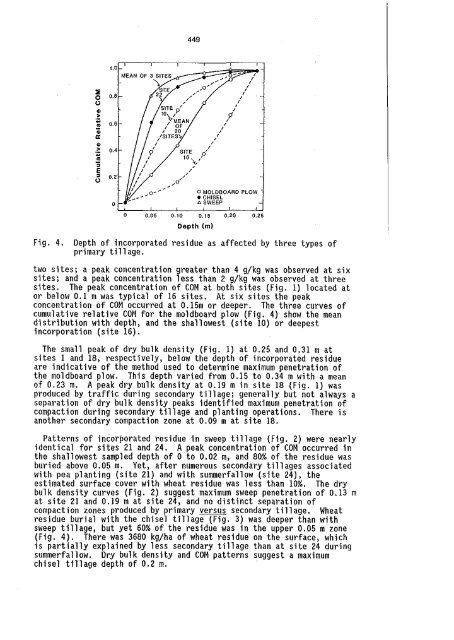
- Page 13 and 14: TILLAGE TOOL INFLUENCES ON INCORPOR
- Page 15: the COM analysis. After the COM ana
- Page 19 and 20: A SUBSOILER WITH PFGSURIZED SEN?IGE
- Page 21 and 22: RESULTS AND DISCUSSIONDRAWN SWILER
- Page 23 and 24: sludge was constant regardless of t
- Page 25: THE DETERMINATION OF PLOW DRAUGHT F
- Page 28 and 29: draught, over a distance of 50 m, f
- Page 30 and 31: Results shown in Table 3 indicate t
- Page 32 and 33: KINEMATICSAny point on the rotor Ra
- Page 34 and 35: passage of sowing-machine.The loose
- Page 36 and 37: Fig. 3. Photographs of the sections
- Page 38 and 39: on loess soils. All tillage measure
- Page 40 and 41: of diameters over 30 pm, up to a ma
- Page 42 and 43: can be described by means of square
- Page 44 and 45: drill furrow openers. Their design
- Page 46 and 47: DISCUSSIONThe average soil cone res
- Page 48: Table 111. Influence of tillage sys
- Page 51 and 52: gage data wurt: recorded 011 a micr
- Page 53 and 54: Vertical forcemeasurementinstrument
- Page 55 and 56: AN INVESTIGATION INTO ?HE PERFORMAN
- Page 57 and 58: of the top 50 mn of soil has been r
- Page 59 and 60: . . - ORIGINAL POSITIONFINAL POSITI
- Page 61 and 62: THE EFFECT OF STRESS DURATION ON TH
- Page 63 and 64: In Fig. 1, the mean vertical stress
- Page 65 and 66: REFERENCESBlackwell, P.S. and Soane
- Page 67 and 68:
EFFECT OF SUBSOILING ON PHYSICAL PR
- Page 69 and 70:
(Sl)('21)Number of readingsNumber o
- Page 71:
JANIESON, J. E., 1987. The effect o
- Page 74 and 75:
Consiie?ing the ebove , the objecti
- Page 76 and 77:
The data of v:oi'i:i~ elementsTable
- Page 78:
(mrr rerf8ao of dt'ferent mke ongle
- Page 81 and 82:
wedges with top angle and lower bou
- Page 83 and 84:
in higher ~iio~sture stress in 13 a
- Page 85 and 86:
The compacted pan with an average b
- Page 87 and 88:
epjrts the findings of a study on t
- Page 89 and 90:
obtained with conventional tillage
- Page 91 and 92:
This indicated that soil strength i
- Page 93 and 94:
(i) The conventional system (14DT)
- Page 96 and 97:
SECTION 5CONSTRAINTS AND ADVANTAGES
- Page 98 and 99:
Since all forward and vertical disp
- Page 100 and 101:
525Table 11. Coulter dimensions.Thi
- Page 102 and 103:
SOIL DISPLACEMENT BY ROLLING COULTE
- Page 104 and 105:
Plant establishmentPlant establishm
- Page 106 and 107:
However, results were very variable
- Page 108 and 109:
A NEW ROTARY TILLAGE IMPLEMENT FOR
- Page 110 and 111:
observed, It was found that the soi
- Page 112 and 113:
I.IATERIALS AND t.1ETHODSThs experi
- Page 114 and 115:
DISCUSSION. .lhe above-observed det
- Page 116 and 117:
Fauck, R., I~loureaux, C., and Thom
- Page 118 and 119:
precipitation generally reaches 850
- Page 120 and 121:
IIW - DEEP PLWGH1160 OTHLR 11LUGE5
- Page 122 and 123:
TABU 3 - Crop: barley; previous cro
- Page 124 and 125:
MATERIALS AND METHODSThe experiment
- Page 126 and 127:
Table I: Effects of Increasing Leve
- Page 129 and 130:
DIFFERENTIAL PERFORMANCE OF CASSAVA
- Page 131 and 132:
The phenomenon of the furrow soil b
- Page 133 and 134:
REDUCED TILLAGE AND STRA\\' INCORPO
- Page 135 and 136:
and, in most cases, the reference t
- Page 137 and 138:
Soil temperatures were monitored co
- Page 139 and 140:
EFFECT OF DIFFERENT METHODS OF TILL
- Page 141 and 142:
increased with depth of tillage as
- Page 143:
Doss, B.D., W.I. Dunias and Z.F. Lu
- Page 146 and 147:
The differences are the following:1
- Page 148 and 149:
3. Crop residues and the omittabili
- Page 150 and 151:
OPTIMAL SOIL MOISTURE CONTENT OF VA
- Page 152 and 153:
Finally a lot of documents were giv
- Page 154 and 155:
Nine different final effects on soi
- Page 156 and 157:
DISCUSSION 588To give value to this
- Page 158 and 159:
on Soil Survey, 1987).humid.Soil mo
- Page 160 and 161:
Pasture renovationIn Atlantic Canad
- Page 162 and 163:
Kunclius, H.T., Campbell, A.J., McR
- Page 164 and 165:
harroruings; (Red.)-two passes of a
- Page 166 and 167:
only by weed control. Total weed co
- Page 169 and 170:
DEVELOPMENT AN0 EVOLUTION OF THE ZO
- Page 171 and 172:
y the various tools and implements,
- Page 173 and 174:
The evolution of three main tillage
- Page 175 and 176:
S'IH,\U Rk.sllJL'li ?IA,XAtiEEIEN'I
- Page 177 and 178:
esulted in an increase in the numbe
- Page 179 and 180:
4 l e i 01' d~sease were unaf!ccted
- Page 181 and 182:
THE EFFECT OF DEPTH OF srluw INCOKP
- Page 183 and 184:
Straw hurlalThe proporti011 of the
- Page 185 and 186:
REFERENCESAnon, 1983. Straw Survey
- Page 187 and 188:
TILLAGE PRACTICES OF SUGAR CANE: EF
- Page 189 and 190:
RESULTS AND DISCUSSIONBy the result
- Page 191 and 192:
indicates the in~portance of the us
- Page 193 and 194:
625INFLUENCE OF LONG-TERM MINIMUM T
- Page 195 and 196:
While phosphorus, potassium and org
- Page 197 and 198:
YieldsWheat (t/ha)Year I I1 I11Corn
- Page 199 and 200:
DIVERSE TILLAGE SYSTEMS IN SEblI-AR
- Page 201 and 202:
followed by pulling or cutting at g
- Page 203 and 204:
Average weedscore ingrowing seasonl
- Page 205 and 206:
EFFECT OF THE PARAPLOW ON SOIL PROP
- Page 207 and 208:
At beginning of May RED was highest
- Page 209 and 210:
Dehydrogenase activity (mg Tdphenyl
- Page 211 and 212:
DIRECT PLANTING OF POTATOESE. EKEBE
- Page 213 and 214:
Figure I. The relationship of the d
- Page 215:
y a variety of means - chemical, me
- Page 218 and 219:
MATERIALS AND METHODSCatchment stud
- Page 220 and 221:
that the < 0.03 mm size particles a
- Page 222 and 223:
9 1 May 90mm9 IsJune 40mms 1SJune 9
- Page 224 and 225:
the simple compactings caused by we
- Page 226 and 227:
Picture 3TieflockerungssystemeHubsc
- Page 228 and 229:
Field size(length x width)Efficienc
- Page 230 and 231:
compact in the Earth gravity field
- Page 232 and 233:
summer crop yields under dryfarming
- Page 234 and 235:
Figure 2.Evolution of average resis
- Page 236 and 237:
a soil to a depth of 38 cm disrupte
- Page 238 and 239:
670TABLE I11Soil bulk density 30 da
- Page 240 and 241:
Good yields also were obtained by t
- Page 242 and 243:
Clay soils commonly have poor perme
- Page 244 and 245:
(e>st$~u led ssuuot) Plelh ugem
- Page 246 and 247:
678DISCUSSIONThe increase in soil p
- Page 248 and 249:
moving over the soil surface (surfa
- Page 250 and 251:
TABLE 111. Effect of cultivation on
- Page 252 and 253:
DISCUSSIONConsiderable losses of ni
- Page 254 and 255:
EXPERIMENTAL METHODThe site details
- Page 256 and 257:
- ~ Irect drilledPloughedJanuary 19
- Page 258 and 259:
esulting from infill of both cracks
- Page 260 and 261:
3. Surface residues (stubble and st
- Page 262 and 263:
REFERENCES- Girsldez et al., 1985.
- Page 264 and 265:
Table 111. Crop yields (kg/ha 15% d
- Page 266 and 267:
{xqx?~ il,:sc~ribcs soil xater and
- Page 268 and 269:
'fie following conclusion can be dr
- Page 270 and 271:
1Trtble 11. Cover crop residue effe
- Page 272 and 273:
the 1983-85 period at the experimen
- Page 274 and 275:
TABLE 11. Changes in soil bulk dens
- Page 276 and 277:
differences, but there was a slight
- Page 278 and 279:
30 - 60, 60 - 90 cm). The Nmin-valu
- Page 280 and 281:
Table 2: Nitrogen mineralised (kg/h
- Page 283 and 284:
THE WIDELY PRACTICED NEW RATIONAL T
- Page 285 and 286:
In that third year the yields were
- Page 287 and 288:
with constant change of direction (
- Page 289 and 290:
PEDOTECHNIQUE - INVENTORY OF PREDIC
- Page 291 and 292:
Fig. 2. Classic tests to characteri
- Page 293 and 294:
Approximation methods, such as the
- Page 295 and 296:
RESIDUE MANAGEMENT, NITROGEN, AND T
- Page 297 and 298:
Table la. Effects of tillage method
- Page 299:
esidue for the 1981 crop, however,
- Page 302 and 303:
differeoces in soil, cropping syste
- Page 304 and 305:
Table 2.Cumulative infiltration and
- Page 307 and 308:
SOIL PROPERTIES OF A NORTHERN CORN
- Page 309 and 310:
For the 1987 crop, year of reported
- Page 311 and 312:
The relatively low infiltration for
- Page 313 and 314:
745THE HISTORY AND DEVELOPMENT OF T
- Page 315 and 316:
position in the middle period of Wa
- Page 317 and 318:
In the last of Qing Dynasty, wood o
- Page 319 and 320:
THE EFFECT OF CULTIVATION ON THE GR
- Page 321 and 322:
In the 0-50 mm depth zone, the disc
- Page 323 and 324:
CONCLUSIONS1. There was no effect o
- Page 325 and 326:
INTERACTION BETWEEN SOIL TILLAGE AN
- Page 327 and 328:
Fig. 1. Relative grain yield compar
- Page 329 and 330:
Fig. 5. Soil P205 - Index (1986) af
- Page 331 and 332:
THE USE OF EXPERT SYSTEMS TO PROVID
- Page 333 and 334:
Table 1. Maise and Soya Bean Yield
- Page 335 and 336:
Im = 9 - 3100 + 1.0 and Ls = 0.4 (L
- Page 337 and 338:
PERFORMANCE OF ZERO-TILLAGE IN WHEA
- Page 339 and 340:
Table 11 Soil physical and chemical
- Page 341 and 342:
Table IV Maize and wheat yield (Mg
- Page 343 and 344:
COMPUTERIZED SELECTION OF PLANTERS
- Page 345 and 346:
appropriate conservation planting m
- Page 347 and 348:
LITERATURE CITEDDenniog, P. J. 1986
- Page 349 and 350:
EVALUATION OF TILLAGE AND EQUIPMENT
- Page 351 and 352:
Ihe technical coefficients are expr
- Page 353 and 354:
Performance Parameters for Equipmen
- Page 355 and 356:
SOIL PROPERTIES UNDER BUSH, MANUAL
- Page 357 and 358:
Treatment Jan Feb hlar Apr hlay Jun
- Page 359 and 360:
TILLAGE RESEARCH AND PLOUGHING TECH
- Page 361 and 362:
There are several contributory fact
- Page 363 and 364:
those techniques which "... retain
- Page 365 and 366:
EFFECT OF SUBSOILING A COMPACTED CL
- Page 367 and 368:
computed by mult~ply~ng N concentra
- Page 370 and 371:
3 - The Increased nitrogen uptake a
- Page 372 and 373:
timun replenishment and conservatio
- Page 374 and 375:
-.< cPB-10.b lb1 June 87.A cultivat
- Page 376 and 377:
Garcia, M., GirAldez, J.V., Gonzale
- Page 378 and 379:
The physical characteristics desire
- Page 380 and 381:
Sig. levelGrain yield 5.5 bu/ac 2%P
- Page 382 and 383:
Tillage system and surface residue
- Page 384 and 385:
EXPERIMENTAL PLANS AND SOIL TYPESA
- Page 386 and 387:
As an average of all locations ther
- Page 388 and 389:
ovol. % pores > 30- ploughing-- - .
- Page 390 and 391:
Until about 1980, the standard till
- Page 392 and 393:
Table I: Comparison of seed cotton
- Page 394 and 395:
emoval, different placement depths
- Page 396 and 397:
The objectives of these field studi
- Page 398 and 399:
with no differences in yield due to
- Page 400 and 401:
~REFERENCESAdams. F.. ~, 1984.-~- -
- Page 402 and 403:
Table ICultural practices for each
- Page 404 and 405:
Soil bulk density reflected tillage
- Page 406 and 407:
OD:
- Page 408 and 409:
Fig.1. Monthly averages of air temp
- Page 410 and 411:
treatment A, which recorded its hig
- Page 412 and 413:
ly due to pedological and climatic
- Page 414 and 415:
EQUIPMENTFor the 1986 season, liqui
- Page 416 and 417:
Distance along plot (m)Fig. 3. Meas
- Page 418 and 419:
thought to be due to the physical d
- Page 420 and 421:
METEOROLOGICAL CONDITIONSIn the reg
- Page 422 and 423:
Beside these problems, it was neces
- Page 425 and 426:
RESIDUAL EFFECT OF CHISELLING ON GR
- Page 427 and 428:
Table IBulk density( Mg mm3) of var
- Page 429 and 430:
Table VEffect of tillage methods on
- Page 431 and 432:
MECHANISMS BY WHICH STRAW RESIDUES
- Page 433 and 434:
development in the field experiment
- Page 435 and 436:
seed from the mixed soil and straw
- Page 437 and 438:
MULCH-SEED TECHNIQUES FOR CONSERVAT
- Page 439 and 440:
2. A different design is to cut thr
- Page 441:
Fig,. 6: Soil loosening, seedbed pr
- Page 444 and 445:
crops are gro~n. Therefore, plant m
- Page 446 and 447:
No significant differences in sugar
- Page 449 and 450:
STUDY OF THE METHOD OF RATIONAL SOI
- Page 451 and 452:
(b) Examination of enerav and other
- Page 453 and 454:
THE EFFECTS OF TILLAGE AN0 FERTILIZ
- Page 455 and 456:
the usual implement, resulted in th
- Page 457 and 458:
Table 5. The effects of tillage and
- Page 459 and 460:
INFLUENCE OF SOIL CULTIVATION METHO
- Page 461 and 462:
plough version with subsequent rota
- Page 463 and 464:
Decreasing soil rnnt.,-tT---.intnnr
- Page 465 and 466:
EFFECTS OF GRASS AND LEGUMES AS A G
- Page 467 and 468:
Biomass production and nitro en iel
- Page 469 and 470:
The lines in quadrant IV are essent
- Page 471 and 472:
THE GROWTH OF MAIZE AFTER WETLAND R
- Page 473 and 474:
The data was analyzed using a split
- Page 475 and 476:
TABLE VlilSignificance levels for s
- Page 477 and 478:
PEDOTECHNIQUE:HANDLINGSOIL CLASSIFI
- Page 479 and 480:
laboratory conditions. Therefore, t
- Page 481 and 482:
Field Traffic Problems", at the 14t
- Page 483 and 484:
SOME CHARACTERISTICS OF SOIL TILLAG
- Page 485 and 486:
CLIMATIC CHARACTERISTICSBasic meteo
- Page 487 and 488:
Table I1Working operations in maize
- Page 489 and 490:
CROP SEQUENCE AND CONSERVATION TILL
- Page 491 and 492:
RESULTS AND DISCUSSION1. Soil Struc
- Page 493 and 494:
Maize grain yields on loam soil (Fi
- Page 495 and 496:
MANAGING CROP RESIDUE AND TILLAGE P
- Page 497 and 498:
DISCUSSIONThe chisel plow system in
- Page 499 and 500:
TABLE I. Soil characteristics and a
- Page 501 and 502:
PHYSICAL PROPERTIES OF TWO STRUCTUR
- Page 503 and 504:
Table 11.Mean penetration resistanc
- Page 505 and 506:
Mullins, 1988). These cores had a p