- Page 1 and 2: A Simple Poverty Scorecard for the
- Page 3 and 4: comparable across organizations nor
- Page 7 and 8: points or less for estimates of cha
- Page 9 and 10: counted as if it had only one perso
- Page 11 and 12: derived from the 2000 FIES by the N
- Page 13 and 14: Given this, the USD1.25/day 2005 PP
- Page 15 and 16: Reyes builds a scorecard using the
- Page 17 and 18: that quickly show how estimated pov
- Page 19 and 20: 3.3 Gwatkin et al.Gwatkin et al. (2
- Page 21 and 22: includes income, the PCA index cann
- Page 23 and 24: One of these one-indicator scorecar
- Page 25 and 26: The scorecard in Figure 1 is ready
- Page 27 and 28: If not determined by other factors,
- Page 29 and 30: 6.1 Calibrating scores with poverty
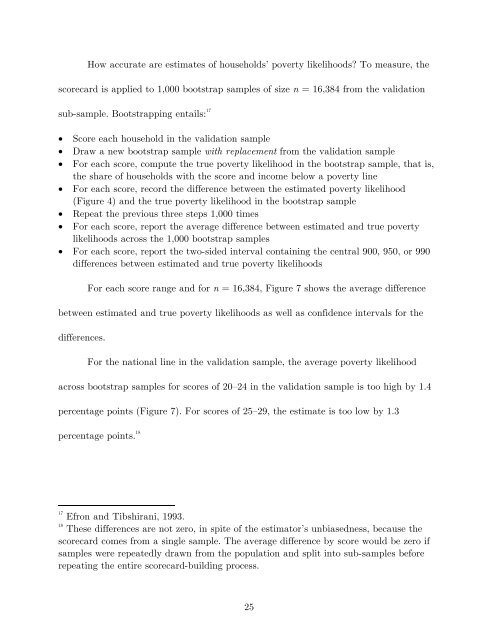
- Page 31: 6.2 Accuracy of estimates of househ
- Page 35 and 36: 7. Estimates of a group’s poverty
- Page 37 and 38: To derive a sample-size formula (or
- Page 39 and 40: 21.64n = 0. 55 ⋅⎛ ⎞⎜ ⎟
- Page 41 and 42: 8. Estimates of changes in group po
- Page 43 and 44: 2002 in the Philippines is the diff
- Page 45 and 46: from 0.63 to 0.77 (Figure 10), sugg
- Page 47 and 48: To illustrate the use of (8), suppo
- Page 49 and 50: the four possible targeting outcome
- Page 51 and 52: As an alternative to assigning bene
- Page 53 and 54: at a point in time is always less t
- Page 55 and 56: ReferencesAdams, N.M.; and D.J. Han
- Page 57 and 58: Hentschel, Jesko; Lanjouw, Jean Ols
- Page 59 and 60: Onwujekwe, Obinna; Hanson, Kara; an
- Page 61 and 62: Stillwell, William G.; Barron, F. H
- Page 63 and 64: Figure 1: A simple poverty scorecar
- Page 65 and 66: Figure 3: Poverty indicators by unc
- Page 67 and 68: Figure 3 (cont.): Poverty indicator
- Page 69 and 70: National Poverty Line Tables(and Ta
- Page 71 and 72: Figure 5 (National poverty line): D
- Page 73 and 74: Figure 7 (National poverty line): B
- Page 75 and 76: Figure 9 (National poverty line): D
- Page 77 and 78: Figure 11 (All poverty lines): Poss
- Page 79 and 80: Figure 13 (National poverty line):
- Page 81 and 82: Figure 4 (National food poverty lin
- Page 83 and 84:
Figure 7 (National food poverty lin
- Page 85 and 86:
Figure 12 (National food poverty li
- Page 87 and 88:
USAID “Extreme” Poverty Line Ta
- Page 89 and 90:
Figure 5 (USAID “Extreme” pover
- Page 91 and 92:
Figure 9 (USAID “Extreme” pover
- Page 93 and 94:
Figure 13 (USAID “Extreme” pove
- Page 95 and 96:
Figure 4 (USD1.25/day 2005 PPP line
- Page 97 and 98:
Figure 7 (USD1.25/day 2005 PPP line
- Page 99 and 100:
Figure 12 (USD1.25/day 2005 PPP lin
- Page 101 and 102:
USD2.50/Day 2005 PPP Poverty Line T
- Page 103 and 104:
Figure 5 (USD2.50/day 2005 PPP line
- Page 105 and 106:
Figure 9 (USD2.50/day 2005 PPP line
- Page 107 and 108:
Figure 13 (USD2.50/day 2005 PPP lin
- Page 109 and 110:
Figure 4 (USD3.75/day 2005 PPP line
- Page 111 and 112:
Figure 7 (USD3.75/day 2005 PPP line
- Page 113 and 114:
Figure 12 (USD3.75/day 2005 PPP lin
- Page 115 and 116:
USD5.00/Day 2005 PPP Poverty Line T
- Page 117 and 118:
Figure 5 (USD5.00/day 2005 PPP line
- Page 119 and 120:
Figure 9 (USD5.00/day 2005 PPP line
- Page 121 and 122:
Figure 13 (USD5.00/day 2005 PPP lin
- Page 123 and 124:
Figure 4 (USD4.32/day 1993 PPP line
- Page 125 and 126:
Figure 7 (USD4.32/day 1993 PPP line
- Page 127 and 128:
Figure 12 (USD4.32/day 1993 PPP lin
- Page 129 and 130:
National Poverty Line Tablesfor 200
- Page 131 and 132:
Figure 9 (National line): Differenc
- Page 133 and 134:
Figure 13 (National line): For a gi
- Page 135 and 136:
Figure 7 (Food line): Bootstrapped
- Page 137 and 138:
Figure 12 (Food line): Households b
- Page 139 and 140:
USAID “Extreme” Poverty Line Ta
- Page 141 and 142:
Figure 9 (USAID “extreme” line)
- Page 143 and 144:
Figure 13 (USAID “extreme” line
- Page 145 and 146:
Figure 7 (USD1.25/day 2005 PPP line
- Page 147 and 148:
Figure 12 (USD1.25/day 2005 PPP lin
- Page 149 and 150:
USD2.50/day 2005 PPP Poverty Line T
- Page 151 and 152:
Figure 9 (USD2.50/day 2005 PPP line
- Page 153 and 154:
Figure 13 (USD2.50/day 2005 PPP lin
- Page 155 and 156:
Figure 7 (USD3.75/day 2005 PPP line
- Page 157 and 158:
Figure 12 (USD3.75/day 2005 PPP lin
- Page 159 and 160:
USD5.00/day 2005 PPP Poverty Line T
- Page 161 and 162:
Figure 9 (USD5.00/day 2005 PPP line
- Page 163 and 164:
Figure 13 (USD5.00/day 2005 PPP lin
- Page 165 and 166:
Figure 7 (USD4.32/day 1993 PPP line
- Page 167 and 168:
Figure 12 (USD4.32/day 1993 PPP lin
- Page 169 and 170:
Poverty Lines and Poverty Rates,by
- Page 171 and 172:
Figure A2: All-urban Philippines an
- Page 173 and 174:
Figure A4: Agusan del Norte, povert
- Page 175 and 176:
Figure A6: Aklan, poverty lines and
- Page 177 and 178:
Figure A8: Antique, poverty lines a
- Page 179 and 180:
Figure A10: Bataan, poverty lines a
- Page 181 and 182:
Figure A12: Batangas, poverty lines
- Page 183 and 184:
Figure A14: Bohol, poverty lines an
- Page 185 and 186:
Figure A16: Bulacan, poverty lines
- Page 187 and 188:
Figure A18: Camarines Norte, povert
- Page 189 and 190:
Figure A20: Camiguin, poverty lines
- Page 191 and 192:
Figure A22: Catanduanes, poverty li
- Page 193 and 194:
Figure A24: Cebu, poverty lines and
- Page 195 and 196:
Figure A26: Davao del Sur, poverty
- Page 197 and 198:
Figure A28: Eastern Samar, poverty
- Page 199 and 200:
Figure A30: Ilocos Norte, poverty l
- Page 201 and 202:
Figure A32: Iloilo, poverty lines a
- Page 203 and 204:
Figure A34: Kalinga, poverty lines
- Page 205 and 206:
Figure A36: Laguna, poverty lines a
- Page 207 and 208:
Figure A38: Lanao del Sur, poverty
- Page 209 and 210:
Figure A40: Maguindanao, poverty li
- Page 211 and 212:
Figure A42: Marinduque, poverty lin
- Page 213 and 214:
Figure A44: Misamis Occidental, pov
- Page 215 and 216:
Figure A46: Mountain Province, pove
- Page 217 and 218:
Figure A48: Negros Oriental, povert
- Page 219 and 220:
Figure A50: Northern Samar, poverty
- Page 221 and 222:
Figure A52: Nueva Vizcaya, poverty
- Page 223 and 224:
Figure A54: Oriental Mindoro, pover
- Page 225 and 226:
Figure A56: Pampanga, poverty lines
- Page 227 and 228:
Figure A58: Quezon, poverty lines a
- Page 229 and 230:
Figure A60: Rizal, poverty lines an
- Page 231 and 232:
Figure A62: Western Samar, poverty
- Page 233 and 234:
Figure A64: Sorsogon, poverty lines
- Page 235 and 236:
Figure A66: Southern Leyte, poverty
- Page 237 and 238:
Figure A68: Sulu, poverty lines and
- Page 239 and 240:
Figure A70: Surigao del Sur, povert
- Page 241 and 242:
Figure A72: Tawi-tawi, poverty line
- Page 243 and 244:
Figure A74: Zamboanga del Norte, po
- Page 245 and 246:
Figure A76: 2nd District, poverty l
- Page 247 and 248:
Figure A78: 4th District, poverty l
- Page 249 and 250:
Figure A80: Biliran, poverty lines
- Page 251 and 252:
Figure A82: Saranggani, poverty lin
- Page 253 and 254:
Figure A84: Compostela Valley, pove
- Page 255 and 256:
Figure A86: Shariff Kabunsuan, pove
- Page 257 and 258:
Figure A88: Isabela City, poverty l