Assay Procedure
Assay Procedure
Assay Procedure

Create successful ePaper yourself
Turn your PDF publications into a flip-book with our unique Google optimized e-Paper software.
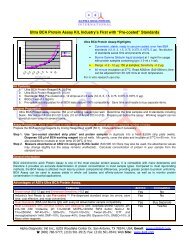
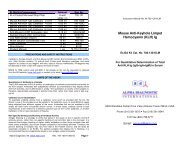
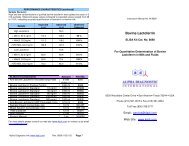
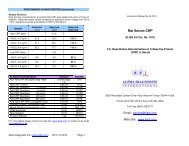
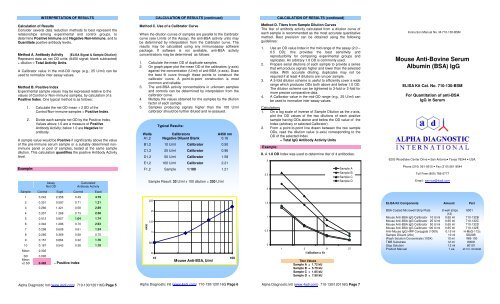
INTERPRETATION OF RESULTSCALCULATION OF RESULTS (continued)CALCULATION OF RESULTS (continued)Calculation of ResultsConsider several data reduction methods to best represent therelationships among experimental and control groups, todetermine Positive Immune and Negative Non-immune, and toQuantitate positive antibody levels.Method A. Antibody Activity [ELISA Signal & Sample Dilution]Represent data as net OD units (A450 signal; blank subtracted)÷ dilution = Total Activity Units.A Calibrator value in the mid-OD range (e.g., 25 U/ml) can beused to normalize inter-assay values.Method B. Positive IndexExperimental sample values may be expressed relative to thevalues of Control or Non-immune samples, by calculation of aPositive Index. One typical method is as follows:1. Calculate the net OD mean + 2 SD of theControl/Non-immune samples = Positive Index.2. Divide each sample net OD by the Positive Index.Values above 1.0 are a measure of PositiveAntibody Activity; below 1.0 are Negative forantibody.A sample value would be Positive if significantly above the valueof the pre-immune serum sample or a suitably determined nonimmunepanel or pool of samples, tested at the same sampledilution. This calculation quantifies the positive Antibody Activitylevel.Example:<strong>Assay</strong>Net ODCalculatedAntibody ActivitySample Control Exptl Control ExptlMethod C. Use of a Calibrator CurveWhen the dilution curves of samples are parallel to the Calibratorcurve (see Limits of the <strong>Assay</strong>), the anti-BSA activity units maybe determined by interpolation from the Calibrator curve. Theresults may be calculated using any immunoassay softwarepackage. If software is not available, anti-BSA activityconcentrations may be determined as follows:1. Calculate the mean OD of duplicate samples.2. On graph paper plot the mean OD of the calibrators (y-axis)against the concentration (U/ml) of anti-BSA (x-axis). Drawthe best fit curve through these points to construct thecalibrator curve. A point-to-point construction is mostcommon and reliable.3. The anti-BSA activity concentrations in unknown samplesand controls can be determined by interpolation from thecalibrator curve.4. Multiply the values obtained for the samples by the dilutionfactor of each sample.5. Samples producing signals higher than the 100 U/mlcalibrator should be further diluted and re-assayed.Typical Results:Wells Calibrators A450 nmA1,2 Negative Diluent Blank 0.16B1,2 10 U/ml Calibrator 0.50C1,2 25 U/ml Calibrator 0.96D1,2 50 U/ml Calibrator 1.58E1,2 100 U/ml Calibrator 2.21F1,2 Sample 1:100 1.21Sample Result: 33 U/ml x 100 dilution = 330 U/mlMethod D. Titers from Sample Dilution CurvesThe titer of antibody activity calculated from a dilution curve ofeach sample is recommended as the most accurate quantitativemethod. Best precision can be obtained using the followingguidelines:1. Use an OD value Index in the mid-range of the assay (2.0 –0.5 OD); this provides the best sensitivity andreproducibility for comparing experimental groups andreplicates. An arbitrary 1.0 OD is commonly used.2. Prepare serial dilutions of each sample to provide a seriesthat will produce signals higher and lower than the selectedindex. With accurate diluting, duplicates may not berequired if at least 4 dilutions are run per sample.3. A 5-fold dilution scheme is useful to efficiently cover a widerange which produces ODs both above and below 1.0 OD.The dilution scheme can be tightened to 3-fold or 2-fold formore precise comparative data.4. A Calibrator value in the mid-OD range (e.g., 25 U/ml) canbe used to normalize inter-assay values.Calculations1. On a log scale of inverse of Sample Dilution as the x-axis,plot the OD values of the two dilutions of each positivesample having ODs above and below the OD value of theIndex (arbitrary or selected Calibrator).2. From a point-to-point line drawn between the two sampleODs, read the dilution value (x-axis) corresponding to theOD of the selected Index= Total IgG Antibody Activity UnitsExample:II. A 1.0 OD Index was used to determine titer of 4 antibodies.32.52Sample ASample BSample CSample DInstruction Manual No. M-710-130-BSMMouse Anti-Bovine SerumAlbumin (BSA) IgGELISA Kit Cat. No. 710-130-BSMFor Quantitation of anti-BSAIgG in Serum6203 Woodlake Center Drive • San Antonio• Texas 78244 • USA.Phone (210) 561-9515 • Fax (210) 561-9544Toll Free (800) 786-5777Email: service@4adi.com1 0.243 2.358 0.49 4.792 0.351 0.597 0.71 1.213 0.286 1.421 0.58 2.894 0.357 1.268 0.73 2.585 0.512 0.857 1.04 1.746 0.342 1.296 0.70 2.637 0.298 0.608 0.61 1.248 0.285 0.369 0.58 0.759 0.157 0.864 0.32 1.7610 0.187 0.543 0.38 1.10Mean 0.302SD 0.095Mean+2 SD 0.492 = Positive IndexA4502.521.510.5010 100Mouse Anti-BSA, U/ml1.510.501 3 9 271/dilution x 1kTiter ValuesSample A = 1.72 kUSample B = 5.70 kUSample C = 1.85 kUSample D = 7.90 kUELISA Kit Components AmountPartBSA Coated Microwell Strip Plate 8-well strips 8001(12)Mouse Anti-BSA IgG Calibrator 10 U/ml 0.65 ml 710-132BMouse Anti-BSA IgG Calibrator 25 U/ml 0.65 ml 710-132CMouse Anti-BSA IgG Calibrator 50 U/ml 0.65 ml 710-132DMouse Anti-BSA IgG Calibrator 100 U/ml 0.65 ml 710-132EAnti-Mouse IgG HRP Conjugate (100X) 0.15 ml H-MsG-112cSample Diluent (20x) 10 ml SD20BWash Solution Concentrate (100X) 10 ml WB-100TMB Substrate 12 ml 80091Stop Solution 12 ml 80101Product Manual 1 ea M-710-130-BSMAlpha Diagnostic Intl (www.4adi.com) 710-130/120116G Page 5Alpha Diagnostic Intl (www.4adi.com) 710-130/120116G Page 6Alpha Diagnostic Intl (www.4adi.com) 710-130/120116G Page 7