Pulse Amplitude Modulation Fluorometry - Coral Reef Targeted ...
Pulse Amplitude Modulation Fluorometry - Coral Reef Targeted ...
Pulse Amplitude Modulation Fluorometry - Coral Reef Targeted ...

You also want an ePaper? Increase the reach of your titles
YUMPU automatically turns print PDFs into web optimized ePapers that Google loves.
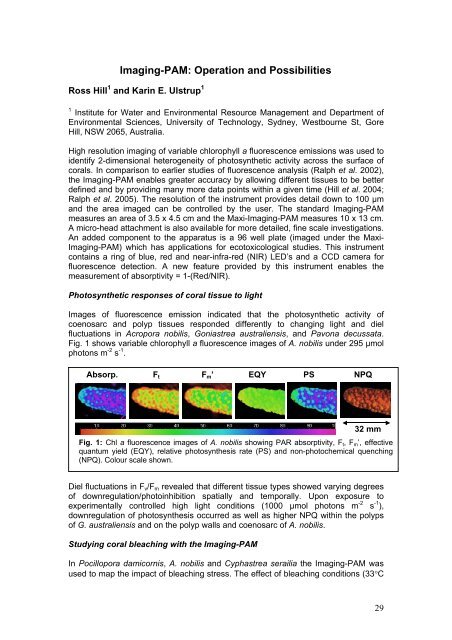
Imaging-PAM: Operation and PossibilitiesRoss Hill 1 and Karin E. Ulstrup 11 Institute for Water and Environmental Resource Management and Department ofEnvironmental Sciences, University of Technology, Sydney, Westbourne St, GoreHill, NSW 2065, Australia.High resolution imaging of variable chlorophyll a fluorescence emissions was used toidentify 2-dimensional heterogeneity of photosynthetic activity across the surface ofcorals. In comparison to earlier studies of fluorescence analysis (Ralph et al. 2002),the Imaging-PAM enables greater accuracy by allowing different tissues to be betterdefined and by providing many more data points within a given time (Hill et al. 2004;Ralph et al. 2005). The resolution of the instrument provides detail down to 100 µmand the area imaged can be controlled by the user. The standard Imaging-PAMmeasures an area of 3.5 x 4.5 cm and the Maxi-Imaging-PAM measures 10 x 13 cm.A micro-head attachment is also available for more detailed, fine scale investigations.An added component to the apparatus is a 96 well plate (imaged under the Maxi-Imaging-PAM) which has applications for ecotoxicological studies. This instrumentcontains a ring of blue, red and near-infra-red (NIR) LED’s and a CCD camera forfluorescence detection. A new feature provided by this instrument enables themeasurement of absorptivity = 1-(Red/NIR).Photosynthetic responses of coral tissue to lightImages of fluorescence emission indicated that the photosynthetic activity ofcoenosarc and polyp tissues responded differently to changing light and dielfluctuations in Acropora nobilis, Goniastrea australiensis, and Pavona decussata.Fig. 1 shows variable chlorophyll a fluorescence images of A. nobilis under 295 µmolphotons m -2 s -1 .Absorp. F t F m ’ EQY PS NPQ32 mmFig. 1: Chl a fluorescence images of A. nobilis showing PAR absorptivity, F t , F m ’, effectivequantum yield (EQY), relative photosynthesis rate (PS) and non-photochemical quenching(NPQ). Colour scale shown.Diel fluctuations in F v /F m revealed that different tissue types showed varying degreesof downregulation/photoinhibition spatially and temporally. Upon exposure toexperimentally controlled high light conditions (1000 µmol photons m -2 s -1 ),downregulation of photosynthesis occurred as well as higher NPQ within the polypsof G. australiensis and on the polyp walls and coenosarc of A. nobilis.Studying coral bleaching with the Imaging-PAMIn Pocillopora damicornis, A. nobilis and Cyphastrea serailia the Imaging-PAM wasused to map the impact of bleaching stress. The effect of bleaching conditions (33°C29