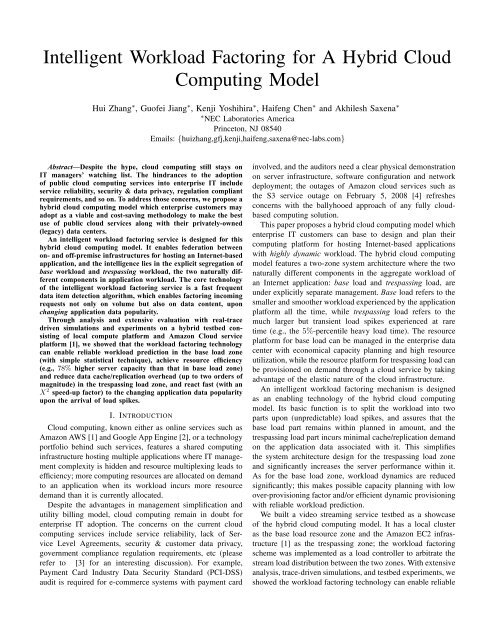
Intelligent Workload Factoring for A Hybrid Cloud Computing Model
Intelligent Workload Factoring for A Hybrid Cloud Computing Model
Intelligent Workload Factoring for A Hybrid Cloud Computing Model

Create successful ePaper yourself
Turn your PDF publications into a flip-book with our unique Google optimized e-Paper software.
4application requestsx% time<strong>Workload</strong> <strong>Factoring</strong>100% timeTrespassing ZoneLoad BalancingBase ZoneLoad BalancingapplicationserversapplicationdataShared resourec plat<strong>for</strong>m(cloud infrastructure)Dedicated application plat<strong>for</strong>m(local data center)Fig. 3.Application hosting plat<strong>for</strong>m architecture in the hybrid <strong>Cloud</strong> <strong>Computing</strong> <strong>Model</strong>V is the vertex set and N is the net set; the weight w i ofa vertex v i ∈ V is the expected workload caused by thisdata object, which is calculated as its popularity multipliedby average workload per request to access/process this data;another weight s i of a vertex v i ∈ V is the data size of thisobject; the cost c j of a net n j ∈ N is the expected data accessoverhead caused by this request type, which is calculated asthe expected request number of this type multiplied by thesum of its neighboring data objects’ size.The K-way hypergraph partition, an NP-hard problem [11],is to assign all vertices (data objects) to K (K=2 in our case)disjoint nonempty locations without the expected workloadbeyond their capacities, and achieve minimal partition costMin( ∑∑c j + γs i )n j∈N E v i∈V trespassingwhere ∑ n j∈N Ec j is the net cut cost (the total weights ofthe nets that span more than one location, there<strong>for</strong>e bringingremote data access/consistency overhead); ∑ v i∈V trespassings iis the total size of the data objects in the trespassing zone andrepresents the data transfer/replication overhead; γ is a factorto assign different weights on the two overhead components.There are fast partition solutions proposed like the bi-sectionpartition scheme [11]. For video streaming services whererequest-data relationship is simple and there is no net cut asone request accesses only one data item, the partition problemdegenerates to the knapsack problem where our greedy schemeis moving vertices from the base zone one by one ranked bytheir popularity until reaching the trespassing zone’s capacity.This is equal to redirect the requests <strong>for</strong> the most populardata items in a top-k list into the trespassing zone, and theremaining question is on how to quickly generate the correcttop-k list during a popularity transition time disturbed by theworkload burst. Next we gives the details of the workloadfactoring process.B. Logic viewapplicationrequestsFig. 4.<strong>Workload</strong> factoringworkloadprofilingbase loadthreshholdfast factoringbase zonetrespassing zoneLogic view of <strong>Workload</strong> <strong>Factoring</strong> Component.As shown in Figure 4, the intelligent workload factoring(IWF) scheme has three basic components: workload profilingbased load threshhold, and fast factoring. The workload profilingcomponent updates the current system load upon incomingrequests, and compares to the base load threshhold to decideif the system is in a normal mode or a panic mode. Thebase load threshold specifies the maximum load that the basezone can handle; it may be manually configured by operatorsaccording to the base zone capacity, or automatically set basedon the load history in<strong>for</strong>mation (e.g., the 95-percentile arrivalrate) which will also input into the base zone <strong>for</strong> resourceprovisioning decision. When the current system load is nothigher than the base load threshold, the fast factoring processis in the “normal” mode, and it simply <strong>for</strong>wards incomingrequests into the base zone. when the current system load ishigher than the base load threshold, it is in the panic modeand queries a fast frequent data item detection algorithm tocheck if an incoming request asks <strong>for</strong> data in a set of hot dataobjects; if yes, this request is <strong>for</strong>warded to the trespassingzone; otherwise, it is <strong>for</strong>warded to the base zone.
5incoming requestsFig. 5.Dcurrent requestmatchingm comparisonsData IDILcount3026Historical Top−K listfilteringR1Data IDR2FDcount2016Current Top−K listRcHistorical Request Queue (FIFO)Schematic Description of fastTopK algorithmC. Fast frequent data item detection algorithmWe call the fast frequent data item detection algorithmFastTopK. As shown in Figure 5, it has the following datastructures: a FIFO queue to record the last c requests, a listto record the current top-k popular data items, a list to recordthe historical top-k popular data items, and a list of countersto record the data items access frequency. Given a request r,the algorithm outputs “base” if r will go to the base zone,“trespassing” otherwise. It works as following:1) if the system is in the “normal” mode, the historicaltop-k list is always set as empty.2) if the system is in the “panic” mode and r is the firstrequest since entering this mode, copy the current topklist into the historical top-k list, reset all frequencycounters to 0, and empty the current top-k list.3) if r matches any of the historical top-k list (i.e., askingthe same data item), increases the frequency counter ofthat data item by 1 in the counter list, and update thehistorical top-k list based on counter values.4) otherwise, randomly draw m requests from the FIFOqueue, and compare them with r; if r matches any of them requests (i.e., asking the same data item), increasesthe frequency counter of that data item by 1 in thecounter list, and update the current top-k list based oncounter values.5) In the “normal” mode, always answer “base”.6) In the “panic” mode, combining the two top-k lists bycalculating the estimated request rate of each data item:<strong>for</strong> each item in the historical top-k list, the rate is itsfrequency counter value divided by the total requestsarrived since entering the “panic” mode; <strong>for</strong> each itemin the current top-k list, the rate is given in Lemma 1.7) if r’s data item is in the top k of the 2k joint items,answer “trespassing”, otherwise answer “base”.8) if r’s data item does not belong to the historical top-klist, add r into the FIFO queue <strong>for</strong> request history, andreturn.The key ideas in the fastTopK algorithm <strong>for</strong> speeding upfrequent data item detection have two: speeding up the topkdetection at changing data popularity distributions by prefilteringold popular data items in a new distribution, andspeeding up the top-k detection at a data popularity distributionby pre-filtering unpopular data items in this distribution.IV. ANALYSISIn this section, we present the per<strong>for</strong>mance analysis resultsof the FastTopK algorithm. The proofs are skipped due to pagelimit and are available in the companion technical report [12].A. Accuracy Requirement and Per<strong>for</strong>mance MetricThe correctness of the fastTopK algorithm relies on theaccuracy of the frequency counter in<strong>for</strong>mation, which is theestimation of the request rates on the corresponding data items.Formally, <strong>for</strong> a data item T , we define its actual requesttotal requests to Trate p(T ) =total requests. FastTopK will determine an)estimate p(T ˆ ) such that p(T ˆ ) ∈(p(T )(1 − β 2 ), p(T )(1 + β 2 )with probability greater than α. For example, If we set β =0.01, α = 99.9%, then the accuracy requirement states thatwith probability greater than 99.9% FastTopK will estimatep(T ) with a relative estimation error range of 1%. We use Z αto denote the α percentile <strong>for</strong> the unit normal distribution. Forexample, if α = 99.75%, then Z α = 3.Given the specified accuracy requirement, e measured theper<strong>for</strong>mance of the algorithm through• Sample Size: Sample size is defined to be the number ofrequest arrivals needed to per<strong>for</strong>m the estimation. We usethe term estimation time and sample size interchangeably.The following result is used to estimate the proportion p(T )from the frequency counter value of a data item in the currenttop-K list.Lemma 1 Let M k (N, T ) represent the frequency countervalue <strong>for</strong> the target data item T after N arrivals <strong>for</strong> fastTopKwith k comparison. Then,where√Nk[√Mk (N, T )Nk− p(T )]∼ N [ 0, σT2 ]σ 2 T = (1 − p2 (T ))(1 + 2(2k−1)p(T )(1+p(T )))4Proof: Follow Theorem 5 in [13].B. Estimation TimeNote the historical top-k list serves as a filter on thein<strong>for</strong>mation entering the FIFO queue. We call fastTopK a basicversion when without using the historical top-K list (such asin the normal mode), and that actively using the historicaltop-K lis a filtering version. For the estimation time of basicFastTopK,we have the following result:Lemma 2 Given the accuracy requirement described in SectionIV-A, and N C be the number of samples required <strong>for</strong>basic fastTopK.N C basic = 3Z2 αkβ 2 .Proof: Follow the results in [13].(1)
6Now, let us define an amplification factor X <strong>for</strong> the ratechange of a data item be<strong>for</strong>e and after the historical topk-Kfiltering asX = r afterr be<strong>for</strong>eFor example, if an data item takes 0.1% of the total requestsand takes 0.2% of the total requests filtered with the historicaltop-K data items, the amplification factor X = 2 <strong>for</strong> this dataitem. Then we can have the speedup results of the fastTopKalgorithm with the rate amplification factor X.Theorem 1 Given the accuracy requirement described in SectionIV-A, Nbasic C be the number of samples required <strong>for</strong> basicfastTopK, and Nfiltering C be the number of samples required<strong>for</strong> filtering fastTopK.N C filtering = N C basicX 2 .There<strong>for</strong>e, we have a X 2 speedup of the detection processeven with a X-factor on rate amplification due to historicalin<strong>for</strong>mation filtering.V. EVALUATIONThrough the evaluation, we aim to answer the followingquestions:1) What is the economical advantage of application hostingsolutions based on the hybrid cloud computing model?2) What is the benefit on the base zone workload managementwith the intelligent workload factoring (IWF)scheme?3) What is the benefit on the trespassing zone resourcemanagement with the IWF scheme?4) What is the per<strong>for</strong>mance of the IWF scheme upon achanging data popularity distribution?For the first two questions, we rely on trace-driven simulationsto evaluate the hybrid cloud computing model in a largescalesystem setting. For the rest two questions, we rely ontestbed experiments to evaluate the IWF scheme in a dynamicworkload setting.A. Trace-driven simulations1) Yahoo! Video workload traces: We used the Yahoo!Video workload traces presented in [7], and it contains a totalof 32,064,496 video stream requests throughout the collectionperiod of 46 days. The hourly request arrival rates are shownin Figure 1.Hosting solutionlocal data centerfull cloud computinghybrid <strong>Cloud</strong> <strong>Computing</strong>Annual costrunning a 790-server DCUS$1.384 millionsUS$58.96K + running a 99-server DCTABLE IECONOMICAL COST COMPARISON OF THREE HOSTING SOLUTIONS2) Economical cost comparison: three hosting solutions:We compared three application hosting solutions to host themeasured Yahoo! Video stream load 3 :• Local data center solution. In this solution, a local datacenter is overprovsioned over the peak load in the measurement.• Full cloud computing solution. In this solution, a rentedplat<strong>for</strong>m on Amazon EC2 infrastructure is provisionedover the peak load in the measurement. The rent price isUS$0.10 per machine hour based on the current AmazonEC2 pricing policy [1].• Our hybrid cloud computing model based solution.Inthis solution, a local data center is overprovisioned overthe 95-percentile workload, and an Amazon EC2 basedplat<strong>for</strong>m is rented on demand <strong>for</strong> the top 5-percentileworkload.Table I shows the annual economical cost of the threesolutions when we repeated the 46-day workload through oneyear. For the presentation simplicity, we only include theserver cost even though there are many other cost factorssuch as bandwidth, storage, power, cooling, physical plant,and operations costs.As we can see, the local data center solution requiresthe running of a 790-server medium-sized infrastructure. Thefull cloud computing solution, seeming cheap on the 10-centunit price, results in a bill of millions of dollars simply <strong>for</strong>computing cost. Lastly, our hybrid cloud computing modeloffers an economical solution with a 99-server small-sizedlocal data center (af<strong>for</strong>dable even <strong>for</strong> most SMB customers)and an annual bill of only US$58.96K <strong>for</strong> handling sporadicload spikes.Cumulative Probability10.80.60.40.2Fig. 6.<strong>Workload</strong> Predictability Evaluation01e-04 0.001 0.01 0.1 1 10 100Prediction error = |est. - real|/realPrediction error with a simple heuristic on the base load3) <strong>Workload</strong> smoothing effect in the base zone: We definedthe load spikes as the top 5-percentile data points in termsof request rate in Figure 1. By removing them with theworkload factoring mechanism, we observed that the ratio ofthe maximum load to the average load was reduced to 1.84 inthe base zone, where overprovisioning over peak load became3 In all hosting solutions, we assume the capacity of a video streamingserver is 300 (i.e., supports 300 concurrent streaming threads).
Primergy7a reasonable choice. We also tried statistical techniques onthe short-term workload prediction in the base zone. Figure 6shows the CDF of the prediction error using a simple heuristic:it uses the arrival rate from last interval as the prediction ofthe following interval’s arrival rate, with an 30-minute intervallength. It turned out that 82% of the time the prediction hadan error no more than 10%; 90% of the time the predictionhad an error no more than 17%; There<strong>for</strong>e, simple statisticalprediction techniques with small margin factor on the predictedvalue could be reliable <strong>for</strong> dynamic provisioning in the basezone.B. Testbed experimentsstream clientslocal data centerFig. 7.IWFApache serverDarwin stream serversDarwin stream serversstorageAmazon AWS cloudstorageThe video streaming service testbed with a hybrid plat<strong>for</strong>m1) Testbed: We set up an application testbed which hostsYouTube-like video streaming service. The testbed consistsof two parts: a local data center and a plat<strong>for</strong>m set up atAmazon AWS infrastructure utilizing the EC2 and S3 services.In the local data center, 20 open source Darwin streamingservers [14] are provisioned all the time, while the streamingserver instances at Amazon EC2 are activated on demand.The IWF component was implemented as a load controller<strong>for</strong> the stream workload. When a client request <strong>for</strong> a video clipcomes into the testbed as a HTTP request, the Apache webserver parses the request and asks IWF <strong>for</strong> which stream server(either a local server or a remote server at Amazon EC2.) thevideo clip will be served; it then returns to the client witha dynamic HTML page which automatically starts the mediaplayer <strong>for</strong> video streaming at the client machine.The load controller also contains the implementation oftwo well-known load balancing algorithms [15]: the LeastConnections balancing algorithm <strong>for</strong> the local server farm andthe Round-Robin balancing algorithm <strong>for</strong> the server farm onAmazon <strong>Cloud</strong>.We developed a distributed workload generator based onopenRTSP [16] to generate real video streaming load. Dependingon the test scenarios, up to 20 machines were provisioned<strong>for</strong> client-side workload generation.2) Methodology: We evaluate the fast factoring algorithmby running experiments with synthetic load traces. In thetraces, we generated workload with a stable data popularitydistribution D 1 be<strong>for</strong>e time t, and then suddenly changed toanother distribution D 2 after t where D 2 is the sum of D 1and another distribution D 3 . We generated D 1 and D 3 withuni<strong>for</strong>m and Zipf distributions (different α values), and alsochanged the volume ratio of D 1 to D 3 with different numbers(1 : k, where 1 ≤ k ≤ 10). For the FastTopK algorithm, itsgoal is to decompose the aggregated workload D 2 into twoparts so that their volume ratio is the same as that of D 1 toD 3 and minimize the unique data items contained in the loadD 3D 1+D 3.part with the volumeWe compared IWF with 3 other workload factoring algorithms:• random: the random factoring algorithm decides with theD 3D 1+D 3probability a request will go to the load groupDwith the volume 3D 1+D 3.• Choke: the Choke factoring algorithm is based on theChoKe active queue management scheme [17]. WhileChoKe was originally proposed <strong>for</strong> approximating fairbandwidth allocation, it is a reasonable candidate <strong>for</strong>workload factoring when the optimization goal is minimizingthe unique data items in one part (dropping thepackets to the top popular IP destinations is similar tofinding the top popular data items).• RATE: the RATE factoring algorithm acts the same asIWF except that it uses the RATE scheme [18] to detectthe top-K data items.Fig. 8.Video Number10000100010010<strong>Workload</strong> <strong>Factoring</strong> Per<strong>for</strong>mance - video requested at remote DCTotal VideosUnique VideosRandom Choke RATE IWFSchemesIWF per<strong>for</strong>mance: D 1 - Zipf distribution, D 3 - uni<strong>for</strong>m distribution3) Results: We generated one load trace over a video libraryof 1600 unique video clips, which all have video bit rate of450Kb/s. D 1 is Zipf distribution with α = 1 and D 3 isuni<strong>for</strong>m distribution, and the volume ratio is 1 : 1. One dotat the coordinate (x, y) in the graph represents one streamrequest asking <strong>for</strong> video file y arrives at time x. The changingtime t = 100000 when a load on a few hot data items jumpedin. Figure 8 shows the factoring per<strong>for</strong>mance in terms of thenumber of unique data items contained in the load part withDthe volume 3D 1+D 3. When all factoring algorithms dispatchedthe same amount of requests into the trespassing zone, IWF
8outper<strong>for</strong>med the other three significantly in terms of uniquevideo files requested (two orders of magnitudes comparedto random dispatching); in the trespassing zone totally 5000streams were served on only 30 unique video clips.Video Number10000100010010<strong>Workload</strong> <strong>Factoring</strong> Per<strong>for</strong>mance - video requested at remote DCTotal VideosUnique VideosRandom Choke RATE FastTopKSchemesFig. 9. IWF per<strong>for</strong>mance: D 1 - uni<strong>for</strong>m distribution, D 3 - uni<strong>for</strong>mdistributionIn Figure 9 we used another trace where both D 1 and D 3 areuni<strong>for</strong>m distributions, and the volume ratio is 1 : 1. In this caseIWF’s per<strong>for</strong>mance still outper<strong>for</strong>med the other three schemes;actually, it was quite close to the optimal per<strong>for</strong>mance (21 vs10) in terms of unique video clips requested.Fig. 10.Client-side perceived Quality1201008060402000 20 40 60 80 100 120 140 160Concurrent stream connectionsbase zone servertrespassing zone serverIWF per<strong>for</strong>mance: client-side perceived stream quality at two zonesFigure 10 shows the client-side perceived stream qualityfrom a base zone server and a trespassing zone server in theabove workload factoring experiment. For fair comparison,in this case both servers have the same hardware/softwareconfiguration and reside in the local testbed. The client-sideperceived stream quality is a metric reported by the DarwinStream server itself; it has a score between 0 and 100 to mainlyreflect the packet loss ratio during the streaming process. Wesee when the concurrent connections went up, the trespassingzone server delivered more reliable streaming quality than thebase zone server. It could support up to 160 concurrent streamconnections while keeping the client-side quality at above 80,while the base load zone server could only support around 90concurrent stream connections to keep the client-sided qualitysteadily at above 80. In the testbed configuration, we set thebase zone server capacity at 90 concurrent connections andthat <strong>for</strong> trespassing zone servers at 160 (78% higher than thatin the base zone), and en<strong>for</strong>ce it during dispatching.VI. RELATED WORKIn November 2008, Amazon launches <strong>Cloud</strong>Front [19] <strong>for</strong>its AWS customers who can now deliver part or all applicationload through Amazon’s global network; around the same timeperiod VMWare also proposed in its Virtual Data CenterOperation System blueprint the v<strong>Cloud</strong> service concept [20],which helps enterprise customers expand their internal ITinfrastructure into an internal cloud model or leverage offpremisecomputing capacity. When current IT systems evolvefrom the dedicated plat<strong>for</strong>m model to the shared plat<strong>for</strong>mmodel along the cloud computing trend, we believe a coretechnology component in need is on flexible workload managementworking <strong>for</strong> both models, and our workload factoringtechnology is proposed as one answer <strong>for</strong> it.Berkeley researchers [21] offer a ranked list of obstacles tothe growth of <strong>Cloud</strong> <strong>Computing</strong>. Similar to the points we madein the introduction, the concerns on public cloud computingservices include service availability, data confidentiality andauditability, per<strong>for</strong>mance unpredictability, and so on. Whilesome concerns could be addressed technically, some are dueto physical limitations naturally. On the service architecturelevel, we believe a hybrid cloud computing model makes senseto enterprise IT and can eliminate (or significantly alleviate)many issues raised from a full <strong>Cloud</strong> <strong>Computing</strong> model.In Content Distributed Network (CDN) and web cachingworkload factoring happen between a primary web server andproxy servers. The typical method is DNS redirecting and theworkload factoring decision is predefined manually over a setof “hot” web objects. Automatic solutions [22] [23] [24] exist<strong>for</strong> cache hit ratio improvement through locality exploration,and their focus is on compact data structure design to exchangedata item access in<strong>for</strong>mation.For fast frequent data item detection in data streams, manyschemes have proposed <strong>for</strong> fast rate estimation in trafficmonitoring [18] [25] [26], and fast data item counting inCDN [27]; their focus is on compact data structure design tomemorize request historical in<strong>for</strong>mation at a static distribution.VII. CONCLUSIONS & FUTURE WORKIn this paper, we present the design of a hybrid cloudcomputing model. With the proposed workload factoring technology,the hybrid cloud computing model allows enterpriseIT systems to adopt a hybrid cloud computing model where adedicated resource plat<strong>for</strong>m runs <strong>for</strong> hosting application baseloads, and a separate and shared resource plat<strong>for</strong>m servestrespassing peak load. Given the elastic nature of the cloudinfrastructure, It create a situation where cloud resources areused as an extension of existing infrastructure. It’s not an all ornothing decision; companies can ease into the cloud withoutabandoning established infrastructure and applications.For the future work, extending the hybrid cloud computingmodel to stateful applications such as n-tier web servicesis a natural and challenging step. Many new problems arisesuch as session maintenance, service time estimation, and dataconsistency. We are working on a fast data on demand service
9and integrating the dynamic web service scaling approachproposed in [28] into our mechanism.REFERENCES[1] “Amazon web services,” http://aws.amazon.com/.[2] “Google app engine,” http://code.google.com/appengine/.[3] C. Goolsbee, “Don’t buy cloud computing hype: Business model willevaporate,” in www.searchdatacenter.com, 2008.[4] “Massive (500) Internal Server Error.outage started 35 minutes ago,”Feburary 2008. [Online]. Available: http://developer.amazonwebservices.com/connect/message.jspa?messageID=7%9978#79978[5] “Youtube,” http://www.youtube.com.[6] “Gigaspaces,” http://www.gigaspaces.com.[7] X. Kang, H. Zhang, G. Jiang, H. Chen, X. Meng, and K. Yoshihira,“Measurement, modeling, and analysis of internet video sharing siteworkload: A case study,” in ICWS ’08: Proceedings of the 2008 IEEEInternational Conference on Web Services. Washington, DC, USA:IEEE Computer Society, 2008, pp. 278–285.[8] “Yahoo! video,” http://video.yahoo.com.[9] “ComScore Video Metrix report: U.S. Viewers Watchedan Average of 3 Hours of Online Video in July,”http://www.comscore.com/press/release.asp?press=1678, July 2007.[Online]. Available: http://www.comscore.com/press/release.asp?press=1678[10] M. Harchol-Balter, M. E.Crovella, and C. D. Murta, “On choosing atask assignment policy <strong>for</strong> a distributed server system,” pp. 231 – 242,1998.[11] G. Karypis and V. Kumar, “Multilevel k-way hypergraph partitioning,”in DAC ’99: Proceedings of the 36th ACM/IEEE conference on Designautomation. New York, NY, USA: ACM, 1999, pp. 343–348.[12] H. Zhang, G. Jiang, K. Yoshihira, H. Chen, and A. Saxena, “<strong>Intelligent</strong>workload factoring <strong>for</strong> a hybrid cloud computing model,” NEC LabsAmerica Technical Report 2009-L036, Feb 2009.[13] F. Hao, M. S. Kodialam, T. V. Lakshman, and H. Z. 0002, “Fast,memory-efficient traffic estimation by coincidence counting,” in INFO-COM, 2005, pp. 2080–2090.[14] “Darwin streaming server,” http://developer.apple.com/darwin/projects/streaming/.[15] M. Arregoces and M. Portolani, Data Center Fundamentals. CiscoPress, 2003.[16] “openrtsp,” http://www.live555.com/openRTSP/.[17] R. Pan, B. Prabhakar, and K. Psounis, “Choke - a statelessactive queue management scheme <strong>for</strong> approximating fair bandwidthallocation,” in INFOCOM 2000. Nineteenth Annual Joint Conferenceof the IEEE Computer and Communications Societies. Proceedings.IEEE, vol. 2, 2000, pp. 942–951 vol.2. [Online]. Available:http://dx.doi.org/10.1109/INFCOM.2000.832269[18] F. Hao, M. Kodialam, T. V. Lakshman, and H. Zhang, “Fast payloadbasedflow estimation <strong>for</strong> traffic monitoring and network security,” inANCS ’05: Proceedings of the 2005 ACM symposium on Architecture<strong>for</strong> networking and communications systems. New York, NY, USA:ACM, 2005, pp. 211–220.[19] “Amazon,” http://aws.amazon.com/cloudfront/.[20] “Vmware cloud vservices,” http://www.vmware.com/technology/virtualdatacenter-os/cloud-vservices/.[21] M. Armbrust, A. Fox, R. Griffith, A. D. Joseph, R. H. Katz,A. Konwinski, G. Lee, D. A. Patterson, A. Rabkin, I. Stoica,and M. Zaharia, “Above the clouds: A berkeley view of cloudcomputing,” EECS Department, University of Cali<strong>for</strong>nia, Berkeley,Tech. Rep. UCB/EECS-2009-28, Feb 2009. [Online]. Available:http://www.eecs.berkeley.edu/Pubs/TechRpts/2009/EECS-2009-28.html[22] E. Casalicchio, V. Cardellini, and M. Colajanni, “Content-aware dispatchingalgorithms <strong>for</strong> cluster-based web servers,” Cluster <strong>Computing</strong>,vol. 5, no. 1, pp. 65–74, 2002.[23] S. Jin and A. Bestavros, “Greedydual* web caching algorithm: Exploitingthe two sources of temporal locality in web request streams,” in InProceedings of the 5th International Web Caching and Content DeliveryWorkshop, 2000, pp. 174–183.[24] A. Wolman, M. Voelker, N. Sharma, N. Cardwell, A. Karlin, and H. M.Levy, “On the scale and per<strong>for</strong>mance of cooperative web proxy caching,”SIGOPS Oper. Syst. Rev., vol. 33, no. 5, pp. 16–31, 1999.[25] A. Kumar, M. Sung, J. Xu, and J. Wang, “Data streaming algorithms<strong>for</strong> efficient and accurate estimation of flow distribution,” in Proc. ofACM SIGMETRICS, Jun. 2004, to appear.[26] N. G. Duffield and M. Grossglauser, “Trajectory sampling <strong>for</strong> directtraffic observation,” SIGCOMM Comput. Commun. Rev., vol. 30, no. 4,pp. 271–282, 2000.[27] A. Manjhi, V. Shkapenyuk, K. Dhamdhere, and C. Olston, “Finding(recently) frequent items in distributed data streams,” in ICDE ’05:Proceedings of the 21st International Conference on Data Engineering.Washington, DC, USA: IEEE Computer Society, 2005, pp. 767–778.[28] L. Gao, M. Dahlin, A. Nayate, J. Zheng, and A. Iyengar, “Applicationspecific data replication <strong>for</strong> edge services,” in Proceedings of the 2003International World Wide Web ¡B¿Best Student Paper Award¡/B¿, May2003.