Changes in soil bacterial community profiles associated with ...
Changes in soil bacterial community profiles associated with ...
Changes in soil bacterial community profiles associated with ...

You also want an ePaper? Increase the reach of your titles
YUMPU automatically turns print PDFs into web optimized ePapers that Google loves.
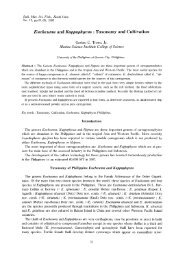
40Ryoichi DOI, Pongsak SAHUNALU, Chongrak WACHRINRAT, Sakhan TEEJUNTUK and Katsutoshi SAKURAI<strong>community</strong> <strong>profiles</strong>. Thus, the primary objective of this research was the determ<strong>in</strong>ation of a degradation gradient as a resultof the elim<strong>in</strong>ation of the tropical forest by multivariate profil<strong>in</strong>g of <strong>soil</strong> <strong>bacterial</strong> communities us<strong>in</strong>g antibiotics and carbonsources.The orig<strong>in</strong>al vegetative type of the Sakaerat Environmental Research Station (SERS), Thailand is dry evergreen forest(DEF), but there are other vegetative types reflect<strong>in</strong>g anthropologic degradation (Kaeoniam et al., 1976). Bare ground (BG)is the most degraded status <strong>in</strong> the SERS (Doi & Sakurai, 2003). Compositional data sets on <strong>soil</strong> <strong>bacterial</strong> communities wereobta<strong>in</strong>ed for DEF and BG <strong>soil</strong>s. The multivariate profil<strong>in</strong>g methods, the antibiotic resistance MPN method (method 1), theantibiotic disk diffusion method (method 2) and the Biolog method (Garland & Mills, 1991) were applied. To <strong>in</strong>vestigate thepossible utilization of the <strong>in</strong>formation given by the above profil<strong>in</strong>g methods, the compositional data sets were analyzed bypr<strong>in</strong>cipal component analysis, Wilk’s lambda determ<strong>in</strong>ation and redundancy analysis.MATERIALS AND METHODSSite descriptionThe Sakaerat Environmental Research Station (SERS), Wang Nam Kiao district, Nakhon Ratchasima (14°30’N, 101°55E)was established <strong>in</strong> 1967. At the time of establishment, some parts of the area had already been disturbed and deforested byhuman activities (Kaeoniam et al., 1976).The area is 7,808 hectares, and the altitude ranges from 250 to 762 m above sea level. The <strong>soil</strong> is classified as an Ultisolaccord<strong>in</strong>g to the USDA scheme (USDA Soil Conservation Service, 1975). The major vegetative types <strong>in</strong>clude dry evergreenforest (DEF), dry deciduous forest (DDF) and plantation plots, and others, such as bare ground (BG) and grassland. Thesevegetative types form a mosaic as shown <strong>in</strong> Fig. 1 (Kaeoniam et al., 1976). The climate is classified as Aw accord<strong>in</strong>g to theKöppen classification (Köppen, 1931). The annual precipitation is 1,260 mm and the average temperature is 26°C(Bunyavejchew<strong>in</strong>, 1986). Approximately, the dry season starts <strong>in</strong> November and ends <strong>in</strong> late April. The site receives most ofthe annual precipitation dur<strong>in</strong>g the ra<strong>in</strong>y season, approximately May to October.Soil sampl<strong>in</strong>g was done at the DEF and the BG. The DEF is primarily dom<strong>in</strong>ated by Hopea ferrea and Shorea spp. thatform the upper story, 20 to 40 m above ground. A typical DEF fosters more than 1,000 trees (trunk diameter at breastheight, DBH>5 cm) ha -1 , and the total basal area at 1.3 m height exceeds 30 m 2 ha -1 and the above ground biomass is over 200tons ha -1 (Kanzaki et al., 1995). The BG, hav<strong>in</strong>g no vegetation as a result of the past deforestation and subsequent humanactivities, is also scattered <strong>in</strong> the plot <strong>in</strong> a mosaic configuration.Fig1Vegetative typeDDF105ºE 110ºEDEFDDF and DEF20ºNPlantationThailandBangkok15ºNN11SERS22OthersSampl<strong>in</strong>g po<strong>in</strong>tsBGDEF5 kmFig. 1. Map of the Sakaerat Environmental Research Station and the sampl<strong>in</strong>g po<strong>in</strong>ts. DEF, DDF and BG<strong>in</strong>dicate dry evergreen forest, dry deciduous forest and bare ground, respectively. The triangle anddiamond <strong>in</strong>dicate sampl<strong>in</strong>g po<strong>in</strong>ts at the DEF and the BG, respectively. The figures <strong>in</strong> the symbolsare replication numbers.
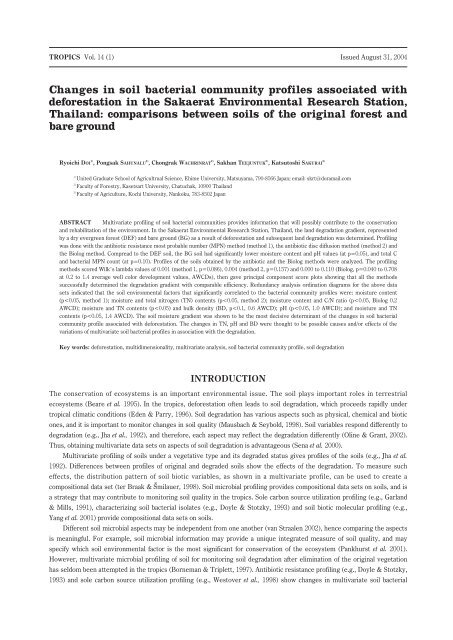
Soil <strong>bacterial</strong> communities reflect<strong>in</strong>g land degradation43where ABSit is the absorbance at 405 nm for the i-th carbon source at the time (t) and ABSct is the absorbance for thecontrol well, not <strong>in</strong>clud<strong>in</strong>g any carbon sources, at the time (t). This resulted <strong>in</strong> some negative values, which were regardedas 0 <strong>in</strong> the follow<strong>in</strong>g computation. The <strong>in</strong>crease <strong>in</strong> AWCD after this process was less than 2% of the AWCD for the sample.L<strong>in</strong>dstrom et al. (1998) po<strong>in</strong>ted out that rapidly and slowly metabolized carbon sources may contribute differently todiscrim<strong>in</strong>ation of <strong>soil</strong> microbial communities. Depend<strong>in</strong>g on AWCDs, such differential rates of utilization might result <strong>in</strong>success or failure <strong>in</strong> <strong>soil</strong> discrim<strong>in</strong>ation. To <strong>in</strong>vestigate this possibility, data sets on AWCD values of 0.2, 0.6, 1.0 and 1.4were statistically analyzed. Under our experimental conditions, the AWCD for each of the samples exceeded 1.5 after 80hours of the <strong>in</strong>cubation period, and started to converge. Therefore, the above AWCD values represented stages of colordevelopment.Data analysesThe one-way ANOVA to test the significance of deforestation on each <strong>soil</strong> characteristic and PCA to elucidate patterns ofvariation <strong>in</strong> <strong>soil</strong> <strong>bacterial</strong> <strong>profiles</strong> were performed us<strong>in</strong>g the computer software, SPSS 10.0.5J (SPSS Japan Inc., Tokyo). Tocompare the discrim<strong>in</strong>atory power of the profil<strong>in</strong>g methods, Wilk’s lambda statistic and its significance were determ<strong>in</strong>ed <strong>with</strong>the SPSS software. Wilk’s lambda is the most widely used statistic <strong>in</strong> determ<strong>in</strong><strong>in</strong>g the difference between multivariate datasets (Zar, 1999). If the means among compared groups for each variable are equal, Wilk’s lambda becomes 1. The moredifferent the data sets are, the closer Wilk’s lambda converges to 0.Redundancy analysis (RDA) and summariz<strong>in</strong>g the result as an RDA ord<strong>in</strong>ation diagram were performed us<strong>in</strong>g CANOCOfor W<strong>in</strong>dows 4.02 and CanoDraw 3.10 (Microcomputer Power, NY), respectively. RDA is a multivariate statistical techniqueto relate species distribution patterns and environmental factors <strong>in</strong> decreased dimensionality. Hence, this k<strong>in</strong>d of statisticaltechnique is categorized as the direct gradient analysis. RDA specifies statistically more or less significant environmentalfactors as gradients <strong>in</strong> relation to a species distribution pattern. RDA detects l<strong>in</strong>ear species distribution patterns aga<strong>in</strong>stsignificant environmental gradients (ter Braak & milauer, 1998). The significant environmental gradients are shown asvectors from the orig<strong>in</strong> of the ord<strong>in</strong>ation diagram. Thus, significant environmental gradients and some <strong>bacterial</strong> variableshave l<strong>in</strong>ear correlations. In the same diagram, the <strong>soil</strong> samples are located accord<strong>in</strong>g to their scores on the ord<strong>in</strong>ation axes.Regard<strong>in</strong>g each <strong>soil</strong> variable as the abundance of a species, RDA can be applied to analysis of distribution patterns of <strong>soil</strong><strong>in</strong>organic molecules (Odeh et al. 1991), sole carbon source utilization (Pankhurst et al. 2001) or <strong>soil</strong> biotic molecules(Blackwood et al. 2003). To determ<strong>in</strong>e the significance of the <strong>soil</strong> environmental factors, a Monte Carlo permutation test wasdone at 199 random permutations. Another Monte Carlo permutation test was done to exam<strong>in</strong>e the significance of extractedord<strong>in</strong>ation axes at 199 random permutations. In RDA, <strong>soil</strong> physico-chemical characteristics <strong>in</strong> Table 1 were designated as theenvironmental factors.RESULTSSoil characteristicsThe DEF and the BG <strong>soil</strong>s were easily dist<strong>in</strong>guished by color. The DEF <strong>soil</strong> was dull yellow brown (10YR 5/3), while the BG<strong>soil</strong> was reddish brown (5YR 4/8). The properties of the <strong>soil</strong>s are summarized <strong>in</strong> Table 1. Accord<strong>in</strong>g to the ANOVA, <strong>soil</strong>moisture content and pH significantly reflected the effects of deforestation at p=0.05. Deforestation was a marg<strong>in</strong>allysignificant source of variation of TC and MPN counts (0.05 < p < 0.10), and a less significant one of BD and TN (0.10 < p
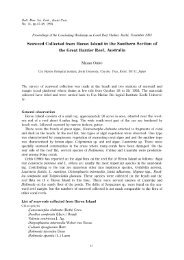
44 Ryoichi DOI, Pongsak SAHUNALU, Chongrak WACHRINRAT, Sakhan TEEJUNTUK and Katsutoshi SAKURAITable 1. Soil characteristicsVegetativetypeReplicatesMoisture Bulk densitycontent (%) (kg L -1 )pHEC(dS m -1 )Total C(g kg -1 dry <strong>soil</strong>)Total N(g kg -1 dry <strong>soil</strong>)C/NExch H(m eq kg -1 dry <strong>soil</strong>)Exch Al(m eq kg -1 dry <strong>soil</strong>)SoicolorMPN count (x 10 8 g -1 fresh <strong>soil</strong>)Dry evergreenforest1225.221.90.851.096.205.8210.646.8335.421.63.832.239.249.693.421.570.000.00Dull yellowbrown4.834.80Bare ground1214.011.81.571.305.055.122.274.067.857.580.840.689.3511.25.502.7714.01.03Reddishbrown3.302.18ANOVA0.0330.1240.0410.1180.0950.1060.4880.4250.3660.066: The MPN counts for the basal medium hav<strong>in</strong>g no antibiotics are <strong>in</strong>dicated.: The one-way ANOVA was performed hypothesiz<strong>in</strong>g vegetative type to be the significant source of variation. The p value for each <strong>soil</strong> characteristic is <strong>in</strong>dicated.AntibioticAmpicill<strong>in</strong>ChloramphenicolDapsonErythromyc<strong>in</strong>Kanamyc<strong>in</strong> sulfateLasalocidNafcill<strong>in</strong>Nalidixic acidNeomyc<strong>in</strong>∙HClNovobioc<strong>in</strong>Penicill<strong>in</strong> GSpect<strong>in</strong>omyc<strong>in</strong>∙2HClStreptomyc<strong>in</strong> sulfateSulfamethoxazoleTetracycl<strong>in</strong>eTrimethoprimBare ground 1Bare ground 2AntibioticAmpicill<strong>in</strong>ChloramphenicolDapsonErythromyc<strong>in</strong>Kanamyc<strong>in</strong> sulfateLasalocidNafcill<strong>in</strong>Nadixic acidNeomyc<strong>in</strong>∙HClNovobioc<strong>in</strong>Penicill<strong>in</strong> GSpect<strong>in</strong>omyc<strong>in</strong>∙2HClStreptomyc<strong>in</strong> sulfateSulfamethoxazoleTetracycl<strong>in</strong>eTrimethoprimDry evergreenforest 1Dry evergreenforest 20 0.2 0.4 0.6 0 0.2 0.4 0.6Relative abundance ofresistant <strong>bacterial</strong> cellsRelative abundance ofresistant <strong>bacterial</strong> cellsFig. 2. Profiles of the <strong>soil</strong> samples based on most probable numbers of resistant bacteria to the antibiotics.The error bars <strong>in</strong>dicate standard deviations (n=3). The horizontal axes <strong>in</strong>dicate the relative abundanceof the bacteria resistant to each antibiotic determ<strong>in</strong>ed by the log-ratio transformation (see text).
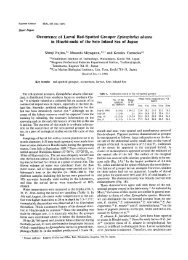
Soil <strong>bacterial</strong> communities reflect<strong>in</strong>g land degradation45AntibioticAmpicill<strong>in</strong>ChloramphenicolDapsonErythromyc<strong>in</strong>Kanamyc<strong>in</strong> sulfateLasalocidNafcill<strong>in</strong>Nalidixic acidNeomyc<strong>in</strong>∙HClNovobioc<strong>in</strong>Penicill<strong>in</strong> GSpect<strong>in</strong>omyc<strong>in</strong>∙2HClStreptomyc<strong>in</strong> sulfateSulfamethoxazoleTetracycl<strong>in</strong>eTrimethoprimMixture 1Mixture 2Bare ground 1Bare ground 2AntibioticAmpicill<strong>in</strong>ChloramphenicolDapsonErythromyc<strong>in</strong>Kanamyc<strong>in</strong> sulfateLasalocidNafcill<strong>in</strong>Nadixic acidNeomyc<strong>in</strong>∙HClNovobioc<strong>in</strong>Penicill<strong>in</strong> GSpect<strong>in</strong>omyc<strong>in</strong>∙2HClStreptomyc<strong>in</strong> sulfateSulfamethoxazoleTetracycl<strong>in</strong>eTrimethoprimMixture 1Mixture 2Dry evergreenforest 10 0.1 0.2 0 0.1 0.2Relative susceptibilityDry evergreenforest 2Relative susceptibilityFig. 3. Profiles of the <strong>soil</strong> samples based on susceptibility of the <strong>soil</strong> <strong>bacterial</strong> communities to theantibiotics. The error bars <strong>in</strong>dicate standard deviations (n=3). The horizontal axes <strong>in</strong>dicatethe relative susceptibility of the <strong>bacterial</strong> <strong>community</strong> to each antibiotic determ<strong>in</strong>ed by the ratiotransformation (see text).than that from DEF 2.Susceptibility patterns of the <strong>bacterial</strong> communities also reflected effects of deforestation (Fig. 3). The <strong>bacterial</strong><strong>community</strong> <strong>in</strong> the BG <strong>soil</strong> had high susceptibility to novobioc<strong>in</strong>, penicill<strong>in</strong>, spect<strong>in</strong>omyc<strong>in</strong>, streptomyc<strong>in</strong>, sulfamethoxazole,tetracycl<strong>in</strong>e and tetracycl<strong>in</strong>e-trimethoprim mixture (mixture 2). The DEF <strong>bacterial</strong> <strong>community</strong> showed high susceptibility topenicill<strong>in</strong>, sulfamethoxazole and the two mixtures. The DEF <strong>soil</strong> samples suggested differences <strong>in</strong> <strong>bacterial</strong> <strong>community</strong>susceptibility patterns between them: the DEF 1 sample had high susceptibility to dapson, while the DEF 2 sample tonovobioc<strong>in</strong> and streptomyc<strong>in</strong>.Fig2,3PCAMethod 1 discrim<strong>in</strong>ated between the sample groups as shown <strong>in</strong> Fig. 4a. The first and second PCs expla<strong>in</strong>ed more than halfof the variation; 44 and 13%, respectively. The sample groups were separated by the first PC axis. The second PC axis didnot separate the sampl<strong>in</strong>g po<strong>in</strong>ts under each of the vegetative types.Method 2 also discrim<strong>in</strong>ated between the <strong>soil</strong> sample groups (Fig. 4b). The first and second PCs expla<strong>in</strong>ed 30 and 19%
46 Ryoichi DOI, Pongsak SAHUNALU, Chongrak WACHRINRAT, Sakhan TEEJUNTUK and Katsutoshi SAKURAIPC2(13%)(a)3210-2 -1-10 1 2-2PC1(44%)PC2(11%)(d)3210-2 -1 0 1 2-1-2PC1(40%)PC2(19%)(b)3210-2 -1 0 1 2-1-2PC1(30%)PC2(12%)(e)3210-2 -1 0-11 2-2PC1(33%)PC2(11%)(c)3210-2 -1 0 1 2-1PC2(10%)(f)3210-2 -1 0-11 2-2PC1(43%)-2PC1(40%)Fig. 4. Pr<strong>in</strong>cipal component score plots for the methods and the AWCDs. The triangle and diamond<strong>in</strong>dicate DEF and BG, respectively. The solid and blank symbols <strong>in</strong>dicate replications 1 and 2,respectively. (See Fig. 1 for the locations.) The diagrams are based on: a, antibiotic resistanceMPN method; b, disk diffusion method; c, 0.2 AWCD (Biolog); d, 0.6 AWCD; e, 1.0 AWCD; f,1.4 AWCD.Table 2. Comparison of discrim<strong>in</strong>atory power of the tested profil<strong>in</strong>g methodsMethodAntibiotic resistance MPN (Method 1)Disk diffusion (Method 2)Biolog*Average well color developmentCondition Wilk’s lambda Significance0.2 AWCD*0.6 AWCD1.0 AWCD1.4 AWCD0.0010.0040.0010.0000.1100.0030.0860.1570.0780.0400.7080.134
Soil <strong>bacterial</strong> communities reflect<strong>in</strong>g land degradation471.0(a)11.0(d)Axis 2( =0.074)Moisture122Axis 2( =0.072)BD2112TNMoisture-1.0-1.0 1.0Axis 1( =0.401)-1.0-1.0 1.0Axis 1( =0.540)1.0(b)1.0(e)12Axis 2( =0.046)MoistureTN212Axis 2( =0.085)121pH-1.0-1.0 1.0Axis 1( =0.675)-1.0-1.0 1.0Axis 1( =0.369)1.0(c)C/N21.0(f)1TNAxis 2( =0.078)21MoistureAxis 2( =0.068)12Moisture12-1.0-1.0 1.0Axis 1( =0.590)-1.0-1.0 1.0Axis 1( =0.411)Fig. 5. RDA ord<strong>in</strong>ation diagrams for the methods and the AWCDs. The triangle and the diamond <strong>in</strong>dicateDEF and BG, respectively. The figures <strong>in</strong> the symbols are replication numbers, correpond<strong>in</strong>g tothat <strong>in</strong> Fig. 1. The solid and broken arrows <strong>in</strong>dicate significant environmental gradients at p=0.05and 0.10, respectively. The diagrams are based on: a, antibiotic resistance MPN method; b, diskdiffusion method; c, 0.2 AWCD (Biolog); d, 0.6 AWCD; e, 1.0 AWCD; f, 1.4 AWCD.
48Ryoichi DOI, Pongsak SAHUNALU, Chongrak WACHRINRAT, Sakhan TEEJUNTUK and Katsutoshi SAKURAIof the variation, respectively. The sample groups were differentiated by the first PC axis. The second PC axis separated theBG sampl<strong>in</strong>g po<strong>in</strong>ts <strong>in</strong> the ord<strong>in</strong>ation space. On the other hand, an ambiguous separation was seen for the DEF replicates.Load<strong>in</strong>gs on the first axis for mixtures 1 and 2 were -0.938 and -0.865, while that for streptomyc<strong>in</strong>, sulfamethoxazole,tetracycl<strong>in</strong>e and trimethoprim were 0.703, -0.376, 0.918 and 0.670. The data did not support the hypothesis that the averageof the load<strong>in</strong>gs for the mixed antibiotics nearly equals the load<strong>in</strong>g for the mixture.At all the AWCD values <strong>in</strong> the Biolog method, the first and second PCs expla<strong>in</strong>ed around 50% of the variation. In all ofthe PC score plots (Fig. 4c, d, e, f), the <strong>soil</strong> sample groups from the BG and the DEF were separated by the first PC axes.The replicates for each vegetative type tended to be separated by the second PC axis until the AWCD value reached to 1.0,but the separation became ambiguous when the AWCD values reached to 1.4.Fig4,Table2Wilk’s lambda statisticThe antibiotic methods (methods 1 and 2) showed discrim<strong>in</strong>atory power comparable to that of the Biolog method, scor<strong>in</strong>glow values of Wilk’s lambda (Table 2). The discrim<strong>in</strong>atory power of the Biolog method decreased once dur<strong>in</strong>g the colordevelopment, but was restored dur<strong>in</strong>g the convergence stage.RDA ord<strong>in</strong>ation diagramsRDA ord<strong>in</strong>ation diagrams <strong>in</strong> Fig. 5 <strong>in</strong>dicate relationships between the <strong>bacterial</strong> <strong>profiles</strong> and the <strong>soil</strong> environmental factors.Only the significant environmental factors at p=0.05 and p=0.1 are shown, as solid and broken arrows, respectively. Nomulti-col<strong>in</strong>earity was detected among the environmental factors. All the pairs of axes were significant at p=0.01 accord<strong>in</strong>g tothe Monte Carlo permutation test. Method 1 resulted <strong>in</strong> Fig. 5a, <strong>in</strong>dicat<strong>in</strong>g that <strong>soil</strong> moisture content is the most significant<strong>soil</strong> environmental factor related to the MPN <strong>profiles</strong>. The DEF <strong>soil</strong> was expla<strong>in</strong>ed by its relatively high moisture content.Eigenvalues for the first and second axes were 0.401 and 0.074, respectively. Method 2 gave another pattern of RDAord<strong>in</strong>ation. Us<strong>in</strong>g method 2, <strong>soil</strong> moisture content and TN were specified to be the significant environmental factors relatedto the <strong>soil</strong> <strong>bacterial</strong> <strong>profiles</strong> (Fig. 5b). Two replicates of the BG <strong>soil</strong> were located far from each other, and the replicates ofthe DEF <strong>soil</strong> were also. Eigenvalues for the first and second axes were 0.675 and 0.046.Fig5Diagrams given by the Biolog method differed among the AWCD values. At an AWCD of 0.2, <strong>soil</strong> moisture content andC/N were significant environmental factors related to the Biolog <strong>profiles</strong> of the <strong>bacterial</strong> communities (Fig. 5c). Eigenvaluesfor the first and second axes were 0.590 and 0.078, respectively. At an AWCD of 0.6, <strong>soil</strong> moisture and TN contents weresignificantly related to the <strong>profiles</strong> of the <strong>bacterial</strong> communities at p=0.05, and BD was a marg<strong>in</strong>ally significantenvironmental factor (0.05 < p < 0.10, Fig. 5d). Eigenvalues for the first and second RDA axes were 0.540 and 0.072,respectively. At an AWCD of 1.0, pH was the significant environmental factor related to the <strong>profiles</strong> at p=0.05 (Fig. 5e).Eigenvalues for the first RDA axis decreased to 0.369, and that for the second axis was 0.085. At an AWCD of 1.4, <strong>soil</strong>moisture and TN contents were significantly related to the <strong>bacterial</strong> <strong>community</strong> <strong>profiles</strong> (Fig. 5f). The eigenvalue for the firstRDA axis <strong>in</strong>creased to 0.411, and that for the second RDA axis was 0.068. The BG samples were far from each other <strong>in</strong> theord<strong>in</strong>ation diagram at an AWCD of 0.2 (Fig. 5c), and the distance gradually decreased as the color development proceeded,while the DEF samples showed the reverse trend.In each diagram, the degradation gradient was expla<strong>in</strong>ed by the first axis, which scored an eigenvalue at least 4 timeslarger than the second axis. This <strong>in</strong>dicates that deforestation was the most significant source of the variation of <strong>soil</strong> <strong>bacterial</strong><strong>community</strong> <strong>profiles</strong>. Soil moisture content, pH, TN and BD related to <strong>soil</strong> <strong>bacterial</strong> <strong>community</strong> <strong>profiles</strong>, reflect<strong>in</strong>g thedegradation gradient. For the data set <strong>with</strong> an AWCD of 0.2, the C/N ratio was a significant source of variation of <strong>soil</strong><strong>bacterial</strong> <strong>community</strong> <strong>profiles</strong>, not along <strong>with</strong> the degradation gradient (Table 1).DISCUSSIONAnthropologic land degradation may affect s<strong>in</strong>gle or multiple <strong>soil</strong> environmental factor(s). Heavy metal contam<strong>in</strong>ation isrelatively well documented as a s<strong>in</strong>gle primary cause of changes as reflected by antibiotic resistance <strong>profiles</strong> (e.g., Roane &Kellogg 1996), sole carbon source utilization <strong>profiles</strong> (e.g., Kelly & Tate 1998) or biotic molecular <strong>profiles</strong> (Frostegård et al.1993) of <strong>soil</strong> microbial communities. The <strong>soil</strong> degradation follow<strong>in</strong>g deforestation also <strong>in</strong>volves changes <strong>in</strong> multiple <strong>soil</strong>environmental factors (Table 1). Deforestation result<strong>in</strong>g <strong>in</strong> multiple <strong>soil</strong> environmental changes also resulted <strong>in</strong> changes <strong>in</strong><strong>bacterial</strong> population structure (Doi & Sakurai, 2003), pattern of sole carbon source utilization by <strong>soil</strong> microbes (Staddon et al.
Soil <strong>bacterial</strong> communities reflect<strong>in</strong>g land degradation491997) and microbial molecular distribution pattern (Borneman & Triperett, 1997). In these cases, the relationships betweenthe altered <strong>soil</strong> environmental factors and the changes <strong>in</strong> <strong>soil</strong> microbial <strong>profiles</strong> are complicated.It has been recognized that particular environmental changes alter the multivariate <strong>profiles</strong> of <strong>soil</strong> microbialcommunities. Some <strong>soil</strong> environmental changes <strong>in</strong>volved <strong>in</strong> deforestation and <strong>soil</strong> degradation are thought to stress liv<strong>in</strong>gth<strong>in</strong>gs (Giuffre et al. 2001; Sakurai et al. 1998). In the SERS, the drier condition <strong>in</strong> the BG <strong>soil</strong> was suggested to be the mostsignificant factor reduc<strong>in</strong>g number of <strong>bacterial</strong> cells (Table 1) and diversity of the <strong>soil</strong> <strong>bacterial</strong> <strong>community</strong> (Doi & Sakurai2003). The drier <strong>soil</strong> condition <strong>in</strong> the BG <strong>soil</strong> may make it hard for some <strong>soil</strong> bacteria to survive, while may not effect others(Kilbertus & Proth 1979). The difference <strong>in</strong> <strong>soil</strong> moisture content was likely to be the ma<strong>in</strong> <strong>soil</strong> environmental factordifferentiat<strong>in</strong>g the <strong>profiles</strong> (Fig. 5, Doi & Sakurai 2003).A selective force was perhaps a source of variation <strong>in</strong> the <strong>soil</strong> <strong>bacterial</strong> <strong>community</strong> profile <strong>in</strong> the SERS. The low numberof <strong>soil</strong> <strong>bacterial</strong> cells <strong>in</strong> the BG <strong>soil</strong> (Table 1) suggests the importance of a selective force. Another possibly important factoris the change <strong>in</strong>side of <strong>bacterial</strong> cells <strong>in</strong> response to environmental changes. Some environmental changes have been shownto alter <strong>bacterial</strong> phenotypes such as culturability (Arana et al. 1992) and antibiotic resistance (McInroy et al., 1996) andgenotypes such as carbon source utilization (Velkov, 1999) and antibiotic resistance (Pote et al. 2003). These possibly relatedmechanisms need to be <strong>in</strong>vestigated.Land degradation has various aspects (Mausbach & Seybold, 1998). It is thought to be worth analyz<strong>in</strong>g these differentaspects <strong>with</strong> a multivariate strategy (Sena et al., 2000). The aspects <strong>in</strong>vestigated <strong>in</strong> this research are thought to reflect<strong>in</strong>dependently <strong>in</strong>volved events <strong>in</strong> the degradation (Fig. 5). The resistance of bacteria to particular antibiotics was shown tohave l<strong>in</strong>kages to the possible environmental stresses <strong>in</strong> the BG <strong>soil</strong> such as acidity (Ramos et al. 1987) or high temperature(Pillai and Pepper, 1991). A difference <strong>in</strong> above ground vegetation resulted <strong>in</strong> a variation of sole carbon source utilizationpatterns revealed by characteriz<strong>in</strong>g the <strong>soil</strong> <strong>bacterial</strong> isolates (Westover et al., 1998). The sole carbon source utilizationprofile of <strong>bacterial</strong> isolates may be altered when the cell encounters particular environmental stresses (Velkov, 1999). Suchl<strong>in</strong>kages between environmental factors and cells are thought to occur <strong>in</strong>dependently <strong>in</strong> the degradation.The Biolog method profiled the <strong>bacterial</strong> communities based on the sole carbon source utilization patterns (Zak et al.,1994), while methods 1 and 2 measured the patterns of antibiotic resistance and susceptibility, respectively. Differentprofiled aspects have implied the multidimensionality of <strong>soil</strong> discrim<strong>in</strong>ation (Insam & Rangger, 1997). The discrim<strong>in</strong>ationpatterns shown <strong>in</strong> the PC score plots differed among the methods and the Biolog color development stages (Fig. 4),suggest<strong>in</strong>g multidimensionality. By reveal<strong>in</strong>g different ord<strong>in</strong>ation planes, Fig. 5 shows differences among the aspects <strong>in</strong>relation to the <strong>bacterial</strong> <strong>profiles</strong> and the environmental factors. RDA <strong>in</strong>tegrates environmental and biotic data sets, and then,directly relates the biotic <strong>profiles</strong> to the environmental factors. The computation found significant environmental factorsbased on variation of plant (e.g., Bubier, 1995; Hutto et al., 1999; Lyon & Sagers, 2002; Stohlgren & Bachand, 1997; Wali,1999) and other communities (e.g., Bird et al., 2000; Hemerik & Brassaard, 2002; van den Br<strong>in</strong>k et al., 1996) that reflectedvarious environmental changes.On the other hand, few <strong>soil</strong> microbial <strong>community</strong> <strong>profiles</strong> have been analyzed for this purpose (Bossio & Scow, 1995;Pankhurst et al., 2001). Soil microbial <strong>community</strong> profil<strong>in</strong>g may be less labor <strong>in</strong>tensive than plant species survey<strong>in</strong>g. Withrespect to conservation, rehabilitation or agricultural production, <strong>community</strong> profile analysis may suggest a favorablemanagement practice <strong>in</strong> the ord<strong>in</strong>ation diagram (Pankhurst et al., 2001). Furthermore, given pieces of <strong>in</strong>formation may differamong communities <strong>in</strong> the same space as shown by Hermerik & Brussaard (2002). Thus, profil<strong>in</strong>g <strong>soil</strong> microbialcommunities is another <strong>in</strong>formative alternative.The empirical approach adopted by Bossio & Scow (1995) could be powered by <strong>in</strong>vestigat<strong>in</strong>g possible cause and effectrelationships as po<strong>in</strong>ted out by Kourtev et al. (1998). Any of the significant <strong>soil</strong> environmental factors <strong>in</strong>dicated <strong>in</strong> Fig. 5 maybe the cause of the poor productivity of the BG <strong>soil</strong>, while the environmental changes summarized <strong>in</strong> Table 1 are results ofdeforestation. The altered Biolog profile of the BG <strong>soil</strong> likely reflected altered <strong>soil</strong> <strong>bacterial</strong> functions (Zak et al. 1994).Benefical <strong>soil</strong> bacteria are known to contribute to plant growth through m<strong>in</strong>eral solubilization (Derylo & Skorupska, 1992),nitrogen fixation (Albrecht et al. 1981), plant growth hormone production (Neitko & Frankenberg, 1989) and plant pathogensuppression (Handman et al. 1991). Investigat<strong>in</strong>g relationships among environmental changes, plant growth and the benefical<strong>soil</strong> <strong>bacterial</strong> functions will help us develop methods to rehabilitate degraded <strong>soil</strong>s.As described <strong>in</strong> a previous report (Doi & Sakurai, 2003), <strong>soil</strong> moisture content was thought to be the most decisiveenvironmental factor on the variation <strong>in</strong> <strong>soil</strong> <strong>bacterial</strong> <strong>community</strong> <strong>profiles</strong> (Fig. 5). Other <strong>soil</strong> environmental changes <strong>in</strong>volved<strong>in</strong> the degradation were also the possible causes and/or the effects of the changes <strong>in</strong> <strong>soil</strong> <strong>bacterial</strong> <strong>community</strong> <strong>profiles</strong>. The
50Ryoichi DOI, Pongsak SAHUNALU, Chongrak WACHRINRAT, Sakhan TEEJUNTUK and Katsutoshi SAKURAIchange <strong>in</strong> TN (Palmer & Young, 2000; Yang et al., 2001), pH (Flis et al. 1993) or BD (Li et al. 2002) may affect themultivariate <strong>soil</strong> microbial <strong>community</strong> profile. Some <strong>soil</strong> bacteria fix nitrogen (Albrecht et al. 1981), and others maycontribute to variations of <strong>soil</strong> pH, which leads to changes <strong>in</strong> other <strong>soil</strong> characteristics (Brown et al. 1994). BD is known to bealtered by macrofauna such as earthworms (Beare et al., 1995), while the contribution of microbes to the decrease <strong>in</strong> BD hasnot been shown. The altered <strong>soil</strong> <strong>bacterial</strong> <strong>community</strong> profile <strong>in</strong> BG is an effect of deforestation and degradation, and at thesame time, the changes <strong>in</strong> <strong>community</strong> structure (Fig. 2) and sole carbon source utilization patterns (Fig. 4c to f) may be thecause of the poor productivity of this <strong>soil</strong>.As the contrast between pH and TN shows (Fig. 5), <strong>soil</strong> microbial variables are not necessarily related to the <strong>soil</strong>environmental factors that most significantly reflect degradation, but may be related to ones that less significantly reflect<strong>in</strong>gthe impact (e.g., Jha et al. 1992). TC did not relate to <strong>soil</strong> <strong>bacterial</strong> <strong>community</strong> <strong>profiles</strong>, though deforestation comparablyaffected TC to TN (Table 1), which related to the <strong>profiles</strong>. While multiple <strong>soil</strong> biotic variables relate differently to the same<strong>soil</strong> environmental gradient (Jha et al. 1992), each <strong>soil</strong> biotic variable may relate differently to comparably significantenvironmental gradients (e.g., Donaldson & Henderson, 1990). Such complicated relationships lead to themultidimensionality of any gradient of our <strong>in</strong>terest (Ol<strong>in</strong>e & Grant, 2002). The difference <strong>in</strong> the relationship between thefirst RDA axis and the <strong>soil</strong> environmental factors aga<strong>in</strong> shows the multidimensionality as previously reported (Pankhurst etal. 2001; Hemerik & Brussaard, 2002). The ord<strong>in</strong>ation axes given by each method or AWCD value exist <strong>in</strong> the ord<strong>in</strong>ationspace <strong>in</strong> different locations (Fig. 5). The second RDA axis, derived from the data set on an AWCD of 0.2, as well as the firstRDA axis from that on an AWCD of 1.0, uniquely exits <strong>in</strong> the ord<strong>in</strong>ation space.In most cases, the criterion for the efficacy of a method for multivariate <strong>soil</strong> microbial profil<strong>in</strong>g was the separation of <strong>soil</strong>samples <strong>in</strong> the ord<strong>in</strong>ation diagram (e.g., Choi & Dobbs, 1999; Garland, 1996). In such a diagram, the most significantvariation is shown, while the residual variation is ignored. On the other hand, the Wilk’s lambda computation <strong>in</strong>volves all thevariation. The Biolog data set, at an AWCD of 1.0, apparently showed successful discrim<strong>in</strong>ation of the sample groups <strong>in</strong> thePC score plot (Fig. 4e), but the rest of the variation led to ambiguous discrim<strong>in</strong>ation accord<strong>in</strong>g to the Wilk’s lambda statistic(Table 2). M<strong>in</strong>or variation of a multivariate data set often gives useful <strong>in</strong>formation such as the <strong>in</strong>tegrated measure ofoccurrence of plant disease (Flancl, 1993) or above ground productivity (MacMillan, 1991). Thus, it is advantageous to f<strong>in</strong>dm<strong>in</strong>or variations, as well as the most significant ones. The low values of Wilk’s lambda show<strong>in</strong>g the high significance for theantibiotic methods <strong>in</strong>dicate that the aspects observed by these methods could f<strong>in</strong>d even m<strong>in</strong>or variations.Cultur<strong>in</strong>g techniques, as those used <strong>in</strong> this research, are sometimes criticized, because only a subset of <strong>soil</strong> <strong>bacterial</strong>population can be observed (Gray 1990). However, the subset has reflected <strong>soil</strong> environmental changes <strong>with</strong> patterns ofantibiotic resistance (Brønstad et al. 1996, Doyle & Stotzky 1993) and sole carbon source utilization (Insam & Rangger 1997).Thus, the subset provides <strong>in</strong>formation on how the communities respond to changes <strong>in</strong> their <strong>soil</strong> environments (Kennedy1994). A possibly more important limitation of the methods used <strong>in</strong> this research is that a portion of the <strong>bacterial</strong> <strong>community</strong>may contribute to plural variables. It will be worth compar<strong>in</strong>g the methods applied <strong>in</strong> this research <strong>with</strong> another that is freefrom this latent limitation (e.g. Fujie et al., 1998).The antibiotic methods are cost-effective and easy to perform, and the experimental conditions can be changed, e.g., bythe addition/substitution of antibiotics depend<strong>in</strong>g on availability. In this research, mixed antibiotics were shown to have arole different from the <strong>in</strong>dividual antibiotics <strong>in</strong> the profil<strong>in</strong>g and discrim<strong>in</strong>ation. Thus an additional variable, <strong>with</strong> an<strong>in</strong>dependent mean<strong>in</strong>g, may be obta<strong>in</strong>ed by mix<strong>in</strong>g antibiotics, allow<strong>in</strong>g the use of a smaller number of antibiotics. Thoughpreparation of the microtiter plate or the agar plate is more labor <strong>in</strong>tensive than the Biolog method, which uses the factorymadeproduct and gives several types of data (L<strong>in</strong>dstrom et al., 1998), the antibiotic methods do not need sophisticatedequipment, e.g., an ELISA plate reader which is a prerequisite for the Biolog method. Therefore, the antibiotic approach isan <strong>in</strong>expensive alternative for laboratories. Antibiotic resistance and/or susceptibility patterns of <strong>soil</strong> <strong>bacterial</strong> communitiesmay be directly l<strong>in</strong>ked to ecological conditions of the communities (Gottlieb, 1976; Stevenson, 1954). The Biolog methodprovided different RDA ord<strong>in</strong>ation planes and AWCD values. This <strong>in</strong>dicates that we should consider the mean<strong>in</strong>g of patternsof discrim<strong>in</strong>ation at some AWCD stages.ACKNOWLEDGEMENTS We thank the Sasakawa Scientific Research Grant from the Japan Science Society forf<strong>in</strong>ancial support. Mr. Pramuk Kaeoniam and other staff members of the SERS supported our activities. We gratefullyacknowledge their support.
Soil <strong>bacterial</strong> communities reflect<strong>in</strong>g land degradation51REFERENCESAcar, J. F. & Goldste<strong>in</strong>, F. W. 1996. Disk susceptibility test. In: Lorian, V. (ed.), Antibiotics <strong>in</strong> laboratory medic<strong>in</strong>e, 4th ed. pp.1-51. Williams and Wilk<strong>in</strong>s, Baltimore.Albrecht, S. L., Okon, Y., Lonnquist, J. & Burton, R. H. 1981. Nitrogen fixation by corn-Azospirillum association <strong>in</strong> atemperate climate. Crop Science 21: 301-306.Arana I, Muela A, Iriberri J, Egea L, Barc<strong>in</strong>a I, 1992. Role of hydrogen peroxide <strong>in</strong> loss of culturability mediated by visiblelight <strong>in</strong> Escherichia coli <strong>in</strong> a freshwater ecosystem. Applied and Environmental Microbiology 58: 3903-3907.Beare, M. H., Coleman, D. C., Crossley Jr., D. A., Hendrix, P. F. & Odum, E. P. 1995. A hierarchical approach to evaluat<strong>in</strong>gthe significance of <strong>soil</strong> biodivesity to biogeochemical cycl<strong>in</strong>g. Plant and Soil 170: 5-22.Bird, S. Coulson, R. N. & Crossley, Jr., D. A. 2000. Impacts of silvicultural practices on <strong>soil</strong> and litter arthropod diversity <strong>in</strong> aTexas p<strong>in</strong>e plantation. Forest Ecology and Management 131: 65-80.Blackwood, C. B., Marsh, T., Kim, S. H. & Paul, E. A., 2003. Term<strong>in</strong>al restriction fragment length polymorphism dataanalysis for quantitative comparison of microbial communities. Applied and Environmental Microbiology 69: 926-932.Borneman, J. & Triplett, E. W. 1997. Molecular microbial divesity <strong>in</strong> <strong>soil</strong>s from eastern Amasonia: evidence for unusualmicroorganisms and microbial population shifts <strong>associated</strong> <strong>with</strong> deforestation. Applied and Environmental Microbiology63: 2647-2653.Bossio, D. A. & Scow, K. M. 1995, Impact of carbon and flood<strong>in</strong>g on the metabolic diversity of microbial communities <strong>in</strong> <strong>soil</strong>s.Applied and Environmental Microbiology 61: 4043-4050.Brown, D. A., Choudari, D. K., Sawicki, J. A. and Beveridge, T. J. 1994. M<strong>in</strong>erals <strong>associated</strong> <strong>with</strong> biofilms occurr<strong>in</strong>g onexposed rock <strong>in</strong> a granitic underground research laboratory. Applied and Environmental Microbiology 60: 3182-3191.Brønstad, K., Drønen, K., Øvreås, L. & Torsvik, V. 1996. Phenotypic diversity and antibiotic resistance <strong>in</strong> <strong>soil</strong> <strong>bacterial</strong>communities. Journal of Industrial Microbiology 17: 253-259.Bubier, J. L. 1995. The relationship of vegetation to methane emission and hydrochemical gradients <strong>in</strong> northern peatlands.Journal of Ecology 83: 403-420.Bunyavejchew<strong>in</strong>, S. 1986. Ecological studies of tropical semi-evergreen ra<strong>in</strong> forest at Sakaerat, Nakhon Ratchasima,northeast Thailand, I vegetation patterns. Natural History Bullet<strong>in</strong> of Siam Society 34: 35-57.Choi, K-H. & Dobbs, F. C. 1999. Comparison of two k<strong>in</strong>ds of Biolog microplates (GN and ECO) <strong>in</strong> their ability to dist<strong>in</strong>guishamong aquatic microbial communities. Journal of Microbiological Methods 36: 203-213.Derylo, M. & Shorupska, A. 1992. Rhizobial siderophore as an iron source for clover. Physiologia Plantarum 85: 549-553.Doi, R. & Sakurai, K. 2002. Determ<strong>in</strong>ation of degradation gradient by profil<strong>in</strong>g <strong>soil</strong> <strong>bacterial</strong> communities <strong>in</strong> the SakaeratEnvironmental Research Station, Thailand. In Proc: 3rd International Symposium on Susta<strong>in</strong>able Agro-environmentalSystems: New Technologies and Applications. 26-29 Oct.Cairo.Doi, R. & Sakurai, K. 2003. Soil environmental factors relat<strong>in</strong>g to diversity of culturable <strong>soil</strong> <strong>bacterial</strong> communities <strong>in</strong> theSakaerat Environmental Research Station, Thailand. Tropics 12: 185-200.Donaldson, J. M. & Henderson, G. S. 1990. Nitrification potential of secondary-succession upland oak forests: I.m<strong>in</strong>eralization and nitrification dur<strong>in</strong>g laboratory <strong>in</strong>cubations. Soil Science Society of America Journal 54: 892-897.Doyle, J.D. & Stotzky, G. 1993. Methods for the detection of changes <strong>in</strong> the microbial ecology of <strong>soil</strong> caused by the<strong>in</strong>troduction of microorganisms. Microbial Releases 2: 63-72.Eden, M. J. & Parry, J. T. 1996. Land degradation <strong>in</strong> the tropics: environmental and policy issues. Global Development & theEnvironment series. P<strong>in</strong>ter, London, UKFlis, S. E., Glenn, A. R. & Dilworth, M. J. 1993. The <strong>in</strong>teraction between alm<strong>in</strong>ium and root nodule bacteria. Soil Biology andBiochemistry 25: 403-417.Francl, L. J. 1993. Multivariate analysis of selected edaphic factors and their relationship to Heterodera glyc<strong>in</strong>es populationdensity. Journal of Nematology 25: 270-276.Frostegård, Å., Tunlid, A & Bååth, E. 1993. Phospholipid fatty acid composition, biomass, and activity of microbialcomunities from two <strong>soil</strong> types experimentally exposed to different heavy metals. Applied and EnvironmentalMicrobiology 59: 3605-3617.Fujie, K., Hu, H.-Y., Tanaka, H., Urano, K., Saitou, K. & Katayama, A. 1998. Analysis of respiratory qu<strong>in</strong>ones <strong>in</strong> <strong>soil</strong> forcharacterization of microbiota. Soil Science and Plant Nutrition 44: 393-404.
52Ryoichi DOI, Pongsak SAHUNALU, Chongrak WACHRINRAT, Sakhan TEEJUNTUK and Katsutoshi SAKURAIGarland, J. L. 1996. Analytical approaches to the characterization of samples of microbial communities us<strong>in</strong>g patterns ofpotential C source utilization. Soil Biology and Biochemistry 28: 213-221.Garland, J. L. & Mills, A. L. 1991. Classification and characterization of heterotrophic microbial communities on the basis ofpatterns of <strong>community</strong>-level sole-carbon-source utilization. Applied and Environmental Microbiology 57: 2351-2359.Giuffre, L., Piccolo, G., Rosell, R., Pascale, C., Heredia, O. S. & Ciarlo, E. 2001. Anthropogenic effect on <strong>soil</strong> organicphosphorus fractions <strong>in</strong> tropical ecosystems. Communications <strong>in</strong> Soil Science and Plant Analysis 32: 1621-1628.Gottlieb, S. 1976. The production and role of antibiotics <strong>in</strong> <strong>soil</strong>. Journal of Antibiotics 29: 987-1000.Gray, T. R. G. 1990. Methods for study<strong>in</strong>g the microbial ecology of <strong>soil</strong>. Methods <strong>in</strong> Microbiology 22: 309-341.Handman, H. Weller, D. M. & Thomashow, L. S. 1991. Relative importance of fluorecent siderphores and other factors <strong>in</strong>biological control of Gaeumannomyces gram<strong>in</strong>is var. tritici by Pseudomonas fluorecens 2-79 and M4-80R. Applied andEnvironmental Microbiology 57: 3270-3277.Hemerik, L. & Brussaard, L. 2002. Diversity of <strong>soil</strong> macro-<strong>in</strong>vertebrates <strong>in</strong> grasslands under restoration succession.European Journal of Soil Biology 38: 145-150.Hutto, C. J., Shelburne, V. B. & Jones, S. M. 1999. Prelim<strong>in</strong>ary ecological land classification of the Chauga Ridges Region <strong>in</strong>South Carol<strong>in</strong>a. Forest Ecology and Management 114: 385-393.Insam, H. & Rangger, A. 1997. Microbial communities: functional versus structural approaches. Spr<strong>in</strong>ger Verlag, Berl<strong>in</strong>.Jha, D. K., Sharma, G. D. & Mishra, R. R. 1992. Soil microbial population numbers and enzyme activities <strong>in</strong> relation toaltitude and forest degradation. Soil Biology and Biochemistry 24: 761-767.Kaeoniam, P., Khoorat, P., Sunthornsan, W., Issareeya, M., Cherdchun, C. & Buachum, W. 1976. A study of illegaldeforestation <strong>in</strong> the reserved forest area at the Sakaerat Environmental Research Station. Environmental and EcologicalResearch Department, Applied Scientific Research Corporation of Thailand, Bangkok.Kanzaki, M., Yoda, K. & Dhanmanonda, K. 1995. Mosaic structure and tree growth pattern <strong>in</strong> a monodomoionant tropicalseasonal evergreen forest <strong>in</strong> Thailand. In Box, E.O., Peet, R.K., Masuzawa, T., Yamada, I., Fujiwara, K. & Maycosk,P.F. (eds.), Vegetation science <strong>in</strong> forestry. pp. 495-513. Kluwer Publishers, Netherlands.Kelly, J. J. & Tate, R. L. 1998. Effects of heavy metal contam<strong>in</strong>ation and remediation on <strong>soil</strong> microbial communities <strong>in</strong> thevic<strong>in</strong>ity of a z<strong>in</strong>c smelter. Journal of Environmental Quality 27: 609-617.Kennedy, A. C. 1994. Carbon utilization and fatty acid <strong>profiles</strong> for characterization of bacteria. In Weaver, R., Angle, J. S. &Bottomley, P. S. (eds). Methods of <strong>soil</strong> analysis part 2. Microbiological and chemical properties. American Society ofAgronomy, Madison, Wiscons<strong>in</strong>.Kilbertus, G. & Proth, J. 1979. Effets de la dessiccation dur les bacteries gram-negatives d’un sol. Soil Biology andBiochemistry 11: 109-114.Köppen, W. 1931. Grundriss der Klimakunde. De Druiter, Berl<strong>in</strong>.Kourtev, P., Ehrenfeld, J. G. & Huang, W. 1998. Effects of exotic plant species on <strong>soil</strong> properties <strong>in</strong> hardwood forests of NewJersy. Water Air and Soil Pollution 105: 493-501.Li, C. H., Ma, B. L., Zhang, T. Q. 2002. Soil bulk density effects on <strong>soil</strong> microbial populations and enzyme activities dur<strong>in</strong>gthe growth of maize (Zea mays L.) planted <strong>in</strong> large pots under field exposure. Canadian Journal of Soil Science 82: 147-154.L<strong>in</strong>dstrom, J. E., Barry, R. P. & Braddock, J. F. 1998. Microbial <strong>community</strong> analysis: a k<strong>in</strong>etic approach to construct<strong>in</strong>gpotential C source utilization patterns. Soil Biology and Biochemistry 30: 231-239.Lyon, J. & Sagers, C. L. 2002. Correspondence analysis of functional groups <strong>in</strong> a riparian landscape. Plant Ecology 164: 171-183.Mausbach, M. J. & Seybold, C, A, 1998. Assessment of <strong>soil</strong> quality. In Lal, R. (ed.), Soil quality and agricultural susta<strong>in</strong>ability.pp. 33-43, Ann Arbor Press, Chelsea, Michigan.MacMillan, D. C. 1991. Predict<strong>in</strong>g the general yield class of Sitka spruce on better quality land <strong>in</strong> Scotland. Forestry 64: 359-372.McInroy, J. A., Musson, G., Wei Gang & Klopper, J. W. 1996. Mask<strong>in</strong>g of antibiotic-resistance upon recovery of endophyticbacteria. Plant and Soil 186: 213-218.Neitko, K. F. & Frankenberg, W. T. 1989. Biosynthesis of cytok<strong>in</strong><strong>in</strong>s <strong>in</strong> <strong>soil</strong>. Journal of Soil Science Society of America. 53:735-740.Odeh, I. O. A., Chittleborough, D. J. & McBratney, A. B., 1991. Elucidation of <strong>soil</strong>-landform <strong>in</strong>terrelationships by canonical
Soil <strong>bacterial</strong> communities reflect<strong>in</strong>g land degradation53ord<strong>in</strong>ation analysis. Geoderma 49: 1-32.Ol<strong>in</strong>e, D. K., Grant, M. C., 2002. Scal<strong>in</strong>g patterns of biomass and <strong>soil</strong> properties: an empirical analysis. Landscape Ecology 17:13-26.Palmer, K. M. & Young, J. P. W. 2000. Higher diversity of Rhizobium legum<strong>in</strong>osarum biovar viciae populations <strong>in</strong> arable <strong>soil</strong>sthan <strong>in</strong> grass <strong>soil</strong>s. Applied and Environmental Microbiology 66: 2445-2450.Pankhurst, C. E., Yu, S., Hawke, B. G. & Harch, B. D. 2001. Capacity of fatty acid <strong>profiles</strong> and substrate utilization patternsto describe differences <strong>in</strong> <strong>soil</strong> microbial communities <strong>associated</strong> <strong>with</strong> <strong>in</strong>creased sal<strong>in</strong>ity or alkal<strong>in</strong>ity at three locations <strong>in</strong>South Australia. Biology and Fertility of Soils 33: 201-17.Pillai, S. D. and Pepper, I. L. 1991. Transposon Tn5 as an identifiable marker <strong>in</strong> rhizobia: survival and genetic stability of Tn5mutant bean rhizobia under temperature stressed conditions <strong>in</strong> desert <strong>soil</strong>s. Microbial Ecology 22: 21-33.Pote, J., Ceccher<strong>in</strong>i, M. T., Van, V. T., Rosselli, W., Wildi, W., Simonet, P. & Vogel, T. M. 2003. Fate and transport ofantibiotic resistance genes <strong>in</strong> saturated <strong>soil</strong> columns. European Journal of Soil Biology 39: 65-71.Roane, T. M. & Kellogg, S. T. 1996. Characterization of <strong>bacterial</strong> communities <strong>in</strong> heavy metal contam<strong>in</strong>ated <strong>soil</strong>s. CanadianJournal of Microbiology 42: 593-603.Ramos, M. L. G., Magalhanes, N. F. M. & Boddey, R. M. 1987. Native and <strong>in</strong>oculated rhizobia isolated from field grownPhaseolus vulgaris: effects of lim<strong>in</strong>g an acid <strong>soil</strong> on antibiotic resistance. Soil Biology and Biochemistry 19: 179-185.Sakurai, K., Tanaka, S., Ishizuka, S. & Kanzaki, M. 1998. Differences <strong>in</strong> <strong>soil</strong> properties of dry evergreen and dry deciduousforests <strong>in</strong> the Sakaerat Environmental Research Station. Tropics 8: 61-80.Sena, M. M., Poppi, R. J., Frighetto, R. T. S. & Valar<strong>in</strong>i, P. J. 2000. Avaliação do uso de métodos quimiométricos em análisede solos. Química Nova 23: 547-556.Staddon, W. J., Duchesne, L. C. & Trevors, J. T. 1997. Microbial divesity and <strong>community</strong> structure of postdistrubance forest<strong>soil</strong>s as determ<strong>in</strong>ed by sole-carbon-source utilization patterns. Microbial Ecology 34: 125-130.Stevenson, I. L. 1954. Antibiotic production by act<strong>in</strong>omycetes <strong>in</strong> <strong>soil</strong> demonstrated by morphological changes <strong>in</strong>duced <strong>in</strong>Helm<strong>in</strong>thosporium sativam. Nature 174: 598.Stohlgren, T. J. & Bachand, R. R. 1997. Lodgepole p<strong>in</strong>e (P<strong>in</strong>us contorta) ecotones <strong>in</strong> Rocky Mounta<strong>in</strong>i National Park,Colorado, USA. Ecology 78: 632-641.ter Braak, C. J. F. & milauer, P. 1998. Canoco reference manual and user’s guide to Canoco for w<strong>in</strong>dows: software forcanonical <strong>community</strong> ord<strong>in</strong>ation (vesion 4). Microcomputer Power, Ithaca, NY.USDA Soil Conservation Service 1975. Soil taxonomy, a basic system of <strong>soil</strong> classification for mak<strong>in</strong>g and <strong>in</strong>terpret<strong>in</strong>g <strong>soil</strong>surveys. John Willey and Sons, Inc. New York.van den Br<strong>in</strong>k, P. J., van Wijngaarden, R. P. A., Lucassen, W. G. H., Brock, T. C. M. & Leeuwangh, P. 1996. Effects of the<strong>in</strong>secticide Dursban ® 4E (active <strong>in</strong>gredient chlorpyrifos) <strong>in</strong> outdoor experimental ditches: II. <strong>in</strong>vertebrate <strong>community</strong>responses and recovery. Environmental Toxicology and Chemistry 15: 1143-1153.van Straalen, N. M., 2002. Assesment of <strong>soil</strong> contam<strong>in</strong>ation-a functional perspective. Biodegradation 13: 41-52.Velkov, V. V. 1999. How environmental factors regulate mutagenesis and gene transfer <strong>in</strong> microorganisms. Journal ofBioscience 24: 529-559.Wali, M. K. 1999. Ecological succession and the rehabilitation of disturbed terrestrial ecosystem. Plant and Soil 213: 195-220.Westover, K. N., Kennedy, A. C. & Kelly, S. E. 1998. Patterns of rhizosphere microbial <strong>community</strong> structure <strong>associated</strong> <strong>with</strong>co-occurr<strong>in</strong>g plant species. Journal of Ecology 85: 863-873.Wren, A. B. & Venosa, A. D. 1996. Selective enumeration of aromatic and aliphatic hydrocarbon degrad<strong>in</strong>g bacteria by amost-probable-number procedure. Canadian Journal of Microbiology 42: 252-258.Yang, C.-H., Crowley, D. E. & Menge, J. A. 2001. 16S rDNA f<strong>in</strong>gerpr<strong>in</strong>t<strong>in</strong>g of rhizosphere <strong>bacterial</strong> communities <strong>associated</strong><strong>with</strong> healthy and phytophthora <strong>in</strong>fected avocado roots. FEMS Microbiology Ecology 35: 129-136.Zak, J. C., Will<strong>in</strong>g, M. R., Moorhead, D. L. & Wildman, H. G. 1994. Functional diversity of microbial communities: aquantitative approach. Soil Biology and Biochemistry 26: 1101-1108.Zar, J. H. 1999. Biostatistical analysis. Prentice-Hall, New Jersey.Received 27 th Oct. 2003Accepted 07 th Apr. 2004