

Sparinvest SICAV Annual Report 2009 R.C.S. Luxembourg B 83.976
Sparinvest SICAV Annual Report 2009 R.C.S. Luxembourg B 83.976
Sparinvest SICAV Annual Report 2009 R.C.S. Luxembourg B 83.976

Create successful ePaper yourself
Turn your PDF publications into a flip-book with our unique Google optimized e-Paper software.
<strong>Sparinvest</strong> <strong>SICAV</strong><br />
<strong>Report</strong> of the Investment Manager<br />
Economic Background<br />
In early <strong>2009</strong>, it became apparent that global governments – and in particular those of the G20 industrialised nations - would have to<br />
take extraordinary measures to re-liquify the markets. Over the course of <strong>2009</strong> they did this with direct stimulus measures valued at<br />
around 3% of global GDP.<br />
By reducing interest rates and printing money, funded by the large-scale issuance of treasuries and bonds, governments have<br />
effectively removed the toxicity from the private sector but brought it into the government sector. This has created huge deficits in<br />
some nations (notably the US and UK), thereby limiting the scope for ‘last resort’ intervention by these governments in any future<br />
crises.<br />
The question for the future is whether the markets are now strong enough to survive without further stimulus and whether other<br />
economies of the world will decouple from the US to fuel the next round of recovery. In any event, the argument both for global<br />
diversification and for asset class diversification remains strong.<br />
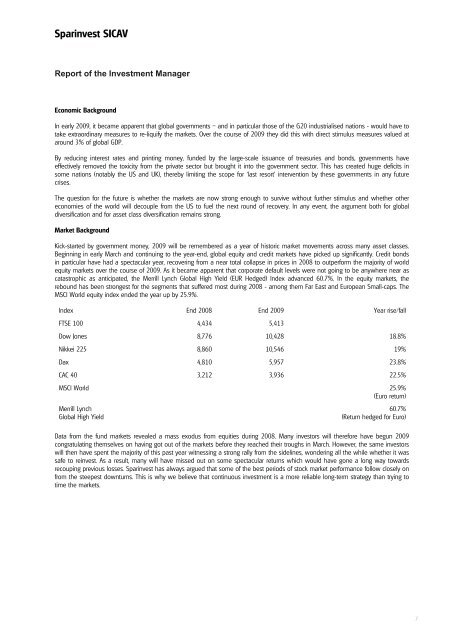
Market Background<br />
Kick-started by government money, <strong>2009</strong> will be remembered as a year of historic market movements across many asset classes.<br />
Beginning in early March and continuing to the year-end, global equity and credit markets have picked up significantly. Credit bonds<br />
in particular have had a spectacular year, recovering from a near total collapse in prices in 2008 to outperform the majority of world<br />
equity markets over the course of <strong>2009</strong>. As it became apparent that corporate default levels were not going to be anywhere near as<br />
catastrophic as anticipated, the Merrill Lynch Global High Yield (EUR Hedged) Index advanced 60.7%. In the equity markets, the<br />
rebound has been strongest for the segments that suffered most during 2008 - among them Far East and European Small-caps. The<br />
MSCI World equity index ended the year up by 25.9%.<br />
Index End 2008 End <strong>2009</strong> Year rise/fall<br />
FTSE 100 4,434 5,413<br />
Dow Jones 8,776 10,428 18.8%<br />
Nikkei 225 8,860 10,546 19%<br />
Dax 4,810 5,957 23.8%<br />
CAC 40 3,212 3,936 22.5%<br />
MSCI World 25.9%<br />
(Euro return)<br />
Merrill Lynch<br />
Global High Yield<br />
60.7%<br />
(Return hedged for Euro)<br />
Data from the fund markets revealed a mass exodus from equities during 2008. Many investors will therefore have begun <strong>2009</strong><br />
congratulating themselves on having got out of the markets before they reached their troughs in March. However, the same investors<br />
will then have spent the majority of this past year witnessing a strong rally from the sidelines, wondering all the while whether it was<br />
safe to reinvest. As a result, many will have missed out on some spectacular returns which would have gone a long way towards<br />
recouping previous losses. <strong>Sparinvest</strong> has always argued that some of the best periods of stock market performance follow closely on<br />
from the steepest downturns. This is why we believe that continuous investment is a more reliable long-term strategy than trying to<br />
time the markets.<br />
7