2009 Almond Almanac - Almond Board of California
2009 Almond Almanac - Almond Board of California
2009 Almond Almanac - Almond Board of California

Create successful ePaper yourself
Turn your PDF publications into a flip-book with our unique Google optimized e-Paper software.
Table <strong>of</strong> contents and welcome1<strong>2009</strong>table <strong>of</strong> contents2 <strong>Board</strong> <strong>of</strong> Directors & Vision Statement3 Realizing Our Vision & Core Values4 Driving Value Through Innovation5 Strategic Priorities & <strong>Almond</strong> <strong>Board</strong> Programs6 Global Marketing Strategy7 The New <strong>Almond</strong><strong>Board</strong>.com8 Mega-Market: North America10 Mega-Market: European Union12 Priority Development Markets: India & China13 Regional Driver Markets: Northeast Asia14 Sustainability15 Agricultural Affairs16 Environmental Excellence17 Nutrition Research18 Quality Assurance19 Industry Relations20 Global Technical & Regulatory Affairs21 <strong>California</strong> <strong>Almond</strong> Industry Overview22 Historical Shipments23 Top Ten Exports by Value24 Position Report <strong>of</strong> <strong>California</strong> <strong>Almond</strong>s25 Destination Overview <strong>of</strong> <strong>California</strong> <strong>Almond</strong>s26 Exports by Destination28 World <strong>Almond</strong> Production29 <strong>California</strong>’s Crop & <strong>Almond</strong> Acreage30 Competing Nuts31 <strong>Almond</strong> Production by County32 Receipts by County & Variety33 Top Ten <strong>Almond</strong> Varieties & Acreage34 <strong>Almond</strong> Crop Estimates vs. Actual Receipts36 <strong>California</strong> <strong>Almond</strong> Acreage & Farm Value38 Crop-Size History vs. Inedible Percentage39 UC Farm Advisors40 USDA Standards for Gradesthe california almondindustry at your fingertipsThe <strong>2009</strong> <strong>Almond</strong> <strong>Almanac</strong> captures the vision <strong>of</strong> wherethe <strong>California</strong> <strong>Almond</strong> industry is headed, outlines theprograms and projects that power the industry toward thatvision, and provides a comprehensive statistical analysis<strong>of</strong> the production and marketing <strong>of</strong> <strong>California</strong> <strong>Almond</strong>s.The <strong>Almanac</strong> is prepared by <strong>Almond</strong> <strong>Board</strong> <strong>of</strong> <strong>California</strong>(ABC) on a crop-year basis, spanning August 1 throughJuly 31, and includes comprehensive historical informationabout almond production, acreage, and varieties, aswell as shipment and market information. The statisticalcontent is compiled using various handler forms requiredby the industry’s Federal Marketing Order and used in themonthly Position Report issued by ABC. Additional data,including crop estimates and farm price, are supplied bythe National Agricultural Statistics Service, <strong>California</strong> FieldOffice (NASS/CFO). Simply put, the <strong>Almond</strong> <strong>Almanac</strong> is thedefinitive source <strong>of</strong> information for the almond industry.
2 board <strong>of</strong> directors and vision statement<strong>2009</strong>board <strong>of</strong>DIRECTORSscott HunterMike MasonDave PhippenKeith RiggJohn ThomingChristine Long, ChairDoug Youngdahl,Vice ChairDavid ArakelianDave BakerBill Brushvision: To be the healthiest specialty crop in the world.
Realizing Our Vision and Core Values3realizing our vision means:Enhancing consumer health, food safety, the environment,and quality production.Building domestic and international awareness and demand.Promoting stability <strong>of</strong> supply.Developing and distributing industry and production information.Ensuring uniform compliance.core values:We value fairness in our relationships with growers and handlers.We seek consensus to achieve common goals.Enhancing the financial well-being <strong>of</strong> the industry is thedriving force behind all decisions.Decisions are made objectively based on the best available data.We provide the industry with the tools necessary to communicateour messages and to deliver the safest product possible.The entire industry shares the responsibility <strong>of</strong> maintaininga stable supply.The authority <strong>of</strong> the Federal Marketing Order is usedto strengthen and protect the industry.
4 driving value through innovationdear industry stakeholders:In <strong>2009</strong>, the nation, the world, and the <strong>California</strong> <strong>Almond</strong> industry experienced a remarkable year <strong>of</strong>uncertainty, reflection, and change as macroeconomic and political events provided just about as muchturmoil as most <strong>of</strong> us have witnessed in our lifetimes. To say that our businesses and family finances were put to the test would be anunderstatement. Yet we survived this maelstrom due to the fundamental strengths and values that form the bedrock <strong>of</strong> this industry.As an industry, we have attained the most important attribute to which an industry can aspire: character. We know who we are, what werepresent, and what we have to <strong>of</strong>fer our global consumers. When push comes to shove, there is no greater staying quality for a businessor a human being than having confidence in one’s own character. The solidity <strong>of</strong> our character is the result <strong>of</strong> decades <strong>of</strong> challenge,innovation, and achievement.Undoubtedly, the greatest hallmark <strong>of</strong> our industry’s character is innovation. In a simplistic sense, we produce a single agriculturalproduct among the many thousands available to consumers. But in a much more pr<strong>of</strong>ound sense, we <strong>of</strong>fer the world a food product <strong>of</strong>unbridled potential; potential that continues to be unlocked by our industry’s dedication to discovery through innovative research, productapplications, and consumer education.As our industry navigates the 21st century, driving and deriving value through innovation will be its key to success—and innovation needsto occur at every milestone along the supply chain. Innovating to solidify our leadership as the most productive almond-growing regionin the world; innovating to ensure that good quality <strong>California</strong> <strong>Almond</strong>s are available in every market that desires them; and innovating toimprove the diets <strong>of</strong> mankind.We wish you well in 2010 as we maximize our collective resources to drive value through innovation for the <strong>California</strong> <strong>Almond</strong> industry.Richard Waycott, President and CEOChristine Long, Chair
Strategic Priorities and <strong>Almond</strong> <strong>Board</strong> Programs 5program budget allocationfiscal year 2008/09Key program areas for <strong>Almond</strong> <strong>Board</strong> <strong>of</strong> <strong>California</strong> include globalmarketing, nutrition and production research, food safety, environmentalstewardship, and industry information and statistics. ABC programs arefunded by an assessment placed on each pound <strong>of</strong> almonds producedby almond growers. The <strong>Board</strong> <strong>of</strong> Directors approves allocation toeach <strong>of</strong> the program areas and <strong>Almond</strong> <strong>Board</strong> staff is responsible forimplementing the programs detailed on the following pages.PROGRAM BUDGET ALLOCATIONFISCAL YEAR 2008/09INTERNATIONALMARKETING 21%OPERATIONS 19%FOOD QUALITY & SAFETY 4%PRODUCTION 3%ENVIRONMENTAL 3%NUTRITION RESEARCH 3%GTRA* 1%INDUSTRY RELATIONS 1%strategic prioritiesBuild the case supporting the vision and spread the wordamong global consumers and the trade on the benefits <strong>of</strong>consuming more almonds.Facilitate an industry-wide system for ensuring food safetyfrom farm to fork.Proactively seek solutions to environmental challengesand differentiate the industry.Ensure a basic and applied research capability.NORTH AMERICANMARKETING 45%Source: <strong>Almond</strong> <strong>Board</strong> <strong>of</strong> <strong>California</strong>. *Global Technical and Regulatory Affairs.
6 global marketing strategyBecoming the Nut <strong>of</strong> Choice in the minds <strong>of</strong> our global consumers and food pr<strong>of</strong>essionals is <strong>Almond</strong> <strong>Board</strong> <strong>of</strong> <strong>California</strong>’s top strategic priority.Our global marketing strategy continues to focus on our core geographic markets <strong>of</strong> North America, the European Union, China, India, Japan, andSouth Korea; the top three global categories for almond usage (chocolate confectionery, bakery/patisserie, and snacking); the dissemination <strong>of</strong> ourgrowing portfolio <strong>of</strong> nutritional science to health influencers and the media; and the active management <strong>of</strong> the industry’s reputation as a leader inproviding a safe and wholesome food product.Three consecutive years <strong>of</strong> record crops have provided a plentiful, stable supply to meet the world’s growing demand for almonds. In 2008, almondsachieved the #1 position for total new retail product introductions globally, and ABC began execution <strong>of</strong> the global chocolate strategy, reaching out tothe world’s top manufacturers and producers with our <strong>California</strong> <strong>Almond</strong>s story. A high visibility sponsorship at the World Pastry Cup in Lyon, France,provided the launch pad for Amanderie —ABC’s unique global platform for the art <strong>of</strong> innovation with almonds in bakery and patisserie. And in each <strong>of</strong>our key markets, more consumers are choosing <strong>California</strong> <strong>Almond</strong>s as an essential part <strong>of</strong> their daily lives.To achieve and to remain the Nut <strong>of</strong> Choice, ABC’s marketing programs are designed to earn the interest, respect, trust, loyalty, and ultimately,the advocacy <strong>of</strong> consumers and food pr<strong>of</strong>essionals around the world. With our strong research-based foundation, ABC now seeks to establish amore emotional connection by showing consumers how <strong>California</strong> <strong>Almond</strong>s fit their lifestyles and meet their needs for tasty, nutritious, and relevantsolutions to their everyday challenges. And our food pr<strong>of</strong>essional outreach serves up pro<strong>of</strong> <strong>of</strong> consumer preference, leadership in areas such as foodquality and safety, and inspiration for innovation in healthier products that are on trend for today’s consumers.NUMBER OF NEW RETAIL PRODUCTS2,0001,5001,000500GLOBAL INTRODUCTIONS BY NUT TYPE 2004/05–2008/09ALMONDSPEANUTSHAZELNUTSCASHEWSWALNUTSPECANSPISTACHIOSMACADAMIANUTS04/05CROP YEAR05/0606/0707/08Source: Mintel Global New Products Database & Sterling-Rice Group, Global New Products Introductions Report, 2008.08/09
THE NEW ALMONDBOARD.COM 7the newalmondboard.comThe internet is the fastest-growing communications tool worldwide,and the <strong>California</strong> <strong>Almond</strong> industry is taking advantage <strong>of</strong> this powerfulmedium by launching an all-new website and online presence:<strong>Almond</strong><strong>Board</strong>.com. The new website serves as the cornerstone <strong>of</strong><strong>Almond</strong> <strong>Board</strong> <strong>of</strong> <strong>California</strong>’s global communications program and is a strong reflection <strong>of</strong> the industry’s global image.The new <strong>Almond</strong><strong>Board</strong>.com showcases five distinct sections for our main visitors: growers, handlers, consumers, healthpr<strong>of</strong>essionals, and food pr<strong>of</strong>essionals. Each section prominently displays the most relevant information for each target audience.For example, consumers can access quick-and-easy almond recipes, growers are able to find the most timely industry newsand almond-related research, and health pr<strong>of</strong>essionals can discover new tips and tools to share with their patients and learnmore about almond nutrition research. The site also features interactive tools to promote user-generated content and facilitatecommunication between ABC and site visitors.The site is translated into several languages to build a strong online global presence for the <strong>California</strong> <strong>Almond</strong> industry.Online access to the industry’s vast portfolio <strong>of</strong> almond recipes, research, and innovative programs, presented in a contemporary,easy-to-navigate format, helps our stakeholders make <strong>California</strong> <strong>Almond</strong>s an essential part <strong>of</strong> their lives.
8 Mega-Market: north americaThe North American market is the single largest almond market, representing over 452 million pounds shipped in 2008–<strong>2009</strong> and with purchasesper month continuing to rise. In fact, since 1999, domestic shipments have increased an astounding 93 percent. The consumer target audiences,Jane, Healthy Men (Tom), Jenny, and Julia, who represent 51 percent <strong>of</strong> the population, have driven growth and, according to the <strong>2009</strong> North AmericaConsumer Attitudes, Awareness, and Usage (AAU) study, almonds surpassed peanuts as the top nut for self-reported ongoing usage. The NorthAmerican market applies three key strategies to direct communication efforts to consumers, food pr<strong>of</strong>essionals, and health pr<strong>of</strong>essionals.strategy 1:<strong>Almond</strong>s are viewed asthe heart-healthiest nut.Communications to all target audiences continueto use the current qualified health claim toeducate the heart-healthy benefits <strong>of</strong> almonds.When consumers rated almond-specific healthbenefits, overall health/nutrition and heart-healthrise to the top. One example <strong>of</strong> a heart-healthprogram, “Traveling Toms,” ran during February,National Heart Health Month, and leveragedhotel, frequent flyer clubs, and rental car partnersin six key US markets. This program spread theword about the benefits <strong>of</strong> snacking on a handful<strong>of</strong> almonds when men travelling generally reachfor less-nutritious snacks.strategy 2:Strengthen our position as a leadingfood in both taste and nutrition.Sometimes healthy foods aren’t the tastiest, butalmonds continue to shine as a tasty, nutritiousfood. <strong>Almond</strong> <strong>Board</strong> <strong>of</strong> <strong>California</strong> emphasizestaste in consumer communications to ensure thatthe improved health perceptions do not result inless-positive taste perceptions. <strong>Almond</strong> nutrition,crunch, and taste scores have remained high inongoing consumer research studies. <strong>Almond</strong>s arealso king nut in attribute ratings for “nutritious,”“balanced,” and “natural,” as reported in the <strong>2009</strong>AAU. In January 2010, ABC will launch a newadvertising campaign that focuses on the greattaste and benefits consumers get when eatingjust a handful <strong>of</strong> almonds. The new website,<strong>Almond</strong><strong>Board</strong>.com, was launched in June <strong>2009</strong>,with a rejuvenated recipe database and improvedsearch functionality. Communications to alltarget audiences will drive traffic to the websiteto inspire individuals to try almonds in new andexciting ways.strategy 3:<strong>Almond</strong>s are a relevant solutionat functional and emotional levels.In 2008, 70 percent <strong>of</strong> consumers who recalledhearing a positive health story about nuts said itwas about almonds*. ABC’s messages continueto be fine-tuned to relate to the thoughts, goals,and attitudes <strong>of</strong> the specific target audiencesegments at both functional and emotional levels.For example, the Snack Attack program reachedour Tom and Jane targets with recipes andsnack tips for game-time meals when we knowTom wants a great TV snack and Jane wants toprovide a more nutritious solution for her family.ABC knows that Janes are information-sharers,so a section <strong>of</strong> the all-new <strong>Almond</strong><strong>Board</strong>.com—Solutions from You—is dedicated to gatheringtips and stories from actual consumers andhighlighting the contributors to create a network<strong>of</strong> consumer ambassadors for almonds.*<strong>Almond</strong> <strong>Board</strong> <strong>of</strong> <strong>California</strong> and Sterling-Rice Group, Consumer AAU, 2008.Scientific evidence suggests but does not prove that eating 1.5 ounces per day <strong>of</strong> most nuts, such asalmonds, as part <strong>of</strong> a diet low in saturated fat and cholesterol may reduce the rise <strong>of</strong> heart disease.
9NUT CHOSEN TO EAT ON AN ONGOING BASIS 2004–<strong>2009</strong>80%PERCENTAGE70%60%50%40%30%40%31%59% 63% 67%61% 62% 62%58%42% 40%56%65%60%58%51%32% 30%44% 47% 39% 39%26%43% 44%36% 35%20042005200620072008<strong>2009</strong>20%17%17% 16%10%n = 2,004 (<strong>2009</strong>)ALMONDSPEANUTSCASHEWSWALNUTSPECANSSource: <strong>Almond</strong> <strong>Board</strong> <strong>of</strong> <strong>California</strong> and Sterling-Rice Group, Consumer AAU, <strong>2009</strong>.NORTH AMERICA ALMOND SHIPMENTS 1999/00–2008/09MILLION POUNDS500400300200USCANADA233232262319341361331400433451100099/0000/0101/0202/0303/0404/0505/0606/0707/0808/09CROP YEARSource: <strong>Almond</strong> <strong>Board</strong> <strong>of</strong> <strong>California</strong>.Note: Totals include shipments to US and Canada.
10 Mega-Market: European UnionHistorically, <strong>Almond</strong> <strong>Board</strong> <strong>of</strong> <strong>California</strong>’s strategic approach to the European Union (EU) mega-market has leveraged time-testedand proven strategies that have been used to achieve strong demand growth in North America. The strategies are applied against ourthree primary target audiences: consumers, manufacturers, and health pr<strong>of</strong>essionals.strategy 1:<strong>Almond</strong>s are viewedas the heart-healthiest nut.ABC’s application for an almond-only Article13 health claim has progressed through tothe final round <strong>of</strong> review; an opinion fromthe European Food Standards Agency isexpected in early 2010. Research indicatesthat European consumers are more likely tobelieve and act on health benefit statementsthat are backed by a European health claim.As part <strong>of</strong> our target audience outreach,members <strong>of</strong> ABC’s EU Health Pr<strong>of</strong>essionalAdvisory <strong>Board</strong> co-authored a comprehensivepaper summarizing the growing body <strong>of</strong>scientific evidence supporting almonds’ hearthealthycredentials.strategy 2:Strengthen our position as a leadingfood in both taste and nutrition.In response to growing consumer demandfor nutritious food that tastes good, ABC’soutreach to consumers in the UK, France,and Germany; food manufacturers; andEuropean dietitians and nutritionistsemphasizes <strong>California</strong> <strong>Almond</strong>s as a greattasting powerhouse <strong>of</strong> nutrients. New EUnutrient-pr<strong>of</strong>iling legislation enables ABC tohighlight almonds as an excellent source <strong>of</strong>monounsaturated fat, protein, fiber, vitaminE, magnesium, calcium, and potassium. Tw<strong>of</strong>ront-cover stories in major European foodmagazines in <strong>2009</strong> highlighted the halo <strong>of</strong>taste and nutrition that almonds bring to awide variety <strong>of</strong> food products.strategy 3:<strong>Almond</strong>s are a relevant solutionat functional and emotional levels.In the EU, obesity and weight managementare major concerns for individuals andpolicymakers. In 2008–<strong>2009</strong>, ABC’soutreach to all audiences focused on<strong>California</strong> <strong>Almond</strong>s as a heart-healthy, tasty,convenient, and guilt-free snack. In the“Taste <strong>of</strong> Summer” online promotion withthe UK’s major newspaper, the Guardian,over 14,000 consumers opted to learn more,with 78 percent saying they were inspiredto buy products containing almonds. Newretail product introductions in the EUgrew 9 percent in 2008, reflecting foodmanufacturers’ recognition <strong>of</strong> almonds’versatility and value.
11EU JANE: SELF-REPORTEDCONSUMPTION 2007/08–<strong>2009</strong>/10EU SHIPMENTS 27 COUNTRIES, 1999/00–2008/09MEAN CONSUMPTION PER MONTH87654ALL JANES*UKFRANCEGERMANYHOW MANY TIMES A MONTH DO YOU EATALMONDS OR FOODS THAT CONTAIN ALMONDS?MILLION POUNDS500400300292.2292331.1393.4425387.7373.5475.9380.9452.53n = 4,46020007/08CROP YEAR08/0909/10Source: EuroPNStyles. *Seven countries.99/00 00/01CROP YEAR01/0202/0303/0404/05 05/06 06/07 07/08 08/09Source: <strong>Almond</strong> <strong>Board</strong> <strong>of</strong> <strong>California</strong>.NUMBER OF INTRODUCTIONS6005004003002001000EU: NEW ALMOND PRODUCTINTRODUCTIONS 2004/05–2008/09TOTAL OF ALL CATEGORIESBAKERYCHOCOLATECONFECTIONERYSNACKSn = 4,46004/0505/0606/0707/0808/09CROP YEARSource: Mintel Global New Products Database &Sterling-Rice Group, Global New Products Introductions Report, 2008.PERCENTAGE OF RESPONDENTS WHO SELECTED PRODUCT60%50%40%30%20%10%0%UK: LIKELIHOOD TO PURCHASE <strong>2009</strong>n = 14,311SNACKALMONDSPRODUCTCEREALMIXEDNUTSNOW THAT YOU KNOW MORE ABOUT THEHEALTH BENEFITS OF ALMONDS, ARE YOUMORE LIKELY TO PURCHASE PRODUCTSTHAT CONTAIN ALMONDS?GRANOLABARSICECREAMENERGYBARSCHOCOLATEBARSSource: Guardian online ABC “Taste <strong>of</strong> Summer” promotion.
egional driver markets: northeast asia 13Japan and South Korea are important markets for <strong>California</strong> <strong>Almond</strong>s in terms <strong>of</strong> their domestic market growth potential as well as for their unique roles ininfluencing consumer and food trends throughout Asia. <strong>Almond</strong> <strong>Board</strong> <strong>of</strong> <strong>California</strong>’s consumer education and promotion programs in these regional drivermarkets are localized to match the needs and desires <strong>of</strong> local consumers and are based on a solid foundation <strong>of</strong> consumer research insights.strategy 1: Firmly establish almonds as a daily,must-have, tasty, nutritious, and satisfying food from nature.The primary focus is conveying science-based nutrition information aboutthe benefits <strong>of</strong> consuming a handful <strong>of</strong> almonds a day while overcomingcommon misconceptions, such as the belief that almonds are fattening.ABC programs aim to reposition almonds as a smart, guilt-free choice foreveryday well-being. A clear example <strong>of</strong> this strategy’s success is in Korea,where almond exports have achieved back-to-back records and researchfindings have shown a dramatic favorable shift in consumer attitudes. Whenasked about positive attributes for almonds, 56 percent <strong>of</strong> respondentsanswered “health and nutrition,” the second highest answer after “taste.”This is up from 32 percent in 2004, when “health and nutrition” placedfourth after “taste,” “goes well with alcohol,” and “texture.”strategy 2: Bond with consumers on an emotional level bysparking new almond experiences.Beyond embracing the nutritional benefits <strong>of</strong> almonds, consumers who feelan emotional connection are more loyal to <strong>California</strong> <strong>Almond</strong>s as an essentialchoice for themselves and their families’ daily lives. ABC’s summer <strong>2009</strong>“Karada ni E” (Vitamin E for the Body) campaign was a resounding successin Japan, exciting and enticing consumers to discover new ways to enjoyalmonds. This multifaceted program encompassed both online and <strong>of</strong>flineelements, which stimulated retail sales, even causing stock outages.<strong>California</strong> <strong>Almond</strong>s surround consumers on all sides in an<strong>Almond</strong> Café specially created for the Karada ni E campaign in Japan.SOUTH KOREA:POSITIVE ALMOND ATTRIBUTESPERCENTAGE OF RESPONDENTS CITING80%70%60%50%40%30%20%10%075%TASTEATTRIBUTE78%32%56%HEALTH AND NUTRITION50%29%GOES WELLWITH ALCOHOL20042008n = 960 (2004)n = 969 (2008)Source: Research and Research, S. Korea Consumer AAU, 2008.
14 SustainabilitySustainability has been on <strong>Almond</strong> <strong>Board</strong> <strong>of</strong> <strong>California</strong>’s agenda for anumber <strong>of</strong> years, but in many ways it has always been a part <strong>of</strong> our industry’sculture. One can’t have 4th and 5th generations <strong>of</strong> almond farming withouta long-term perspective. Several things have led to a heightened focus onsustainability: the growing population <strong>of</strong> <strong>California</strong>’s Central Valley, increasedconsumer awareness <strong>of</strong> the world’s limited and shrinking resources, andcorporate realization that improving resource usage helps the bottom lineand satisfies consumers.Sustainability includes ensuring that almonds remain the crop <strong>of</strong> choice for<strong>California</strong> growers, a crop <strong>California</strong>ns support to share their resources <strong>of</strong>land, water, and air; and ensuring that almonds remain an essential food <strong>of</strong>choice for consumers. Over four years ago, ABC’s Environmental Committeetackled the question <strong>of</strong> what sustainability means to almond growing. Basedon a series <strong>of</strong> grower focus groups, the following definition was developed:“Sustainable almond farming utilizes production practices that areeconomically viable and based on both scientific research and commonsense. It is motivated by a respect for the environment, neighbors, andemployees. The result is a plentiful, wholesome, and safe food product.”More recently, the Environmental Committee has initiated development <strong>of</strong> asustainability self-assessment program for growers. This will allow growersto evaluate their current and potential growing practices with an eye towardreducing resources and minimizing environmental impact while keeping thetrees healthy. The data will be anonymously compiled to document the extentto which almond growers are already implementing sustainable practices andto identify where additional research or education may be helpful. This datawill also augment ABC’s sustainability messaging to build credibility for theindustry’s leadership in considering environmental and social factors whenchoosing growing practices in the face <strong>of</strong> the complex biological, economic,and regulatory environment.There is no single answer for the most sustainable way to grow almonds in<strong>California</strong>; the growing region is too diverse with different resources andneeds. However, documenting the thoughtfulness and the continued efforttoward being sustainable is critical to ensuring that almonds remain a crop <strong>of</strong>choice in <strong>California</strong>.
agricultural affairs15The Production Research Committee oversees <strong>Almond</strong> <strong>Board</strong>-fundedagricultural research. Started in 1973 to address navel orangeworm,the program has expanded substantially. The long-term effort hasincreased yields and production efficiency, improved quality and foodsafety, and developed environmentally responsible orchard and pestmanagement practices.<strong>2009</strong> production research highlightshorticulture Past and currently funded research continues tohelp the industry cope with water shortages and drought. Based onpast research, growers facing restrictions have employed regulateddeficit irrigation strategies to produce crops with no loss in yields. Currentresearch is looking at tree survival and performance under more severedrought scenarios. Balancing production efficiency and environmentalstewardship, projects on tree nutrition constitute an interdisciplinaryapproach being co-funded with the Environmental Committee. This workhas been leveraged substantially with the USDA Farm Bill Specialty CropsResearch Initiative grant “Advanced Sensing and Management to OptimizeWater and Nitrogen Use in Tree Crops” <strong>of</strong> $1.9 million over four years.Another priority is breeding and field assessment for self-compatiblevarieties to reduce reliance on honey bees.pollination The Bee Task Force, a subcommittee, addressesbee health and transportation challenges and oversees ABC-fundedpollination research. The focus <strong>of</strong> this research is honey bee healthand nutrition, including varroa mite control and Colony Collapse Disorder.Research complements other efforts, including research funded by USDAand other private groups like Project Apis M.Entomology Includes research on monitoring, management, andcontrol <strong>of</strong> insect pests, including navel orangeworm (NOW), spidermites, peach twig borer, and ten-lined June beetle. Our participation in acomprehensive five-year USDA-ARS area-wide project for orangewormreflects current priorities and is <strong>of</strong>fering key insights and refinements toNOW management: the efficacy <strong>of</strong> mating disruption; upgrading orchardwinter sanitation guidelines; developing bio-rational insecticide optionsto replace older broad-spectrum sprays; and reinforcing the link betweenorangeworm and aflatoxin.field-oriented aflatoxin research Food safety starts in thefield and to this end, ABC is funding two field-oriented projects on aflatoxin.One is characterizing the geographic distribution and potential for aflatoxinunder different growing scenarios. The other project is developing stockpilemanagement guidelines to prevent aflatoxin development.plant pathology Research encompasses a wide range <strong>of</strong> diseases:alternaria leaf spot, scab, brown rot, shothole, anthracnose, lower limbdieback, band canker, and almond replant issues in light <strong>of</strong> soil fumigationrestrictions. Efforts include countering fungicide resistance to diseasesthrough resistance management fungicide programs and registeringfungicides with different modes <strong>of</strong> action.PRODUCTION RESEARCH 2008/0908/09 budgets 09/10 budgets*number <strong>of</strong>projectsbudgetnumber <strong>of</strong>projectsbudgetEntomology 9 $244,909 8 $212,826Horticulture 15 $350,221 15 $383,713Field Aflatoxin Research 1 $31,439 2 $75,862Plant Pathology 10 $271,630 9 $262,384Pollination 11 $203,744 8 $101,327Subtotal 46 $1,101,943 42 $1,036,112Proceedings & Education — N/A — $30,000New Opportunities — $266 — $100,000Total — $1,102,209 — $1,166,112*For additional information, visit <strong>Almond</strong><strong>Board</strong>.com.
16 environmental excellenceTo address the complex environmental and regulatory concerns facingalmond growers, the Environmental Committee (EC) funds approximately$500,000 annually in research and education. <strong>Almond</strong> <strong>Board</strong> <strong>of</strong> <strong>California</strong>continues to seek practical solutions through alliances with grower,academic, and government organizations. For example, ABC is a partner withCommunity Alliance with Family Farmers (CAFF) and UC Extension focusingon integrated pest management (IPM) outreach. This partnership was fundedby <strong>California</strong> Department <strong>of</strong> Pesticide Regulation (DPR).<strong>2009</strong> environmental research highlightsair quality Several projects continued to focus on dust-reduction(PM10 and PM2.5) measures during harvesting. The ongoing soilfumigant research projects are developing methods to reduce emissions,thereby reducing VOCs and reducing risks from <strong>of</strong>f-gassing. Togetherwith the Production Research Committee, the EC continued funding amultidisciplinary almond-nutrient management project, as well as aproject that models tree growth. Both projects will improve ourunderstanding <strong>of</strong> the carbon and nitrous oxide (N 2O) emitted andsequestered in almond production.water quality ABC sponsors the Coalition for Urban/RuralEnvironmental Stewardship (CURES) Watershed Coalition News, publishedthree times a year, which provides information to growers about stateregulations governing water run-<strong>of</strong>f and groundwater, as well as tips toprevent run-<strong>of</strong>f and spray drift. CURES also assessed the efficacy <strong>of</strong> run-<strong>of</strong>fponds in reducing pyrethroid movement.Environmental Stewardship Program The fourth annualEnvironmental Stewardship tour successfully educated state environmentalregulators about environmentally responsible orchard practices. The programpublicizes information from <strong>Almond</strong> <strong>Board</strong>-funded environmental research,which can be found on ABC’s updated website, <strong>Almond</strong><strong>Board</strong>.com.environmental PROJECTS 2008/09project leader project title budgetStewardship/Crop ProtectionLookerEnvironmental StewardshipCampaign Proposal$78,000VerdegaalPMA II Support – Reduced Risk PestManagement Approaches$50,657SureHarvestDesign and Develop SustainablePractices Program$410,000*DeJong/SixAssessing the Carbon Budget <strong>of</strong> <strong>Almond</strong>Trees and Develop Model$68,474Water QualityStoltzDeposition Testing and Pattern for SpraySwath Analysis$5,000KlassenLinking <strong>Almond</strong> <strong>Board</strong> <strong>of</strong> <strong>California</strong> toCentral Valley Watersheds$21,000BrownDevelopment <strong>of</strong> Nutrient Budget Approachto Fertilizer Management in <strong>Almond</strong>s$$25,000Klassen/MarkleEfficacy <strong>of</strong> Settlement Ponds for Drainageafter Spray Application$38,000Air QualityGiles Measurement <strong>of</strong> Harvest Dust Generation $50,000CaparedaImproving PM Emission Factors forHarvest Practices$82,151Smart Control <strong>of</strong> Greenhouse Gas Emissions $51,370SmartEvaluation <strong>of</strong> Nitrogen Use Efficiency UsingIsotopic Tracer ApproachGaoIrrigation and Organic Amendments toReduce Fumigant EmissionsMiscellaneous/Other$41,646$39,870VOC Outreach $30,000Wells AgSIP Project $12,000New Opportunity – Nickels Soil LabWell Project$100,000Program Total $1,103,168*Approved as a ceiling.
nutrition research17In early <strong>2009</strong>, to support <strong>Almond</strong> <strong>Board</strong> <strong>of</strong> <strong>California</strong>’s global strategies formarket growth, the Nutrition Research Committee confirmed its long-termcommitment to discovering the beneficial effects <strong>of</strong> almond consumption onheart-health, diabetes and pre-diabetes, and weight management/gut health.In addition, the industry is investing in new basic research on how peopledevelop almond allergies with the hope that eventually protocols for buildingtolerance can be developed. In <strong>2009</strong>, award-winning research focused onalmonds’ phytochemical composition and gut health*. Phyto (“plant” in Latin)refers to compounds that plants produce to protect themselves from insectsand are bitter in nature. In the past decade, researchers have discoveredthat these compounds have potential human health benefits. In the case<strong>of</strong> almonds, these compounds are concentrated in the skins. This meansalmonds may have an extra nutritional benefit in addition to being a dietaryfiber source by contributing to digestion and gut health. Just one ounce(28 grams) <strong>of</strong> almonds provides 3.5 grams <strong>of</strong> fiber, 12 percent <strong>of</strong> the USrecommended daily value. Fiber plays a role in maintaining a healthydigestive tract by contributing to regularity.Ongoing ABC-funded research, either with human clinical trials or using a“model gut,” such as the British and Italian researchers at the British Institute<strong>of</strong> Food Research in Norwich use, is also showing that almonds may havea prebiotic effect. Prebiotics are non-digestible food substances that actas food for “good” bacteria in the human gastrointestinal tract by helping tomaintain immunity and overall well-being. The more we learn about almonds,the more they continue to amaze!*Mandalari, G et al. <strong>2009</strong>. “<strong>Almond</strong>s demonstrate prebiotic potential:Effects <strong>of</strong> almond lipid on colonic microbiota.” AgroFOOD, 20(3)47–49.Digestive Gut Model. UK Institute <strong>of</strong> Food Research.Good news about good fat: U.S. Dietary Guidelines recommend that themajority <strong>of</strong> your fat intake be unsaturated. One serving <strong>of</strong> almonds (28g)has 13g <strong>of</strong> unsaturated fat and only 1g <strong>of</strong> saturated fat.
industry relations19<strong>California</strong> <strong>Almond</strong> growers and handlers are some <strong>of</strong> the most progressive individuals in the agricultural industry; they have to be as thechallenges and issues facing the almond industry continue to increase.<strong>Almond</strong> <strong>Board</strong> <strong>of</strong> <strong>California</strong>’s Industry Relations program is committed to providing almond growers, handlers, and other industrystakeholders with the most up-to-date tools, information, and resources necessary to assist them in managing these challenges.Redesigned <strong>Almond</strong> <strong>Board</strong> <strong>of</strong> <strong>California</strong> website: The new and improved<strong>Almond</strong><strong>Board</strong>.com website serves as a comprehensive resource for industrystakeholders, providing them with quick access to industry tools and information.Timely “news you can use”: ABC continues to insert its <strong>California</strong> <strong>Almond</strong>s Outlooknewsletter in the Pacific Nut Producer magazine. A more comprehensive monthlyonline or email version includes more detailed feature articles and links. The Handle, anelectronic publication distributed monthly in conjunction with the Position Report andGlobal Update, contains information on issues <strong>of</strong> immediate concern for handlers.Feature articles: Placed in well-read agriculture publications, including a monthlyfeature in the Western Farm Press, highlights the latest, relevant ABC research findings.<strong>Almond</strong> Industry Leadership Program: This program promotes future leadershiproles within the industry for almond-invested individuals while <strong>of</strong>fering leadershiptraining and comprehensive industry education.Farm Advisor Internship Program: This paid internship <strong>of</strong>fers an opportunity forstudents in agricultural or biological sciences to learn about the University <strong>of</strong> <strong>California</strong>Extension Farm Advisor position by working with experienced farm advisors.Grower research indicates that food quality and safety, air quality, and water arethree top-<strong>of</strong>-mind issues for most producers <strong>of</strong> <strong>California</strong> <strong>Almond</strong>s. In response,Industry Relations tools and resources consistently reflect these themes,as well as other areas <strong>of</strong> interest to the industry.
<strong>California</strong> <strong>Almond</strong> Industry Overview21california industry overview<strong>Almond</strong>s are <strong>California</strong>’s number one tree nut crop. Duringthe 2008–<strong>2009</strong> crop year, approximately 6,000 growerslocated throughout the Central Valley <strong>of</strong> <strong>California</strong> produced1.615 billion pounds <strong>of</strong> almonds on 680,000 bearing acres.ALMOND PRODUCTION BY COUNTY 2008/09100In the same year, 100 handlers shipped a record-breaking1.389 billion pounds <strong>of</strong> almonds, a 10 percent increase overthe prior year. <strong>California</strong> produces about 80 percent <strong>of</strong> theworld’s almonds and virtually 100 percent <strong>of</strong> the domestic supply.GLENNCOLUSAYOLOTEHAMABUTTEYUBASUTTER50–991–49MILLION POUNDSDistribution <strong>of</strong> Crop by Handler Size# <strong>of</strong> Handlers% <strong>of</strong> CropHandledSOLANOSANJOAQUINMERCEDSTANISLAUSMADERA2008: 100 Handlers40M Pounds 9 51.9%2003: 115 Handlers40M Pounds 4 38.2%
top ten exports by value23TOP TEN US SPECIALTY CROP EXPORTS BY VALUE 2008*$2,000$1,897$1,500IN MILLIONS$1,000$500$963 $737 $704$609 $582$491 $475 $431$317$0ALMONDSWINE AND WINEPRODUCTSAPPLESPOTATOES,FROZENGRAPESPISTACHIOSWALNUTSORANGES ANDTANGERINESLETTUCESTRAWBERRIESSource: Bureau <strong>of</strong> the Census, US Department <strong>of</strong> Commerce, Foreign Trade Statistics. *Calendar year January through December 2008.TOP TEN CALIFORNIA AGRICULTURAL EXPORTS BY VALUE 2007*$2,000$1,879$1,500IN MILLIONS$1,000$500$963$816$553$505$444$364$313$300$297$0ALMONDSDAIRY PRODUCTSWINETABLE GRAPESCOTTON WALNUTS PISTACHIOS RICE TOMATOES,PROCESSEDSTRAWBERRIESSource: Agricultural Issues Center, University <strong>of</strong> <strong>California</strong>. *Calendar year January through December 2007.
24 POSITION REPORT OF CALIFORNIA ALMONDS09/10 † 1,309.5 413.7 N/A 1,723.2 425.0 1,050.0 1,475.0 248.2POSITION REPORT OF CALIFORNIA ALMONDS Million poundsCROP RedeterminedLess Total Salable DomesticExportTotalSalableCarry–InYEAR MarketableReserveSupplyShipments Shipments Shipments Carryover90/91 615.7 203.1 43.1 775.7 173.9 360.5 534.4 241.391/92 463.2 241.3 0.0 704.5 178.6 377.8 556.4 148.192/93 516.0 148.1 N/A 664.1 186.0 349.9 535.9 128.293/94 470.0 133.6 N/A 603.6 162.0 336.5 498.5 102.694/95 713.3 102.6 0.0 815.9 160.6 448.1 608.7 204.895/96 352.3 204.8 N/A 557.1 132.8 335.1 467.9 92.896/97 489.3 92.8 N/A 582.1 137.5 395.8 533.3 48.397/98 736.8 48.3 N/A 785.1 159.6 452.4 612.1 172.098/99 492.4 172.0 N/A 664.4 167.0 405.5 572.5 91.899/00 795.5 91.8 0.0 887.3 209.6 503.0 712.6 174.700/01 672.4 174.7 0.0 847.1 211.2 528.7 739.8 107.301/02 794.8 107.3 N/A 902.1 239.3 581.8 821.1 80.902/03 1,063.5 80.9 N/A 1,144.4 291.7 690.6 982.4 162.003/04 1,011.1 162.0 N/A 1,173.1 312.2 712.1 1,024.3 148.904/05 972.8 148.9 N/A 1,121.7 331.6 652.5 984.1 137.705/06 888.7 137.7 N/A 1,026.4 303.9 610.4 914.2 112.206/07 1,087.8 112.2 N/A 1,200.0 368.3 697.8 1,066.1 133.907/08 1,358.3 133.9 N/A 1,492.2 394.8 866.4 1,261.2 231.208/09 1,571.9 231.2 N/A 1,803.1 411.0 978.4 1,389.4 413.7Source: <strong>Almond</strong> <strong>Board</strong> <strong>of</strong> <strong>California</strong>. Note: Totals may not add precisely due to rounding. † Forecast.
destination OVERVIEW OF CALIFORNIA ALMONDS25CALIFORNIA ALMOND EXPORTS BY REGION2008/09EXPORT SHIPMENTS BY PRODUCT TYPE2008/09MIDDLE EAST 14%IN-SHELL 14%ASIA 28%CANADA/MEXICO 5%EASTERN EUROPE 4%OTHER 3%SHELLED 75%MANUFACTURED 11%WESTERNEUROPE 46%MILLION POUNDS5004003002001000TOP WORLD DESTINATIONS 2008/09411UNITEDSTATESTOP TEN EXPORT DESTINATIONS* 2008/09159SPAIN106 100 87GERMANYCHINAINDIA68UNITED ARABEMIRATES49 41 37 32 31JAPANCANADAITALYNETHERLANDS FRANCE*Top ten export markets represent 72% <strong>of</strong> total export shipments.
26 exports by destination kernel weight (Million pounds)World Region Market 08/09 07/08 06/07 05/06 04/05Canada 40.6 39.1 32.3 27.2 29.7North AmericaMexico 6.5 9.1 8.6 7.5 7.7Total 47.1 48.2 40.9 34.6 37.4Central America Total 0.2 0.2 0.1 0.1 0.1Caribbean Total 0.4 0.3 0.3 0.2 0.1Argentina * 0.4 0.5 0.1 0.1Brazil 0.5 0.5 0.8 0.4 0.1Chile 3.1 4.0 3.7 3.0 2.2South AmericaColombia * 0.3 0.2 * *Venezuela 0.6 0.5 0.5 0.6 0.3Others 0.4 0.0 0.0 0.1 0.1Total 4.6 5.6 5.9 4.2 2.8European Union † Latvia 2.9 6.4 4.7 4.1 4.4Austria 0.5 0.5 0.1 * *Belgium 14.3 24.0 15.0 14.0 17.1Bulgaria 1.1 1.1 0.8 0.6 1.0Cyprus 1.2 1.8 1.0 0.8 0.3Czech Republic 3.7 2.4 2.1 1.0 2.4Denmark 7.9 9.6 7.7 7.7 8.1Estonia 0.3 0.3 0.4 0.3 0.4Finland 1.3 1.2 1.2 0.9 1.1France 30.8 37.8 31.3 40.0 38.3Germany 105.7 105.1 92.4 79.5 82.1Greece 15.6 21.1 16.6 16.4 18.4Hungary 0.6 0.2 0.6 0.4 0.7Ireland 0.1 * 0.0 0.0 0.0Italy 37.3 43.4 33.2 42.2 43.4Lithuania 1.3 1.3 0.5 0.7 1.0Luxemburg 0.0 0.0 * * *Malta & Gozo 0.1 0.1 * 0.1 *Netherlands 32.3 29.2 35.8 35.6 34.8Poland 1.5 1.3 1.2 1.3 2.0Portugal 1.5 1.5 0.9 0.9 1.6Romania 0.5 0.5 0.2 * 0.1Slovakia 0.0 * 0.0 0.0 0.0Slovenia 0.0 0.0 * * *Spain 158.6 157.0 101.3 98.7 104.1Sweden 7.2 5.6 5.7 5.0 6.0United Kingdom 26.2 24.3 27.9 22.6 20.1Others 0.0 0.2 0.3 0.4 0.1Total 452.5 476.5 380.9 373.5 387.5Source: <strong>Almond</strong> <strong>Board</strong> <strong>of</strong> <strong>California</strong>. Note: Totals may not add precisely due to rounding. *Received almonds from fewer than three handlers.†Table revised in 2007 to report shipments to European Union and Other Europe; Cyprus is no longer reported in Middle East.
27World Region Market 08/09 07/08 06/07 05/06 04/05Other Europe † bosnia 0.2 0.0 0.0 0.0 0.0serbia 0.7 0.0 0.0 * 0.0Switzerland 4.6 5.3 4.9 4.4 4.3Croatia 1.2 1.1 0.4 * *Norway 4.6 4.1 4.1 3.9 3.8Russia 19.7 20.1 16.5 12.4 14.2Ukraine 1.2 1.7 0.2 0.4 0.2Others 0.3 0.0 0.0 0.2 0.3Total 32.5 32.3 26.1 21.4 22.8afghanistan 0.3 0.1 0.0 0.0 0.0Bahrain 0.9 0.6 0.4 0.4 0.4Israel 7.0 6.2 4.2 9.1 5.1Jordan 9.8 5.1 3.7 1.8 1.8Kuwait 2.1 2.1 1.8 1.4 0.9Middle EastLebanon 7.9 3.8 2.7 1.9 2.7Qatar * 0.2 0.2 * *Saudi Arabia 6.0 6.2 5.4 3.3 3.4Turkey 28.7 16.2 8.6 4.7 4.8UAE 68.2 45.0 30.4 19.1 24.5Others 0.5 0.8 0.3 0.2 0.2Total 131.5 86.2 57.7 41.8 43.8china/hong kong 99.7 46.6 32.3 16.7 17.1India 86.9 72.8 58.5 40.0 52.7Indonesia 1.4 1.0 1.1 0.6 0.5Japan 49.0 47.1 48.7 42.9 52.5Malaysia 2.6 3.3 2.6 1.9 2.9Pakistan 4.3 1.8 1.2 0.3 0.2AsiaPhilippines 0.2 0.1 0.1 0.2 0.1Singapore 2.1 2.4 2.1 1.7 2.1South Korea 21.2 16.8 11.6 10.1 11.7Taiwan 6.1 5.2 5.6 4.5 5.3Thailand 2.1 2.0 2.3 1.7 2.0Vietnam 0.9 2.1 1.3 0.1 *Others 0.2 0.0 0.0 0.2 0.0Total 276.5 201.2 167.4 121.0 147.3New Zealand Total 1.4 1.6 2.1 1.5 1.9Australia Total 2.2 2.2 4.1 3.8 3.7Algeria 14.3 3.8 3.6 2.0 1.0Canary Islands 0.0 0.0 0.6 0.2 0.1Egypt 10.2 3.9 3.7 2.1 1.8Libya 1.1 0.8 0.2 * *AfricaMauritius * * * 0.1 0.0Morocco 0.9 0.9 0.9 0.5 *South Africa 2.3 2.7 3.0 2.9 2.1Tunisia 0.7 0.0 * 0.2 0.0Others 0.1 0.3 0.0 0.4 0.3Total 29.7 12.4 12.0 8.4 5.3others Total 0.0 0.0 0.0 0.0 0.0Total Deliveries 978.4 866.4 697.8 610.4 652.5
28 world almond productionCROPYEAR99/0000/0101/0202/0303/0404/0505/0606/0707/0808/09MILLION POUNDS2,0001,5001,000500Commercial Production <strong>of</strong> <strong>Almond</strong>s in Major Producing CountriesMillion pounds (shelled basis)Australia <strong>California</strong> China Chile Greece India Italy Spain Turkey TotalCALIFORNIA’S SHARE OF WORLD PRODUCTION 1999/00–2008/09OTHERCALIFORNIACA %<strong>of</strong> Total— 829.9 — — 37.5 — 37.5 145.5 30.9 1,081.2 77%18.9 698.4 — — 34.2 — 22.0 116.8 34.2 924.5 76%20.2 824.1 — — 28.7 2.2 39.7 125.7 30.9 1,071.5 77%20.6 1,083.7 — — 37.5 2.4 19.8 145.5 30.9 1,340.4 81%22.3 1,032.9 — — 22.0 2.2 11.0 97.0 30.2 1,217.6 85%25.3 998.0 0.2 16.5 37.5 2.4 26.5 57.7 27.1 1,191.2 84%35.7 911.7 2.2 15.4 30.9 2.5 26.5 140.0 30.2 1,195.1 76%35.1 1,116.7 0.4 15.2 33.1 2.6 13.2 182.0 31.7 1,430.2 78%58.5 1,383.0 2.9 19.4 22.0 2.2 26.5 125.4 34.2 1,674.0 83%57.5 1,614.6 0.9 20.9 26.5 2.6 26.5 116.0 35.3 1,900.8 85%Sources: <strong>Almond</strong> <strong>Board</strong> <strong>of</strong> <strong>California</strong>, <strong>Almond</strong> <strong>Board</strong> <strong>of</strong> Australia, USDA, Foreign Agricultural Service.Notes: Totals may not add precisely due to rounding. Reported countries account for the vast majority <strong>of</strong> world production.099/00 00/01CROP YEARSource: USDA, Foreign Agricultural Service.01/0202/0303/0404/0505/0606/0707/0808/09
california’s crop and almond acreage29CALIFORNIA TOP TEN ACREAGE BY CROP TOTAL PLANTED OR BEARING, <strong>2009</strong> FORECAST2,000TOTAL PLANTED OR BEARINGACRES IN THOUSANDS1,5001,0005001,615,000786,000 760,000 710,000562,000 550,000308,000240,000 227,400 223,0000ALL HAYALL GRAPES,BEARINGALL WHEATALMONDS,BEARINGALL RICEALL CORNPROCESSINGTOMATOESOATSLETTUCEWALNUTS,BEARINGSource: National Agricultural Statistics Service, <strong>California</strong> Field Office (NASS/CFO).300250CALIFORNIA ALMOND ACREAGE BY YEAR PLANTED PRE-1979–2008278,768BEARINGNON-BEARINGIN THOUSANDS2001501005034,27195,50423,481 19,561 15,823 18,36238,44255,12543,48321,080 21,67801979 &EARLIERCROP YEAR1980–19891990–19992000 2001 2002 2003 2004 2005 2006 2007 2008Sources: National Agricultural Statistics Service, <strong>California</strong> Field Office (NASS/CFO). Acres Standing 2008.Note: Detailed data is voluntarily reported by growers to NASS/CFO; therefore, totals do not match annual USDA/NASS forecast.
30 competing nutsUS MARKETABLE PRODUCTION & & IMPORTS OF OF COMPETING NUTS NUTS Million (shelled pounds basis) (shelled basis)08/09 † 1,571.9 4.2 402.8 1.9 26.2 10.0 92.0 56.0 139.6 1.0 24.6 356.0CROPALMONDS WALNUTS HAZELNUTS PECANS PISTACHIOS OTHER NUTS*YEAR CROP IMPORTS CROP IMPORTS CROP IMPORTS CROP IMPORTS CROP IMPORTS CROP IMPORTS99/00 798.6 0.2 237.0 0.2 30.5 12.5 160.4 29.0 58.1 0.3 25.7 243.900/01 677.0 0.4 204.0 0.4 17.4 11.7 92.6 33.0 114.2 0.9 22.7 252.901/02 800.7 0.8 256.7 0.2 38.1 15.2 145.6 35.5 80.7 0.5 25.5 286.702/03 1,063.5 1.9 240.5 0.2 15.3 16.4 78.4 41.7 149.5 0.8 26.7 301.703/04 1,011.1 2.8 281.5 0.4 29.5 10.9 117.0 62.7 56.2 1.5 21.2 352.404/05 972.8 5.7 288.4 0.8 27.2 12.8 82.6 81.2 170.5 0.8 18.8 402.405/06 888.7 9.2 288.2 1.1 20.0 12.1 125.3 75.4 139.0 0.9 51.4 334.906/07 1,087.8 8.1 294.6 2.3 36.4 13.5 91.4 57.0 119.0 1.4 27.8 358.807/08 1,358.3 7.1 295.0 8.7 28.4 13.4 180.3 79.9 207.0 0.9 16.4 378.3POUNDS PER CAPITA1.51.20.90.60.3DOMESTIC PER CAPITA CONSUMPTION OF COMPETING NUTS 2004/05–2008/091.33 1.361.271.161.07ALMONDS ‡PECANSWALNUTSPISTACHIOSHAZELNUTS0.004/05CROP YEAR05/0606/0707/0808/09Source: USDA, Economic Research Service, Fruit & Tree Nut Situation and Outlook. Note: Marketable production is utilized production minus inedibles and noncommercial use.*Other nuts include brazil nuts, macadamia nuts, pine nuts, chestnuts, cashews, and mixed nuts. † Preliminary. ‡ Data provided by <strong>Almond</strong> <strong>Board</strong> <strong>of</strong> <strong>California</strong>.
ALMOND PRODUCTION BY COUNTY31ALMOND PRODUCTION BY COUNTY Million poundsCROPYEAR99/0000/0101/0202/0303/0404/0505/0606/0707/0808/09Southern Valley Countiesnorthern Valley CountiesKern Fresno Stanislaus Merced Madera San Joaquin Tulare Kings Colusa Butte Glenn Yolo Tehama Sutter all others Total162.2 125.8 147.2 125.8 85.0 55.8 15.6 3.1 23.5 45.3 22.5 4.1 3.9 3.9 2.3 826.0137.0 95.2 125.5 95.2 68.1 43.2 11.0 3.2 30.4 44.3 27.1 5.2 7.2 3.2 1.9 697.7167.0 131.5 139.3 110.6 80.5 46.3 15.8 5.8 31.8 49.1 29.3 4.3 5.7 4.1 2.2 823.3221.0 173.0 193.5 152.9 106.3 57.2 20.7 8.2 28.4 59.3 41.5 5.2 8.6 4.5 2.6 1,082.9205.9 176.9 169.3 129.3 94.5 55.3 18.5 12.3 55.0 50.0 42.3 6.6 8.0 5.7 4.1 1,033.6215.8 173.5 163.9 127.6 93.4 51.0 20.4 13.0 38.0 45.0 37.2 4.7 6.9 4.6 2.9 997.9210.1 160.1 132.2 102.1 82.4 41.8 15.9 12.0 40.3 50.4 42.6 5.6 8.4 4.6 2.7 911.4247.8 232.7 163.6 124.6 100.1 55.6 21.5 17.7 50.8 41.8 38.4 6.3 7.7 4.9 3.8 1,117.3271.0 253.8 223.3 172.9 125.3 75.2 26.7 17.9 66.2 66.7 51.8 10.0 11.4 5.6 5.1 1,383.6354.3 322.2 240.6 187.3 142.7 82.1 36.2 23.4 86.0 56.9 48.6 10.4 9.7 5.3 5.2 1,611.0Source: USDA Form FV193, Report <strong>of</strong> Inedible Content <strong>of</strong> <strong>Almond</strong> Receipts. Note: Totals may not add precisely due to rounding.
32 receipts BY COUNTY and variety 2008/09region county % crop NONPAREIL CARMEL MONTEREYBUTTE/PADREbuttefritzallothersallVARIETIESall others mariposa 0.00% 0 0 0 0 0 0 1,421 1,421Coast counties monterey 0.01% 55,217 16,374 0 0 0 5,495 8,540 85,626Butte 3.53% 23,024,948 6,231,146 747,121 2,095,317 4,435,379 178,645 20,188,960 56,901,516Colusa 5.34% 36,066,461 11,532,558 4,608,117 1,555,446 12,164,337 5,341,916 14,780,713 86,049,548Glenn 3.02% 22,310,420 6,393,328 1,019,411 978,647 5,770,280 326,812 11,782,986 48,581,884Sacramento 0.00% 23,277 1,517 0 0 0 16,375 9,714 50,883Solano 0.26% 2,123,183 286,598 66,930 64,841 844,953 11,975 732,332 4,130,812north valleySutter 0.33% 1,216,188 586,549 54,877 395,846 634,058 64,127 2,355,996 5,307,641Tehama 0.60% 4,731,484 1,216,923 148,361 417,977 1,268,616 0 1,949,737 9,733,098Yolo 0.64% 4,100,941 1,478,307 187,795 401,352 1,771,872 97,966 2,349,366 10,387,599Yuba 0.06% 474,364 21,164 0 0 27,584 5,684 440,266 969,062TOTALS 13.79% 94,071,266 27,748,090 6,832,612 5,909,426 26,917,079 6,043,500 54,590,070 222,112,043Fresno 20.00% 120,534,127 33,120,178 48,166,265 34,025,635 26,056,502 13,980,752 46,327,145 322,210,604Kern 21.99% 132,734,517 19,958,723 51,940,535 34,009,861 34,835,291 30,518,908 50,320,415 354,318,250Kings 1.45% 9,438,665 1,445,237 3,285,718 1,543,593 1,975,181 2,345,245 3,401,657 23,435,296Madera 8.86% 50,087,850 18,683,796 16,591,668 19,190,319 8,881,557 4,815,597 24,436,823 142,687,610south valley Merced 11.63% 63,271,959 33,353,792 14,288,868 15,563,103 15,565,660 7,547,838 37,731,360 187,322,580San Joaquin 5.10% 31,887,435 17,907,832 1,675,722 9,776,721 4,868,197 5,478,509 10,506,288 82,100,704Stanislaus 14.94% 90,598,083 47,741,726 13,979,182 25,354,430 12,389,252 9,407,824 41,167,397 240,637,894Tulare 2.24% 14,753,939 2,030,052 4,188,085 1,520,738 4,493,260 3,359,894 5,818,107 36,164,075TOTALS 86.21% 513,306,575 174,241,336 154,116,043 140,984,400 109,064,900 77,454,567 219,709,192 1,388,877,013all YTD TOTALS 100.00% 607,433,058 202,005,800 160,948,655 146,893,826 135,981,979 83,503,562 274,309,223 1,611,076,103Source: USDA Form FV193, Report <strong>of</strong> Inedible Content <strong>of</strong> <strong>Almond</strong> Receipts.
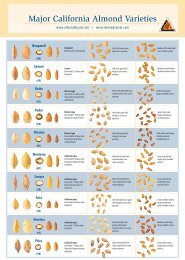
top ten almond varieties and acreage33TOP TEN ALMOND PRODUCING VARIETIES 2008/09TOTAL POUNDS IN MILLIONS7006005004003002001000607.3NONPAREIL202.0CARMEL161.0 146.9 136.0MONTEREY BUTTE/PADRE BUTTE83.5FRITZ128.242.2 37.2 34.6 32.1PADRE ALDRICH PRICE SONORA OTHERSource: <strong>Almond</strong> <strong>Board</strong> <strong>of</strong> <strong>California</strong>.TOP TEN ALMOND ACRES STANDING BY VARIETY 2008250244,327TOTAL PLANTED OR BEARINGACRES IN THOUSANDS2001501005089,42381,03661,56848,71532,63017,465 16,020 14,629 12,97146,792NONPAREILCARMELBUTTEMONTEREYPADREFRITZPRICESONORAMISSIONALDRICHALL OTHERSSource: National Agricultural Statistics Service, <strong>California</strong> Field Office (NASS/CFO).
34 ALMOND CROP ESTIMATES VS. ACTUAL RECEIPTSCROPYEAR90/9191/9292/9393/9494/9595/9696/9797/9898/9999/0000/0101/0202/0303/0404/0505/0606/0707/0808/0909/10ALMOND CROP ESTIMATES VS. ACTUAL RECEIPTS Million poundsOBJECTIVE FORECAST HANDLER RECEIPTS LOSS AND EXEMPTREDETERMINEDMARKETABLE WEIGHTSource: <strong>Almond</strong> <strong>Board</strong> <strong>of</strong> <strong>California</strong>. Objective forecast provided by USDA, National Agricultural Statistics Service, <strong>California</strong> Field Office (NASS/CFO).*Not available at time <strong>of</strong> publication. † Estimate.LBS. REJECTS IN RECEIPTS655.0 656.1 40.4 615.7 16.1460.0 485.9 22.7 463.2 15.3550.0 545.9 29.9 516.0 15.5470.0 488.2 18.2 470.0 9.8640.0 732.9 19.6 713.3 12.8310.0 366.7 14.4 352.3 10.4530.0 507.5 18.2 489.3 13.0680.0 756.5 19.7 736.8 14.3540.0 517.0 24.6 492.4 14.9830.0 829.9 34.4 795.5 9.3640.0 698.4 26.0 672.4 15.7850.0 824.1 29.3 794.8 16.7980.0 1,083.7 20.2 1,063.5 8.21,000.0 1,032.9 21.8 1,011.1 19.81,080.0 998.0 25.2 972.8 14.5880.0 911.7 23.0 888.7 16.01,050.0 1,116.7 28.9 1,087.8 24.01,330.0 1,383.0 24.7 1,358.3 17.21,500.0 1,614.6 42.7 1,571.9 13.91,350.0 * 40.5 † 1,309.5 † *
352,000ALMOND CROP FORECASTS VS. ACTUAL RECEIPTS 1989/90–2008/09OBJECTIVE FORECASTMILLION POUNDS1,5001,000500HANDLER RECEIPTS089/90CROP YEAR90/9191/9292/9393/9494/9595/9696/9797/9898/9999/0000/0101/0202/0303/0404/0505/0606/0707/0808/09PERCENTAGE VARIANCE20%15%10%5%0%-5%-10%ALMOND RECEIPTS VARIANCE FROM FORECAST 1989/90–2008/0915%15% 18%11%11%9%6%4%3%0% -1%0%-4% -4%-3%8%4% 6% 4%-8%89/90 90/91 91/92 92/93 93/94 94/95 95/96 96/97 97/98 98/99 99/00 00/01 01/02 02/03 03/04 04/05 05/06 06/07 07/08 08/09CROP YEARSource: <strong>Almond</strong> <strong>Board</strong> <strong>of</strong> <strong>California</strong>. Objective forecast provided by USDA, National Agricultural Statistics Service, <strong>California</strong> Field Office (NASS/CFO).
36 CALIFORNIA ALMOND ACREAGE AND FARM VALUEcalifornia almond acreage and farm valueacreage Yield value in DollarsCROPYEAR99/0000/0101/0202/0303/0404/0505/0606/0707/0808/09Bearing Non-Bearing Total New PlantingsBearing AcreYield (Lbs.)Production*(Million Lbs.)Farm PriceFarm Value($1,000)Value PerBearing Acre485,000 115,000 600,000 33,767 1,720 829.9 $0.86 $687,742 $1,418510,000 100,000 610,000 23,585 1,380 698.4 $0.97 $666,487 $1,307530,000 75,000 605,000 19,348 1,570 824.1 $0.91 $740,012 $1,396545,000 65,000 610,000 15,857 2,000 1,083.7 $1.11 $1,200,687 $2,203550,000 60,000 610,000 17,639 1,890 1,032.9 $1.57 $1,600,144 $2,909570,000 70,000 640,000 36,220 1,760 998.0 $2.21 $2,189,005 $3,840590,000 110,000 700,000 49,281 1,550 911.7 $2.81 $2,525,909 $4,281610,000 145,000 755,000 35,486 1,840 1,116.7 $2.06 $2,258,790 $3,703640,000 125,000 765,000 14,381 2,170 1,383.0 $1.75 $2,401,875 $3,753680,000 115,000 795,000 21,678 2,400 1,614.6 $1.40 $2,314,200 $3,403Source: USDA, National Agricultural Statistics Service, <strong>California</strong> Field Office (NASS/CFO). Note: <strong>Almond</strong> <strong>Board</strong> <strong>of</strong> <strong>California</strong> does not track prices.*Production numbers provided by <strong>Almond</strong> <strong>Board</strong> <strong>of</strong> <strong>California</strong>.
37CROP VALUE PER BEARING ACRE 1999/00–2008/09CROP VALUE PER ACRE$5,000$4,000$3,000$2,000$1,418 $1,307 $1,396$2,203$2,909$3,840$4,281$3,703 $3,753$3,403$1,000099/0000/0101/0202/0303/0404/0505/0606/0707/0808/09CROP YEARPRODUCTION VS. FARM PRICE* 1999/00–2008/092,000FARM PRICE$2.81$3.00MILLION POUNDS1,5001,000500MILLION POUNDS$.86 $.97$.91$1.11$1.57$2.21$2.06$1.75$1.40$2.50$2.00$1.50$1.00FARM PRICE099/00CROP YEAR00/0101/0202/0303/0404/0505/0606/0707/0808/09Source: USDA, National Agricultural Statistics Service, <strong>California</strong> Field Office (NASS/CFO).Note: <strong>Almond</strong> <strong>Board</strong> <strong>of</strong> <strong>California</strong> does not track prices. *Production numbers provided by <strong>Almond</strong> <strong>Board</strong> <strong>of</strong> <strong>California</strong>.$0.50
38 crop-size history vs. inedible percentageCROP-SIZE HISTORY VS. INEDIBLE PERCENTAGE 1999/09–2008/09CROP SIZE IN MILLION POUNDS2,0001,5001,00050002.26%1.12%99/00 00/012.02%1.92%0.76%01/02 02/03 03/041.46%04/051.76%05/06INEDIBLE GROSS % CROP SIZE2.15%1.24%0.87%06/07 07/08 08/092.5%2.0%1.5%1.0%0.5%INEDIBLE GROSS PERCENTAGECROP YEARSource: <strong>Almond</strong> <strong>Board</strong> <strong>of</strong> <strong>California</strong>.
UC farm advisors39uc farm advisorsButte CountyJoe Connell, UCCE Office2279 Del Oro Ave., Suite BOroville, CA 95965530.538.7201fax: 530.538.7140email: jhconnell@ucdavis.eduColusa CountyJohn Edstrom, UCCE OfficeP.O. Box 180100 Sunrise Blvd., Suite EColusa, CA 95932530.458.0570fax: 530.458.4625email: jpedstrom@ucdavis.eduFresno CountyJeanette Sutherlin, UCCE Office1720 South Maple Ave.Fresno, CA 93702559.456.7285fax: 559.456.7575email: jmsutherlin@ucdavis.eduGlenn CountyBill Krueger, UCCE OfficeP.O. Box 697821 E. South St.Orland, CA 95963530.865.1107fax: 530.865.1109email: whkrueger@ucdavis.eduKern CountyDarlene Liesch, UCCE Office1031 S. Mt. Vernon Ave.Bakersfield, CA 93307661.868.6200fax: 661.868.6208email: dgliesch@ucdavis.eduKings CountyBob Beede, UCCE Office680 N. Campus Dr., Suite AHanford, CA 93230559.582.3211, ext. 2737fax: 559.582.5166email: bbeede@ucdavis.eduMadera CountyBrent Holtz, UCCE Office328 Madera Ave.Madera, CA 93637559.675.7879, ext. 209fax: 559.675.0639email: baholtz@ucdavis.eduMerced CountyDavid Doll, UCCE Office2145 Wardrobe Ave.Merced, CA 95341209.385.7403fax: 209.722.8856email: dadoll@ucdavis.eduSan Joaquin CountyPaul Verdegaal, UCCE Office2101 E. Earhart Ave., Suite 200Stockton, CA 95206209.953.6100fax: 209.953.6128email: psverdegaal@ucdavis.eduSolano/Yolo CountiesCarolyn DeBuse, UCCE Office501 Texas St.Fairfield, CA 94533707.784.1320fax: 707.429.5532email: cjdebuse@ucdavis.eduStanislaus CountyRoger Duncan, UCCE Office3800 Cornucopia Way, Suite AModesto, CA 95358209.525.6800fax: 209.525.6840email: raduncan@ucdavis.eduSutter/Yuba CountiesFranz Niederholzer, UCCE Office142-A Garden Hwy.Yuba City, CA 95991530.822.7515fax: 530.673.5368email: fjniederholzer@ucdavis.eduTehama/Shasta CountiesRick Buchner, UCCE Office1754 Walnut St.Red Bluff, CA 96080530.527.3101fax: 530.527.0917email: rpbuchner@ucdavis.eduTulare CountyElizabeth J. Fichtner, UCCE Office4437 S. Laspina St., Suite BTulare, CA 93274559.684.3310fax: 559.685.3319email: ejfichtner@ucdavis.edu
40 usda standards for gradesUSDA Grades shelled (effective 3/24/97)WholeKernelsMinimumDiameter(in in.)DissimilarDoublesChip &ScratchForeignMaterialParticles& DustSplit &BrokenOtherDefectsSeriousDefectsUndersizeUS Fancy — — 5% 3% 5% .05% 0.1% 1% 2% 1% —US Extra No. 1 — — 5% 5% 5% .05% 0.1% 1% 4% 1.5% —US No. 1* — — 5% 15% 10% .05% 0.1% 1% 5% 1.5% —US SelectSheller RunUS StandardSheller Run— — 5% 15% 20% 0.1% 0.1% 5% 3% 2% —— — 5% 25% 35% 0.2% 0.1% 15% 3% 2% —US No. 1Whole & Broken30%20/64UOS † 5% 35% x 0.2% 0.1% x 5% 3% 5%US No. 1 Pieces x 8/64 x x x 0.2% 1.0% x 5% 3% 5%*US No. 1 is commonly referred to by industry as supreme. However, supreme is not a USDA grade. † UOS = unless otherwise specified.xNo limit established.Also included in “Other Defects.”Includes max. 2% under 20/64 inch.Includes max. 5% under 20/64 inch.% also included in “Chip & Scratch.”Sample Sizes pounds1 US ton = .907 metric ton1 metric ton = 2,204.6 pounds1 pound = 453.6 grams10 oz. = 283.5 gramsLot Size 10,000 10,000–44,000 >44,000Grams Drawn 2,000 4,000 6,000Grams Analyzed 1,000 2,000 3,000definitionsWHOLE KERNELS: Less than1/8 kernel chipped <strong>of</strong>f.CHIP AND SCRATCH: More than1/4 inch in diameter, except US fancywith 1/8 inch in diameter.SPLIT AND BROKEN: 7/8 or less<strong>of</strong> complete whole kernel at least1/8 inch in diameter.SERIOUS DEFECTS: Includesdecay, rancidity, insect injury,and damage by mold.INSECT: Insect, web, frass present,or definite evidence <strong>of</strong> feeding.other defectsGUM: More than 1/4 inchin diameter.SHRIVELING: Less than 3/4<strong>of</strong> pellicle filled.BROWN SPOT: More than1/8 inch in diameter.DISCOLORATION: More than1/2 <strong>of</strong> surface.
41USDA Grades in-shellmediumexternaldefectDissimilarundersizeforeignmaterialinternal(kernel)defectUS No. 1* 28/64 10% 5% 5% 2% 10%US No.1 Mixed 28/64 10% — 5% 2% 10%Additional 20% for discoloration <strong>of</strong> shell.Includes maximum 1% less than 24/64by weight. All others by count.Includes maximum 5% serious,no live insects in shell.US No. 2 28/64 10% 5% 5% 2% 10%US No. 2 Mixed 28/64 10% — 5% 2% 10%*US No. 1 is commonly referred to by industry as supreme. However, supreme is not a USDA grade.definitionsUS NO. 1: Similar varietal characteristics. Free from loose, extraneous, and foreign material. Shells are clean, fairly bright, fairly uniform in color, and free from damagecaused by discoloration, adhering hulls, broken shells, or other means. Kernels are well dried, free from decay, rancidity, damage caused by insects, mold, gum, skindiscoloration, shriveling, brown spots, or other means.LOOSE FOREIGN MATERIAL: 2%, including 1% passing through a 24/64 inch screen (this is also by weight).INTERNAL DEFECTS: 10%, including 5% serious damage.US NO. 1 MIXED: US No. 1 grade, except that two or more varieties are mixed.US NO. 2: Consists <strong>of</strong> almonds in the shell that meet the requirements <strong>of</strong> US No.1 grade, except that an additional tolerance <strong>of</strong> 20% shall be allowed for almonds withshells damaged by discoloration.US NO. 2 MIXED: Consists <strong>of</strong> almonds in the shell that meet the requirements <strong>of</strong> US No. 2 grade, except that two or more varieties <strong>of</strong> almonds are mixed.SIZE: Unless otherwise specified, 28/64 inch in thickness.
1150 Ninth St, Suite 1500Modesto, CA 95354 USAT: 209.549.8262F: 209.549.8267<strong>Almond</strong><strong>Board</strong>.com© <strong>2009</strong> <strong>Almond</strong> <strong>Board</strong> <strong>of</strong> <strong>California</strong>Printed in USA.Document #1116<strong>2009</strong>