Long-Range Dependence in WiMAX traffic. A Preliminary Analysis
Long-Range Dependence in WiMAX traffic. A Preliminary Analysis
Long-Range Dependence in WiMAX traffic. A Preliminary Analysis
- No tags were found...
Create successful ePaper yourself
Turn your PDF publications into a flip-book with our unique Google optimized e-Paper software.
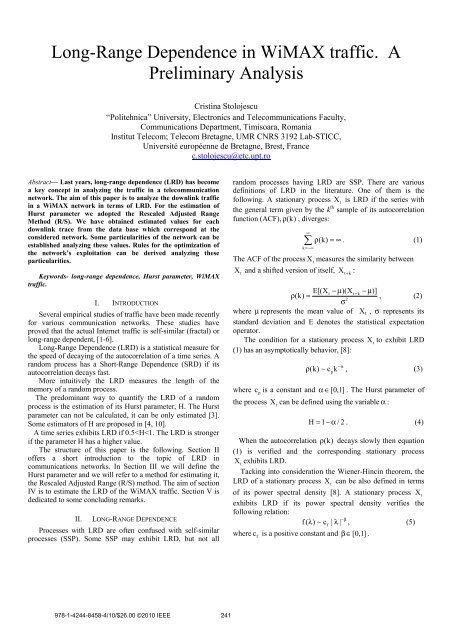
In this case the relation between the Hurst parameter H andβ is the follow<strong>in</strong>g:H = (1 +β )/2. (6)Previous work, [1-6] proved the utility of H for the analysis ofthe Internet <strong>traffic</strong>. In 1993 was identified the presence ofLRD <strong>in</strong> data sets captured on Ethernet Local Area Network(LAN) <strong>traffic</strong>, [8]. In the case of Ethernet LAN <strong>traffic</strong>, LRD ismanifested <strong>in</strong> the absence of a natural length of a `burst'; atevery time scale rang<strong>in</strong>g from a few milliseconds to m<strong>in</strong>utesand hours, bursts consist of bursty sub-periods separated byless bursty sub-periods. So, a cause of LRD is the hiddenperiodicities which are present <strong>in</strong> the time series analyzed. It isalso shown that the value of the Hurst parameter typicallydepends on the utilization level of the Ethernet and can beused to measure `burst<strong>in</strong>ess' of LAN <strong>traffic</strong>.In the literature, four possible orig<strong>in</strong>s for LRD <strong>in</strong> networksare commonly cited. These are as follows:(1) LRD is <strong>in</strong>herent directly <strong>in</strong> the source of data.(2) LRD is a result of the aggregation of heavy-tailed datastreams.(3) LRD is a result of feedback mechanisms <strong>in</strong> the TCPprotocol.(4) LRD arises from network topology.These causes are expla<strong>in</strong>ed <strong>in</strong> detail below. It is important toemphasize that these explanations are not contradictory. Eachmight make a contribution to the packet <strong>traffic</strong> behavior of thenetwork.(1) The evidence that LRD arises directly <strong>in</strong> the source of datacomes ma<strong>in</strong>ly from studies of video <strong>traffic</strong>. Variable-bit-rate(VBR) video <strong>traffic</strong> by its nature exhibits LRD at source. TheLRD, <strong>in</strong> this case, arises from an encod<strong>in</strong>g mechanismwhereby video is encoded as a series of differences betweenframes with occasional full updates. Measurements of Internet<strong>traffic</strong> show that real time video <strong>traffic</strong> is likely to be only avery small percentage of Internet <strong>traffic</strong>. It seems unlikely,therefore, that VBR video <strong>traffic</strong> could be the ma<strong>in</strong> componentof LRD observed <strong>in</strong> aggregate traces. Of course, if VBR video<strong>traffic</strong> conta<strong>in</strong>s LRD at source then it is likely that otherapplications might have <strong>traffic</strong> distributions with unexpectedstatistical effects.(2) The proposal that LRD <strong>in</strong> Internet <strong>traffic</strong> arises from theaggregation of heavy-tailed data streams is similar to thepreviously mentioned mechanism but has a slightly less directcausal mechanism. A causal connection between heavy-tailedsources and LRD was long suspected and f<strong>in</strong>ally was proven.There are good reasons to believe that source <strong>traffic</strong> on theInternet is heavy-tailed file sizes and sizes of accessed webdocuments have been shown to have heavy tails.(3) Another potential cause of LRD is the feedbackmechanisms <strong>in</strong> the Transmission Control Protocol (TCP).Markov cha<strong>in</strong>s were used to model TCP timeout andcongestion w<strong>in</strong>dow behavior and it was proved that these cancause local LRD (that is, LRD up to a certa<strong>in</strong> time scale).(4) F<strong>in</strong>ally, there rema<strong>in</strong>s the dist<strong>in</strong>ct possibility that LRD isan emergent property of the networks themselves.Measurements made have shown that, even when packet <strong>in</strong>terdeparturetimes are <strong>in</strong>dependent, arrival times at thedest<strong>in</strong>ation show LRD. This obviously <strong>in</strong>dicates that roundtrip times <strong>in</strong> networks are LRD processes.Determ<strong>in</strong><strong>in</strong>g the orig<strong>in</strong> of LRD <strong>in</strong> Internet networks rema<strong>in</strong>san important research area and it is uncerta<strong>in</strong> which (if any) ofthese four causes is really at the heart of the problem. Thepossibility rema<strong>in</strong>s that it is a mixture of some or all of them.The aim of this paper is to apply the LRD analysis <strong>in</strong> the caseof a relatively new network technology. The <strong>WiMAX</strong>technology was applied recently. We have not found <strong>in</strong> theliterature studies about the LRD of the <strong>traffic</strong> of <strong>WiMAX</strong>networks. Possess<strong>in</strong>g a data base conta<strong>in</strong><strong>in</strong>g traces for a<strong>WiMAX</strong> network we considered useful to estimate their LRD.We have chosen the downl<strong>in</strong>k <strong>traffic</strong> to take <strong>in</strong>to account allthe sources of LRD. A simplified analysis could be done forthe upl<strong>in</strong>k <strong>traffic</strong>, when some sources of LRD can beelim<strong>in</strong>ated. Indeed video <strong>traffic</strong> does not exist <strong>in</strong> upl<strong>in</strong>k. Thefeedback mechanisms <strong>in</strong> the TCP protocol does not manifest<strong>in</strong> upl<strong>in</strong>k. The present prelim<strong>in</strong>ary LRD analysis of the<strong>WiMAX</strong> <strong>traffic</strong> will take <strong>in</strong>to account all the four sources ofLRD, already denoted by (1) - (4). From a network designerpo<strong>in</strong>t of view the most <strong>in</strong>terest<strong>in</strong>g LRD is that denoted by (4).III. THE ESTIMATION OF HURST PARAMETERThe degree of LRD <strong>in</strong>creases as H↑1, [7]. A value of Hequal to 0.5 or smaller <strong>in</strong>dicates the lack of LRD or thepresence of SRD, [2].There are various statistical techniques to estimate H. Wecan classify the estimators of H <strong>in</strong>to two general categories,[4]:1. the estimators operat<strong>in</strong>g <strong>in</strong> the time doma<strong>in</strong>, whichcan be computed us<strong>in</strong>g the follow<strong>in</strong>g methods:and,• absolute value method,• variance method,• rescaled adjusted range (R/S) method,2. the estimators operat<strong>in</strong>g <strong>in</strong> the frequency or waveletdoma<strong>in</strong>, which can be computed us<strong>in</strong>g the follow<strong>in</strong>gmethods:• periodogram,• Whittle estimator, [10],• proposed by Abry-Veitch, [2].In the follow<strong>in</strong>g we will use the R/S method to estimate theHurst parameter.A. R/S methodThe R/S analysis was proposed by Hurst <strong>in</strong> 1951. Given asample of observations Xk, with k = 1,...,N, we must subdividethe whole sample <strong>in</strong>to K non-overlapp<strong>in</strong>g blocks and calculatethe rescaled adjusted range R(ti,n) / S(ti,n) for each of thenew "start<strong>in</strong>g po<strong>in</strong>ts" t 1= 1; t2= N/K+ 1; t3= 2N/K+ 1;…and for the variable n which satisfy ( (ti− 1) + n ≤ N ). R242
epresents a range series, while S is the standard deviationseries. Represent<strong>in</strong>g log( R(ti, n) / S(ti, n) ) versus log(n) isobta<strong>in</strong>ed the R/S plot. It is a straight l<strong>in</strong>e with the slope equalwith the Hurst exponent, [9].IV. RESULTSThis section presents the evaluation of H with the aid of theR/S method <strong>in</strong> the case of <strong>WiMAX</strong> <strong>traffic</strong>. Its goal is tohighlight the particularities of <strong>WiMAX</strong> <strong>traffic</strong> from a LRDperspective.A. Data baseIn the follow<strong>in</strong>g we will use historical data obta<strong>in</strong>ed bymonitor<strong>in</strong>g the <strong>traffic</strong> from 67 Base Stations (BS) compos<strong>in</strong>g a<strong>WiMAX</strong> network. The period of collection is of eight weeks,from March 17th till May 11th, 2008. Each BS has its own dataset which is composed of numerical values represent<strong>in</strong>g thetotal number of packets from the downl<strong>in</strong>k channel. We haveselected the downl<strong>in</strong>k connection tack<strong>in</strong>g <strong>in</strong>to account theconsiderations made at the end of section II.The value of the <strong>in</strong>terval between two consecutive recordeddata is of 15 m<strong>in</strong>utes. It can be easily deduced that for a givenBS we have the follow<strong>in</strong>g number of samples: 96 samples/day,672 samples/week and a total number of 5376 samples.B. Evaluation of HWe used for our experiments SELFIS (SELF-similarityanalysIS), a java-based software tool for self-similarity andlong-range dependence analysis, developed by T. Karagiannisand M. Faloutsos [3].As a first experiment we calculated the value of R/Sestimator for all the 67 time series, correspond<strong>in</strong>g to all BSs.The results are presented <strong>in</strong> Table I.TABLE I. H VALUES FOR THE TIME SERIES CORRESPONDING TO ALL 67BASE STATIONS.BS H BS H1 0,693 35 0,6782 0,628 36 0,7293 0,658 37 0,6674 0,682 38 0,6265 0,691 39 0,7196 0,676 40 0,6977 0,606 41 0,6988 0,665 42 0,7569 0,665 43 0,62210 0,643 44 0,6611 0,657 45 0,68112 0,689 46 0,64113 0,656 47 0,5614 0,692 48 0,60815 0,645 49 0,61816 0,641 50 0,70417 0,706 51 0,66718 0,641 52 0,62919 0,618 53 0,70320 0,657 54 0,62821 0,657 55 0,65422 0,6 56 0,63623 0,723 57 0,60324 0,706 58 0,59125 0,717 59 0,66926 0,679 60 0,64827 0,74 61 0,66428 0,656 62 0,66129 0,665 63 0,58130 0,619 64 0,63131 0,637 65 0,65732 0,719 66 0,72733 0,653 67 0,628We can observe that the values of H are between 0.57 and0.756, so Hurst parameter belongs to the theoretical <strong>in</strong>tervalthat proves the presence of LRD ( H ∈ [0.5,1]). The mean valueof H equals 0.66.Next, we have chosen a certa<strong>in</strong> BS (for example BS 61) andwe have split the time series <strong>in</strong>to weeks. We have obta<strong>in</strong>edeight new time series and for each of these series we havecalculated the new values of H. In this case the m<strong>in</strong>imum valueequals 0.472, while the maximum value is equal to 0.649. Sowe can conclude that all the values of H are smaller than themean value of the entire series (composed by the eight weeks).This observation can be expla<strong>in</strong>ed by the presence of a hiddenperiodicity <strong>in</strong>to the entire series. The correspond<strong>in</strong>g period ishigher or equal with the duration of a week because the LRDscorrespond<strong>in</strong>g to each week are smaller.F<strong>in</strong>ally, we will split aga<strong>in</strong> the series, this time comput<strong>in</strong>gH for series conta<strong>in</strong><strong>in</strong>g daily values. The values for the firstweek, for BS 61 are presented <strong>in</strong> Table II.TABLE II.H VALUES FOR THE 7 DAYS COMPOSING A WEEKDayR/S1 0,3852 0,5233 0,4294 0,3255 0,3966 0,4737 0,891Analyz<strong>in</strong>g the results, we observe that the values of H aresmaller that the mean value per week. There is an anomaly <strong>in</strong>the case of the 7 th day expla<strong>in</strong>ed by the fact that <strong>in</strong> this serieswe have detected the presence of thirty values of 0, whichproduced an error of estimation. This comportment can beattributed to the presence of a hidden periodicity <strong>in</strong>to the series243
with the duration of one week. The correspond<strong>in</strong>g period musthave a value higher or equal with the duration of a day. Wehave identified this periodicity <strong>in</strong> the follow<strong>in</strong>g experiment.We have computed the power spectral densities (PSD) for thetime series correspond<strong>in</strong>g to every week of the entire series forBS 61 (see table III) <strong>in</strong> order to verify the existence ofperiodicities. The concentration of the PSD around a specificharmonic <strong>in</strong>dicates a periodicity with a period correspond<strong>in</strong>g tothe frequency of that harmonic. All the PSDs correspond<strong>in</strong>g toevery week of the entire series for BS61 are concentratedaround the eighth harmonic. The amplitudes of the eighthharmonic of those series are presented on the second column oftable III. So, the dom<strong>in</strong>ant period across all traces is the 24hours one. Hence the reduction of the weekly LRD is expla<strong>in</strong>edby the daily periodicity.TABLE III.PSD CORRESPONDING TO EVERY WEEK FOR A BSARBITRARILY SELECTED.Week PSD (*10 14 )1 1,24 4,25 12,22 3,58 203 2,56 57 2,4Another <strong>in</strong>terest<strong>in</strong>g observation relat<strong>in</strong>g Table II is that themajority of the values from the second column are <strong>in</strong>ferior to0.5, <strong>in</strong>dicat<strong>in</strong>g that the LRD was completely elim<strong>in</strong>ated.V. CONCLUSIONSThe goal of this paper is to realize a long-range dependenceanalysis for <strong>WiMAX</strong> <strong>traffic</strong>. We have shown that <strong>WiMAX</strong><strong>traffic</strong> exhibit LRD by estimat<strong>in</strong>g Hurst parameter us<strong>in</strong>g R/Smethod. We proved that LRD depends on the duration of thetime series. The entire series exhibits stronger LRD than eachweekly series. In the same way we demonstrated that the valueof Hurst parameter for each of the seven daily series is smallerthan the H value correspond<strong>in</strong>g to the given weekly series.This comportment can be expla<strong>in</strong>ed by the presence of somehidden periodicities. We have highlighted a periodicity withthe period equal with the duration of a day. The presence ofanother periodicity with period equal with the duration of aweek can be also supposed. These periodicities are aconsequence of social reasons and not of technical reasons.The network is more exploited dur<strong>in</strong>g the day and lessexploited dur<strong>in</strong>g the night; the network is less exploited dur<strong>in</strong>gthe weekends. We have also proved that the daily seriesassociated to BS 61 does not manifest LRD. The LRD sources(1)-(4) are not present <strong>in</strong> the case of BS 61. In consequencethe BS 61 has a good localization <strong>in</strong> the topology of the<strong>WiMAX</strong> network under study. This procedure can be appliedto all the BSs which compose the considered network<strong>in</strong>dicat<strong>in</strong>g those with bad localization. This way, the networktopology can be corrected. Other improvement strategies forthe considered <strong>WiMAX</strong> network could be imag<strong>in</strong>ed after theLRD analysis of the upl<strong>in</strong>k <strong>traffic</strong>. The analysis reported hereis only prelim<strong>in</strong>ary. It will be completed <strong>in</strong> the future by theaddition of a part dedicated to the upl<strong>in</strong>k <strong>traffic</strong>.ACKNOWLEDGMENTThe research reported <strong>in</strong> this paper was developed <strong>in</strong> theframework of a grant of the Romanian Research Council(CNCSIS) with the title “Us<strong>in</strong>g Wavelets Theory for DecisionMak<strong>in</strong>g” no. 349/13.01.09. The authors thank Alcatel Lucent,Timisoara, for provid<strong>in</strong>g the <strong>WiMAX</strong> <strong>traffic</strong> data base and forhelpful discussions around <strong>WiMAX</strong> network.REFERENCES[1] Kihong Park and Walter Will<strong>in</strong>ger. “Self-Similar Network Traffic: AnOverview.”, Technical Report, 1999.[2] P. Abry and D. Veitch. “Wavelet analysis of long range dependent<strong>traffic</strong>”, IEEE Trans. Information Theory, 1998, volume 44(1), pages "2-15".[3] Thomas Karagiannis, Michalis Faloutsos, “SELFIS: A Tool For Self-Similarity and <strong>Long</strong>-<strong>Range</strong> <strong>Dependence</strong> <strong>Analysis</strong>”, 1st Workshop onFractals and Self-Similarity <strong>in</strong> Data M<strong>in</strong><strong>in</strong>g: Issues and Approaches (<strong>in</strong>KDD), Edmonton, Canada, July 23, 2002.[4] Thomas Karagiannis, Mart Molle, Michalis Faloutsos, “<strong>Long</strong>-rangedependence: Ten years of Internet <strong>traffic</strong> model<strong>in</strong>g”, IEEE InternetComput<strong>in</strong>g. Special Issue - Measur<strong>in</strong>g the Internet, September 2004.[5] Ulanovs P. and Petersons E., “ Model<strong>in</strong>g methods of self-similar <strong>traffic</strong>for Network performance evaluation”, Scientifc Proceed<strong>in</strong>gs of RTU.Series 7, Telecommunications and Electronics, 2002.[6] S. Ostr<strong>in</strong>g, and H. Sirisena. The Influence of <strong>Long</strong>-range <strong>Dependence</strong> onTraffic Prediction. IEEE International Conference on Communications,ICC 2001, vol. 4, pp "1000-1005".[7] G. Rutka, “ Neural Network Models for Internet Traffic Prediction”,Proceed<strong>in</strong>gs of Electronics and Electrical Eng<strong>in</strong>eer<strong>in</strong>g, Lithuania,Kaunas, 2006, volume 4(68), pp. 55-58.[8] Richard G. Clegg, “The Statistics of Dynamic Networks”, Technical Report,University of York, Department of Mathematics, 2004.[9] W. Leland, M. Taqqu, W. Will<strong>in</strong>ger, and D. Wilson, “On the self-similarnature of ethernet <strong>traffic</strong>”, Proceed<strong>in</strong>gs of ACM SIGCOMM 93, 1993,pp 183-193.[10] M. S. Taqqu, and V. Teverovsky, “On Estimat<strong>in</strong>g the Intensity of <strong>Long</strong>-<strong>Range</strong> <strong>Dependence</strong> <strong>in</strong> F<strong>in</strong>ite and Inf<strong>in</strong>ite Variance Time Series. APractical Guide to Heavy Tails”, Statistical Techniques andApplications, R. J.Alder, R. E. Feldman and M.S. Taqqu, Ed.,Birkhauser, Boston, 1998, pp. 177-217.244


