What's New in ENPEP-BALANCE Version 2.20 (pdf)
What's New in ENPEP-BALANCE Version 2.20 (pdf)
What's New in ENPEP-BALANCE Version 2.20 (pdf)

Create successful ePaper yourself
Turn your PDF publications into a flip-book with our unique Google optimized e-Paper software.
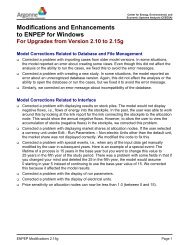
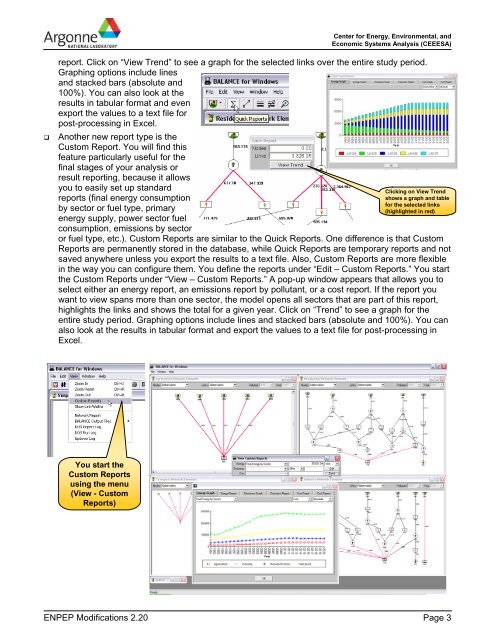
Center for Energy, Environmental, andEconomic Systems Analysis (CEEESA)report. Click on “View Trend” to see a graph for the selected l<strong>in</strong>ks over the entire study period.Graph<strong>in</strong>g options <strong>in</strong>clude l<strong>in</strong>esand stacked bars (absolute and100%). You can also look at theresults <strong>in</strong> tabular format and evenexport the values to a text file forpost-process<strong>in</strong>g <strong>in</strong> Excel.Another new report type is theCustom Report. You will f<strong>in</strong>d thisfeature particularly useful for thef<strong>in</strong>al stages of your analysis orresult report<strong>in</strong>g, because it allowsyou to easily set up standardreports (f<strong>in</strong>al energy consumptionby sector or fuel type, primaryenergy supply, power sector fuelconsumption, emissions by sectoror fuel type, etc.). Custom Reports are similar to the Quick Reports. One difference is that CustoClick<strong>in</strong>g on View Trendshows a graph and tablefor the selected l<strong>in</strong>ks(highlighted <strong>in</strong> red)mReports are permanently stored <strong>in</strong> the database, while Quick Reports are temporary reports and notsaved anywhere unless you export the results to a text file. Also, Custom Reports are more flexible<strong>in</strong> the way you can configure them. You def<strong>in</strong>e the reports under “Edit – Custom Reports.” You startthe Custom Reports under “View – Custom Reports.” A pop-up w<strong>in</strong>dow appears that allows you toselect either an energy report, an emissions report by pollutant, or a cost report. If the report youwant to view spans more than one sector, the model opens all sectors that are part of this report,highlights the l<strong>in</strong>ks and shows the total for a given year. Click on “Trend” to see a graph for theentire study period. Graph<strong>in</strong>g options <strong>in</strong>clude l<strong>in</strong>es and stacked bars (absolute and 100%). You canalso look at the results <strong>in</strong> tabular format and export the values to a text file for post-process<strong>in</strong>g <strong>in</strong>Excel.You start theCustom Reportsus<strong>in</strong>g the menu(View - CustomReports)<strong>ENPEP</strong> Modifications <strong>2.20</strong> Page 3