Presentation - Urban Compass
Presentation - Urban Compass
Presentation - Urban Compass

You also want an ePaper? Increase the reach of your titles
YUMPU automatically turns print PDFs into web optimized ePapers that Google loves.
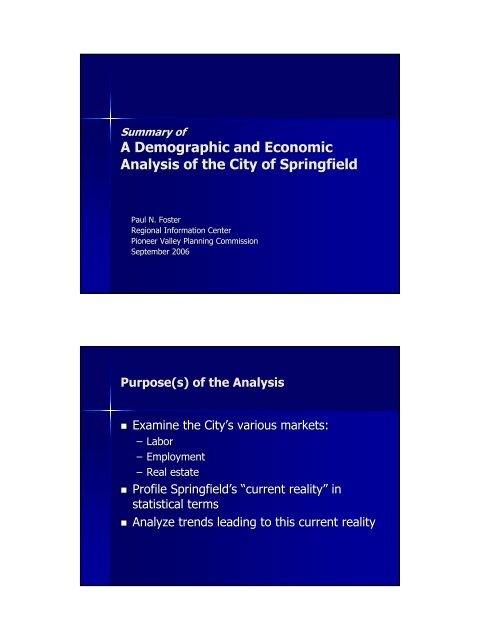
Summary ofA Demographic and EconomicAnalysis of the City of SpringfieldPaul N. FosterRegional Information CenterPioneer Valley Planning CommissionSeptember 2006Purpose(s) of the Analysis• Examine the City’s various markets:– Labor– Employment– Real estate• Profile Springfield’s “current reality” instatistical terms• Analyze trends leading to this current reality
Components of the Analysis1. Analysis of the basic data:• Demographics• Economics• Education• Real estate2. Analysis of labor supply and demand3. Analysis of Springfield relative to peer cities• Peer cities are those:• Of a similar size with respect to population (+/- 20,000); and,• That are the central cities of their respective metropolitan areas.as.• Dayton, Ohio; Eugene, Oregon; Fort Lauderdale, Florida;Huntsville, Alabama; Syracuse, New York; Tallahassee, Florida;Worcester, Massachusetts.• Hartford, Connecticut was included for comparative purposes as a“sister city” to Springfield, though Hartford is not as large.Overview of this <strong>Presentation</strong>• Key Findings– Demographics– Education– Labor Supply and Demand– Business and Industry– Real Estate– Peer Cities Analysis• Summary of Strengths and Weaknesses
Key Findings:DemographicsSpringfield has a very young populationPercent of the Population by Age, 200485 and over80 to 8475 to 7970 to 7465 to 6960 to 6455 to 5950 to 5445 to 4940 to 4435 to 3930 to 3425 to 2920 to 2415 to 1910 to 145 to 9Under 5SpringfieldMassachusetts0% 2% 4% 6% 8% 10%Source: U.S. Census Bureau, American Community Survey.
Springfield’s youth population isprimarily Black and HispanicSpringfield's Population by Age and Race, 200470,00060,00011,13950,00040,00030,00020,00010,000017,5811,8357,3592,75418,5706,4878,81413,0254,8355,2553,53016,33610,838 10,037White Black Hispanic65 and older45 to 6425 to 4418 to 24Under 18Source: U.S. Census Bureau, American Community Survey.Nearly one-third of Springfield residentsspeak a language other than English athomePercent of Population by Language Spoken at Home, 2004French1.8%Spanish23.9%Vietnamese1.9%Other3.8%English68.6%Source: U.S. Census Bureau, American Community Survey.
The economic fortunes of Springfield’shouseholds have been declining sincethe 1970s$70,000Median Family Income in Constant 1999 Dollars$60,000$50,000$40,000$30,000$20,000MassachusettsSpringfieldMetropolitan AreaCity of Springfield$10,000$01969 1979 1989 1999Source: U.S. Census Bureau, 2000, 1990, 1980, and 1970 Census.Key Findings:Education
The gap between Springfield andMassachusetts students in passing theMCAS is narrowing, but remains10th Grade Math MCAS10th Grade ELA MCAS100%100%90%90%80%80%70%70%60%60%50%50%40%40%30%30%20%20%10%10%0%2001 2002 2003 2004 20050%2001 2002 2003 2004 2005MassachusettsSpringfieldMassachusettsSpringfieldSource: Massachusetts Department of Education.Less than 80 percent of Springfieldteachers were licensed in their teachingassignment in 2005-20062006Percent of Teachers Licensed in their Teaching Assignment,2005-20060% 20% 40% 60% 80% 100%MassachusettsAgawamChicopeeEast LongmeadowHolyokeLongmeadowSpringfieldWest SpringfieldWilbrahamSource: Massachusetts Department of Education.
The city’s higher education institutionsare producing graduates in some but notall key growth fieldsAreaPercent of All Degrees Awarded by Springfield Institutions in Key y EconomicGrowth Fields, 2003-20042004Biological sciencesPercent ofAAs0.5%Percent ofBAs1.9%TotalDegrees41Business17.1%15.6%431Computer and information sciences9.0%0.9%81Engineering or engineering tech.17.3%2.7%177Health professions20.4%7.3%289Mathematics0.1%0.8%16Physical sciences0.1%0.3%7Fields accounting for less than 5% of granted degreesSource: U.S. Department of Education, Integrated Postsecondary Education Data System.Key Findings:Labor Supply and Demand
The unemployment rate of Springfieldresidents is persistently higher than thatMassachusetts residents as a wholeUnemployment Rate0.140.120.10.080.06MassachusettsSpringfield0.040.0201990 1992 1994 1996 1998 2000 2002 2004Source: U.S. Bureau of Labor Statistics, Local Area Unemployment Statistics.Springfield residents’ level of educationmay limit employment options in thenew economyPercent of Adults (25+) with a Bachelors Degree, 200540%35%30%25%20%15%10%5%0%35.6%Massachusetts19.5%SpringfieldSource: U.S. Census Bureau, American Community Survey.
Springfield residents are concentrated inlow-wage wage occupations relative toHampden County residentsConcentrations of Springfield Residents• Air transportation workers• Supervisors, transportation andmaterial moving workers• Nursing, psychiatric, and homehealth aides• Material moving workers exceptlaborers and material movers, hand• Special education teachers• Electricians• Building and grounds cleaning andmaintenance• Life and physical scientists• Media and communicationequipment workers• CashiersConcentrations of Hampden CountyResidents• Advertising, marketing, publicrelations, and sales managers• Top executives• Motor vehicle operators except busand truck drivers• Librarians, curators, and archivists• Social scientists and relatedworkers• Accountants and auditors• Waiters and waitresses• Construction trades workers exceptcarpenters, electricians, painters,plumbers, and construction• Financial managers• Occupational and physicaltherapist assistants and aidesSource: U.S. Census Bureau, American Community Survey.In growth sectors, Springfield residentstend to be employed in low-wagewageoccupations: the case of health carePercent of Health Care Workers by Occupation, 2004Health technologists and techniciansOther health diagnosing and treating practitioners andtechnical occupationsTherapistsRegistered nursesPhysicians and surgeonsOther healthcare support occupationsOccupational and physical therapist assistants andaidesNursing, psychiatric, and home health aides21.5%15.2%5.7%3.1%8.8%7.1%20.7%9.7%2.9%1.9%11.3%12.4%1.6%0.7%27.5%50.0%0% 10% 20% 30% 40% 50% 60%SpringfieldHampden CountySource: U.S. Census Bureau, American Community Survey.
Key Findings:Business and IndustrySpringfield is home to more than one-quarter of the region’s jobs and one-fifthof the region’s industrial landPercent of Pioneer ValleyIndustrial Land that is inSpringfield, 1999Percent of Pioneer ValleyEmployment that is inSpringfield, 2005Springfield20.2%Springfield26.8%Region79.8%Region73.2%Source: Massachusetts Executive Office of Environmental Affairs, Office of Geographic and Environmental Information, Land Use SummaryStatistics from the Resource Mapping Project at the University of Massachusetts Amherst; Massachusetts Department of WorkforceDevelopment, Quarterly Census of Employment and Wages.
Utility costs for businesses in Springfieldare low relative to the Boston areaWater Rates per 100 Cubic FeetFY 2007Default Rates for Electric ServiceCents per KwH, , June 2006SpringfieldBostonSpringfieldBostonResidential9.3510.59Residential/Commercial$1.60$3.24Commercial9.5410.66Industrial$0.80$3.24Industrial9.609.68Source: Springfield Water and Sewer Commission; Boston Water and Sewer Commission; Massachusetts Department of Telecommunicationsand Energy, Default Service Rates.Key Findings:Real Estate
There is abundant vacant housing inSpringfield2,500Number of Unexplained Vacant Housing Units in Springfield2,0001,5001,00050002001 2002 2003 2004Unexplained vacant units are those that are vacant and are NOT:for sale, for rent, for seasonal use, or for migrant workers.Source: U.S. Census Bureau, American Community Survey.A majority of Springfield’s housing stockis in multi-family buildingsPercent of Housing Units by Building Size, 200410 to 49 Units6.7%5 to 9 Units8.9%50 or more Units6.3%3 or 4 Family11.1%1-Family46.2%2-Family20.8%Source: U.S. Census Bureau, American Community Survey.
The cost of housing in Springfield is lowcompared to the wider region and to thenationMedian Sale Price of Single FamilyHomes, 2005LongmeadowWilbrahamEast LongmeadowAgawamLudlowWest SpringfieldHolyoke$330,000$269,500$230,000$209,900$195,000$193,950$165,900Median Sale Price of a SingleFamily Home by Metro Area, 2005Fort Lauderdale, FLregionWorcester, MA regionHartford, CT regionSpringfield, MA regionEugene, OR regionTallahassee, FL region$370,100$290,700$253,300$201,800$197,600$167,600Chicopee$162,000Dayton, OH region$119,700Springfield$135,000Syracuse, NY region$110,600Note: Regional Data Used HereSource: The Warren Group; National Association of Realtors.Prices are rising as Springfield’s housingmarket is pressured by prices in theregion and stateMedian Price of a Single-Family Home in Springfield (in 2005 $)$180,000$160,000$140,000$120,000$100,000$80,000$60,000$40,000$20,000$01988 1990 1992 1994 1996 1998 2000 2002 2004Source: The Warren Group.
Springfield has lower office space pricesthan the rest of the region and vacancyrates are declining for all classesSpringfield Office Space Vacancy Rates by Class60%50%40%30%20%Class CClass BClass A10%0%1994 1995 1996 1997 1998 1999 2000 2001 2002 2003Source: Colebrook Realty Group.Springfield’s commercial and industrialreal estate market is mostly movingsmaller properties250,000Average Square Footage of Buildings in Springfield, 2006200,000150,000100,000Properties Sold inthe Last YearPropertiesCurrently Listed50,0000Commercial Industrial Office WarehouseSource: PVPC analysis of information downloaded from www.loopnet.com.
Key Findings:Peer Cities AnalysisThe percentage of residents, especiallychildren, living in households with belowpoverty incomes is very highTotal and Child Poverty Rates, 20000% 10% 20% 30% 40% 50%Dayton, OHEugene, ORFort Lauderdale, FLHuntsville, ALSpringfield, MASyracuse, NYChildrenTotalTallahassee, FLWorcester, MAHartford, CTHartford is included not for its comparable size, butbecause of its status as Springfield’s “sister city.”Source: U.S. Census Bureau, 2000 Census.
Springfield’s homicide rate is high, butnot the highestHomicide Rate (Homicides per 100,000 People), 2004-20050.00 2.00 4.00 6.00 8.00 10.00Dayton, OHEugene, ORFort Lauderdale, FLHuntsville, ALSpringfield, MASyracuse, NYTallahassee, FLWorcester, MAHartford, CTHartford is included not for its comparable size, butbecause of its status as Springfield’s “sister city.”Source: Federal Bureau of Investigation, Uniform Crime Reports.The Springfield area has relatively lowaverage annual wages, making theregion competitive nationallyAverage Annual Private Sector Wages by County, 2004$0 $10,000 $20,000 $30,000 $40,000 $50,000 $60,000Dayton, OHEugene, ORFort Lauderdale, FLHuntsville, ALSpringfield, MASyracuse, NYTallahassee, FLWorcester, MAHartford, CTHartford is included not for its comparable size, butbecause of its status as Springfield’s “sister city.”Note: Regional Data Used HereSource: U.S. Bureau of Labor Statistics, Quarterly Census of Employment and Wages.
The Springfield area has seen dramaticestablishment growth, suggesting newsmall businesses may be key to growthDayton, OHEugene, ORFort Lauderdale, FLHuntsville, ALSpringfield, MASyracuse, NYTallahassee, FLWorcester, MAHartford, CTPercent Change in Number of Business Establishments2003 to 2004-3% -2% -1% 0% 1% 2% 3% 4% 5% 6%Hartford is included not for its comparable size, butbecause of its status as Springfield’s “sister city.”Note: Regional Data Used HereSource: U.S. Bureau of Labor Statistics, Quarterly Census of Employment and Wages.Summary of Strengths• Youthful population• Variety of higher-education education institutions• One-quarter of regional employment• Low annual wages relative to the state and nation• Increasing employment in key growth industries (educationand health services particularly)• Extensive establishment growth, suggesting small businessactivity and entrepreneurship• Low-cost housing with a variety of types of housing• A rising housing market (sales and prices)• Available capacity and low prices for office space• Low cost for utilities relative to other parts of the state
Summary of Weaknesses• High poverty rates and declining family incomes• Low rates of higher educational attainment among adults• Educational performance among Springfield students that lagsbehind the state• Limited numbers of graduates from Springfield colleges withdegrees in growth fields• Violent crime rates out-ofof-scale with the city’s size• Concentration of residents in low-wage, wage, low-skill occupations• Residents and commuters shopping outside the cityFinal Observations• The strength of Springfield’s businesses andinstitutions crosses municipal boundaries andbenefits the entire region.• Concentrated poverty among Springfield’s residentscreates challenges only faced within municipalboundaries.• How can the city’s strengths, which already widelybenefit the region, be harnessed to better benefitSpringfield’s residents?
Sources of Data• Boston Water and Sewer Commission• Bradley International Airport• Colebrook Realty Group, Office Space Surveys• Federal Bureau of Investigation, UniformCrime Reports• InfoUSA database• Massachusetts Department of Education• Massachusetts Department of Revenue• Massachusetts Department of WorkforceDevelopment, Local Area UnemploymentStatistics• Massachusetts Department ofTelecommunications and Energy• Massachusetts Department of WorkforceDevelopment, Quarterly Census ofEmployment and Wages• Massachusetts Executive Office ofEnvironmental Affairs, Office of Geographicand Environmental Information, Land UseSummary Statistics from the ResourceMapping Project at the University ofMassachusetts Amherst• National Association of Realtors• Pioneer Valley Christian School• Pioneer Valley Montessori School• Pioneer Valley Planning Commission,Brownfields inventory; Pioneer Valley PlanningCommission, Regional Transportation Plan• Springfield Diocese of the Catholic Church• Springfield Water and Sewer Commission• The MacDuffie School• The Warren Group, TownStats• U.S. Bureau of Economic Analysis, RegionalEconomic Information System• U.S. Bureau of Labor Statistics, 2014Occupational Employment Projections• U.S. Bureau of Labor Statistics, Local AreaUnemployment Statistics• U.S. Bureau of Labor Statistics, QuarterlyCensus of Employment and Wages• U.S. Census Bureau, American CommunitySurvey• U.S. Census Bureau, Decennial Census’ (1970,1980, 1990, & 2000)• U.S. Department of Education, IntegratedPostsecondary Education Data System• U.S. Department of Housing and <strong>Urban</strong>Development, State of the Cities Data System• City of Worcester, Massachusetts• www.loopnet.com