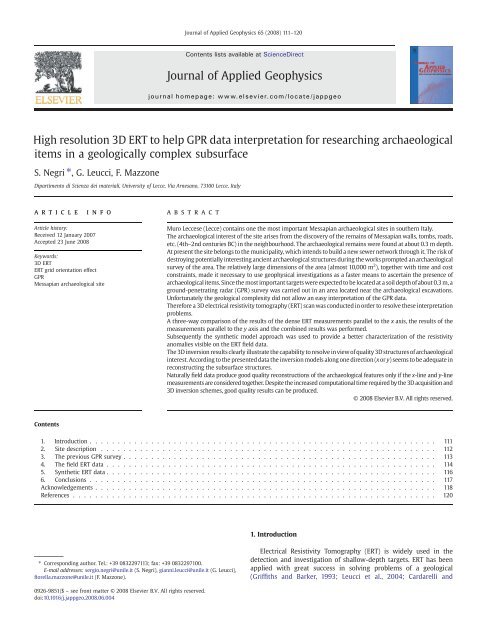
High resolution 3D ERT to help GPR data interpretation for ...
High resolution 3D ERT to help GPR data interpretation for ...
High resolution 3D ERT to help GPR data interpretation for ...

You also want an ePaper? Increase the reach of your titles
YUMPU automatically turns print PDFs into web optimized ePapers that Google loves.
S. Negri et al. / Journal of Applied Geophysics 65 (2008) 111–120113Fig. 2. The <strong>GPR</strong> survey: a) Pho<strong>to</strong> of the alternation of simply folded marne and calcarenite in the substrate, which outcrops in where the road runs past the surveyed area; b) 200 MHzantenna processed radar section related <strong>to</strong> the P2 profile; c) 500 MHz antenna processed radar section related <strong>to</strong> the P2 profile.The Messapian settlement of Muro has not been systematicallyexplored, but <strong>for</strong> many decades has suffered a new “destruction” in the<strong>for</strong>m of continuous building. The acquisition of some areas containingarchaeological remains and the drawing up in 1999 of an agreementbetween the Municipality, the Archaeological Protection Authority(“Sovraintendenza”) and the Department of Cultural Heritage of theUniversity of Lecce, laid the ground <strong>for</strong> a new approach <strong>to</strong> thearchaeological exploration of some sec<strong>to</strong>rs of the Messapian settlement.In 2001, archaeologists from the University of Lecce started <strong>to</strong>survey a Messapian residential district of the 4th century BC), situated<strong>to</strong> the East of the modern inhabited area known as “Cunella”.The results of these initial explorations were a village composed ofgroups of huts at some distance from each other, occupying thehighest points of the terri<strong>to</strong>ry. These huts were of circular or oval<strong>for</strong>m; the lower walls were built of s<strong>to</strong>ne and the upper walls of clayand wood, with a roof of straw and clay (Giardino, 2002; Guastali,2003).Data from the archaeological excavations and geological observations(box core samples) made it possible <strong>to</strong> reconstruct thestratigraphy of the first ten metres of sediments. About 0.3 m ofcovering materials (such as agricultural terrain) rest on the surface.Beneath this lies a calcarenite layer of up <strong>to</strong> 5 m in depth. In places, thiscalcarenite is covered by up <strong>to</strong> three metres of alternating marne andclay deposits (Margiotta, personal communication).3. The previous <strong>GPR</strong> surveyThe evidence of the partial overlap of the modern village with theancient inhabited area, as well as the threat from building expansion,prompted the municipal authorities <strong>to</strong> identify, as a matter of urgency,the areas where building activities would need <strong>to</strong> be prohibited inorder <strong>to</strong> safeguard the buried archaeological heritage and recover it<strong>for</strong> appreciation by the public.The <strong>GPR</strong> survey at the archaeological site of Muro was carried outusing a Sir-2 digital pulse radar system made by GSSI (GeophysicalSurvey System Inc.) with both 200 and 500 MHz centre-frequencyantennas. The survey was carried out in an area (Fig. 1), located on theEast side of the excavation site (Carrozzo et al., 2002).Given the shallow depth of the structures of interest and the high<strong>resolution</strong> required, few profiles were per<strong>for</strong>med using the 200 MHzantenna; most of the <strong>GPR</strong> survey was carried out using the 500 MHzantenna along parallel profiles 0.5 m apart (Fig. 1) withaNW–SEorientation. The acquisition parameters (time window, gain function,filters) were kept constant <strong>for</strong> all the profiles acquired so as <strong>to</strong> facilitatecomparison and ensure that the <strong>data</strong> were as homogeneous as possible.The processing of the <strong>GPR</strong> <strong>data</strong> consists essentially of the followingsteps:• trace editing and normalization of the horizontal scale samplingintervals of 0.025 m;• reconstruction of the saturated wave <strong>for</strong>m (‘declipping’);• filtering of background by removing the average trace;• manual application of a time-variant gain function;• application of band-pass filters;• Estimation of the average velocity of propagation using the diffractionhyperbola method;• Kirchhoff 2D migration using the previously estimated velocityvalues (roughly 9.0 cm/ns);• construction of the time slices using appropriate time windows(Conyers and Goodman, 1997).Despite the effects of system ringing and the jogging of theantenna as it moved across the ground surface, it was possible <strong>to</strong>
114 S. Negri et al. / Journal of Applied Geophysics 65 (2008) 111–120Fig. 3. The <strong>GPR</strong> survey: a) 500 MHz antenna processed radar section related <strong>to</strong> the P25 profile; b) time slice 0–10 ns; c) time slice 10–20 ns; d) time slice 20–30 ns; e) time slice30–40 ns; f) time slice 40–50 ns; g) time slice 50–60 ns.recognise a useful signal in the radar profiles acquired. In large parts ofthe area however, the signal was very weak, perhaps due <strong>to</strong> a greaterthickness of the <strong>to</strong>psoil, and the depth of penetration was considerablyreduced. Particularly intense continuous reflections were presentup <strong>to</strong> roughly 50 ns (Fig. 2b and c) in the NW corner of the area (Fig. 1).These were due <strong>to</strong> the alternation of simply folded marne andcalcarenite in the substrate, which outcrops in where the road runspast the surveyed area (Fig. 2a). The pho<strong>to</strong>graph shows the presence of“terra rossa” and heterogeneous material (deriving from both karsticdissolution and anthropogenic activities), of higher conductivity, used<strong>to</strong> fill in the cavities.Less intense and more discontinuous reflections were detected inthe same time window in the profiles acquired in the central part ofthe area. These reflections are characterized by sharp interruptions,<strong>for</strong> example between 29 and 32 m on the profile shown in Fig. 3a,where the absorption of the signal suggests a thickening in that poin<strong>to</strong>f the (more conductive) layer of <strong>to</strong>psoil. These brusque lateralvariations may attributed either <strong>to</strong> natural phenomena deriving fromthe karstic nature of the terrain, or <strong>to</strong> some anthropogenic origin.Using the time slice construction technique (Conyers and Goodman,1997) and employing the <strong>GPR</strong> <strong>data</strong> within six time windows 0–10 ns a planimetric representation of the radar energy in the first2.70 m of depth (Fig. 3b–g) was drawn up. In the central part of the areaand in the time slices 10–20 ns, 20–30 ns and 30–40 ns (Fig. 3c,d,e) ahigh-intensity pseudo-elliptical zone, labelled B, can be seen.Some strong radar anomalies (labelled A) were also detected in theNorth-west corner near the road. These have been interpreted asresulting from the fractured and karstified bedrock <strong>to</strong>gether with theinfill material mentioned above. However, the question of how <strong>to</strong>interpret the roughly elliptical shallow anomaly B — specifically,whether it is likely <strong>to</strong> be of archaeological interest, remains <strong>to</strong> beresolved.To resolve this question, in Oc<strong>to</strong>ber 2002 the <strong>3D</strong> <strong>ERT</strong> survey wasper<strong>for</strong>med.4. The field <strong>ERT</strong> <strong>data</strong>A <strong>3D</strong> survey was conducted at the archaeological site of MuroLeccese. The area surveyed, measuring 23 m by 18 m, was selected soas <strong>to</strong> cover the elliptical shallow anomaly (B) detected in the <strong>GPR</strong>survey (Fig. 3b). The survey entailed a set of 19 dipole–dipole lines inthe x direction, each with 24 electrodes, and a perpendicular set of 24dipole–dipole lines in the y direction, each with 19 electrodes. In bothdirections the lines were spaced 1 m apart, and the distance betweenelectrodes along the lines was also 1 m. The chose of lines spacing andelectrodes distance was due <strong>to</strong> the <strong>GPR</strong> survey results that evidencedanomalous zone with dimension of some meters (Fig. 3). The dipole aspacing varied from 1 <strong>to</strong> 2 m. The maximum distance between thecurrent pair and potential pair of electrodes was limited <strong>to</strong> a maximumof n=6 a-spacings. Larger interdipole spacings led <strong>to</strong> unacceptablelevels of noise in the <strong>data</strong>. A Syscal R1 (Iris-Instruments)resistivity meter was used. A <strong>to</strong>tal of 5741 <strong>data</strong> points were measuredand the results of the joint <strong>3D</strong> inversion of the <strong>data</strong> sets from the x, yand xy directions were considered. The acquired <strong>data</strong> were combined<strong>to</strong> produce three-dimensional depth slices of the resistivity distributionin the x, y and xy directions.Resistivity <strong>data</strong> were inverted with the RES<strong>3D</strong>INV program (Lokeand Barker, 1996). The inversion program uses a block model in whichresistivity values are assigned in the prisms within a <strong>3D</strong> mesh. Theprogram attempts <strong>to</strong> achieve convergence between apparent resistivityvalues and calculated model by using the smoothnessconstrained least square method (deGroot-Hedlin and Constable,1990; Sasaki, 1992; Loke and Barker, 1996), in which the Jacobianmatrix is calculated after each inversion. The finite-difference method
S. Negri et al. / Journal of Applied Geophysics 65 (2008) 111–120115Fig. 4. <strong>ERT</strong> survey: depth slices of increasing depth that resulted from the <strong>3D</strong> inversion of the x oriented <strong>data</strong>.was applied in order <strong>to</strong> calculate <strong>for</strong>ward response of the geoelectricalmodels while Gauss–New<strong>to</strong>n optimization method was used <strong>to</strong> solvethe inverse resistivity problem. The blocks were divided in half,vertically and horizontally, in order <strong>to</strong> provide better <strong>resolution</strong> of thecalculated resistivity distribution, but the results have show that thereare not more difference between the resistivity models obtained usingthe option with the blocks divided in half, vertically and horizontallyand the models obtained without this option. It is probably due <strong>to</strong> thelines spacing and electrodes distance that are comparable with thetarget dimensions.ARMSerrorsof3.29%<strong>for</strong>x direction, 4.26% <strong>for</strong> y direction, and 3.69%<strong>for</strong> xy direction <strong>data</strong> sets were achieved after 5 iterations. Increasing thenumber of iterations the RMS error doesn't vary significantly.Figs. 4, 5 and 6 show the eight slices of increasing depth thatresulted from the <strong>3D</strong> inversion of the x, y and xy <strong>data</strong> respectively.An elliptical shallow anomaly (labelled B) of high resistivity(greater 400 Ωm) appears in the 0.19,…, 2.08 m, depth slices of thex, y and xy direction <strong>data</strong> inversions.This anomaly confirms the elliptical shallow anomaly (B) detectedby the <strong>GPR</strong> survey (Fig. 3b).Due <strong>to</strong> its high resistivity values, typical of Salen<strong>to</strong> calcarenite(Leucci et al., 2004), anomaly B has been interpreted as a section of thecalcarenite bedrock in which an elliptical hollow was excavated. Thenature of this anomaly is suggestive due <strong>to</strong> the low resistivity values(ranging from 100 <strong>to</strong> 150 Ωm, labelled w in Figs. 4, 5 and 6) of thematerials contained inside it. The anomaly W, visible inside anomalyB, in the 0.19,…, 1.16 m depth slices, may be a feature of archaeologicalinterest.In the 1.16,…, 2.80 m deeper slices, below the anomaly W, theresistivity values decrease until <strong>to</strong> about 40 Ωm. This lower resistivityzone, labelled T, could represent once more a stratigraphic level insidethe calcarenite bedrock that may be of archaeological interest.The <strong>3D</strong> images reconstructed from the x, y and xy directionsurveys are similar but not identical <strong>to</strong> each other. The W and Tanomalies appear <strong>to</strong> have a different shape depending on the directionof acquisition.Subsequent archaeological excavations per<strong>for</strong>med in the areawhere anomaly B was found have confirmed the existence of a littlepebble wall (0.2–0.9 m in depth) and a series of <strong>to</strong>mbs (about 1.7 m indepth) (Fig. 7).Particularly the excavation stratigraphy (Fig. 8a) includes a thin0.40 m ground layer and an underlying pebbles layer (0.40–0.90 indepth). From about 0.90 m <strong>to</strong> about 1.7 m in depth is a layer withground and pebble. At about 1.70 m in depth are the <strong>to</strong>mbs. The <strong>to</strong>mbswere found filled with ground. Centered at 0.20 m in depth on thecentre part of the excavation is a wall of pebbles.Lines E8x (Fig. 8b) and E12y (Fig. 8c) were imaged and comparedwith the archaeological excavation results. Electrical resistivity valuesgreater 400 Ωm are related <strong>to</strong> the calcarenite bedrock. The resistivitymodel related <strong>to</strong> the E8x line (Fig. 8b) show the presence of a little
116 S. Negri et al. / Journal of Applied Geophysics 65 (2008) 111–120Fig. 5. <strong>ERT</strong> survey: depth slices of increasing depth that resulted from the <strong>3D</strong> inversion of the y oriented <strong>data</strong>.anomaly (about 100 Ωm) between approximately x=9.5 m andx=11.0 m. In these points the E8x line go through the wall of pebbleswhich the archaeologists found after the excavation (Fig. 8a). In theresistivity model shows in Fig. 8b is clearly visible the layer filled withpebbles. In this layer the resistivity values increase from 60 <strong>to</strong> about200 Ωm. An high resistivity zone (about 200–300 Ωm) betweenapproximately 0.9 m and 1.7 m in depth is clearly visible and could berelated <strong>to</strong> the layer composed by ground and pebbles. Below this layerthe <strong>to</strong>mbs were found.The resistivity model related <strong>to</strong> the E12y line (Fig. 8c) show thepresence of a low resistivity zone (70–110 Ωm) between approximatelyy=7.5 m and y=9.5 m. In this zone a cut in the calcarenite bedrock wasfound.Subsequently the x, y and xy <strong>ERT</strong> <strong>data</strong> sets were compared withthe results of these archaeological excavations in order <strong>to</strong> evaluatetheir utility in eliminating the intrinsic ambiguity related <strong>to</strong> the shapeof the W and T anomalies.Figs. 9, 10, and 11 show the superimposition of the archaeologicalfeatures discovered (wall and <strong>to</strong>mbs) on the resistivity model depth layersobtained from the <strong>data</strong> sets <strong>for</strong> the x (Fig. 9), y (Fig. 10), and xy (Fig. 11)directions.The comparison confirms that the depth slices were able <strong>to</strong> reconstructthe three-dimensional feature reasonably well but that there are somedifferences between the results obtained from the x, y and xy <strong>data</strong>.The <strong>3D</strong> inversion models (x, y, xy) show comparable accuracy(Figs. 9, 10 and 11). Although some minor differences can be observedin the major features (W and T). The W feature was well defined in thex, and xy direction because the W feature was almost oriented in the xdirection (Figs. 9 and 11). The T anomaly was resolved withcomparable accuracy in the x, y, and xy inversion models respectively(Fig. 9, 10 and 11). It is due <strong>to</strong> de dimension of T anomaly (about2×2 m) that are greater than lines spacing and electrodes distance.5. Synthetic <strong>ERT</strong> <strong>data</strong>Synthetic <strong>data</strong> were created in order <strong>to</strong> understand the complexity ofthe subsoil condition and there<strong>for</strong>e <strong>to</strong> <strong>help</strong> in <strong>interpretation</strong> of field <strong>data</strong>.The synthetic <strong>data</strong> were created by assuming a 2D resistivity model(Fig.12a) that includes a 800 Ωm surface layer (1.50 m thickness) A andan underlying 30 Ωm layer (1.25 m thickness) B. Layer A appears againbelow layer B. These layers could correspond <strong>to</strong> a calcarenite bedrock(A) overlying a conductive ground (B) and again the calcarenitebedrock (A). At the 11.5 m in the x direction, a rectangular block (W)with a resistivity of 400 Ωm is cetered. The block is located inside arectangular conductivity material (30 Ωm). Block W represent the wallof pebble, found inside a ground material, after the archaeologicalexcavation.In Fig. 12c the 2D resistivity model was created in order <strong>to</strong> simulatethe cut inside the calcarenite bedrock without the wall of pebble.To simulate the per<strong>for</strong>med field survey, 24 electrodes are spreadacross the <strong>to</strong>p of the model at regular 1 m intervals. The dipole–dipolearray was used.The synthetic <strong>data</strong> were generated with Res2Dmod software (Loke,2001). The 2-D model was created using the finite-difference method
S. Negri et al. / Journal of Applied Geophysics 65 (2008) 111–120117Fig. 6. <strong>ERT</strong> survey: depth slices of increasing depth that resulted from the <strong>3D</strong> inversion of the xy oriented <strong>data</strong>.that divides the subsurface in<strong>to</strong> a number of blocks using a rectangularmesh (Dey and Morrison, 1979; Loke 1994).Subsequently, the inversion procedure <strong>for</strong> the <strong>data</strong> sets wascompleted after 5 iterations using the Res2Dinv software (Loke, 2004).The Gauss–New<strong>to</strong>n and finite-difference option was used. Themodel cells with widths of half the unit spacing option was used inorder <strong>to</strong> provide better <strong>resolution</strong> of the calculated resistivitydistribution. A RMS errors of about 5% was achieved after 5 iterations.Increasing the number of iterations the RMS error doesn't varysignificantly.Fig. 12b and d show the resistivity images determined from theresistivity model showed in the Fig. 12a and c respectively.The observation of the results indicates that the wall should bequite well resolved.Subsequently the 2D <strong>ERT</strong> field <strong>data</strong> were compared with thesynthetic <strong>data</strong>. Particularly the E8x line (Fig. 12e) was considered. Infact E8x line goes through the wall of pebbles which the archaeologistsfound after the excavation.When compared the Fig. 12b and e demonstrate that the anomalyW could be interpreted as wall.6. ConclusionsThe question that arises in cases such as these concerns theoptimum survey technique; one way <strong>to</strong> map the archaeologicalfeatures with a good <strong>resolution</strong> would be <strong>to</strong> conduct a full <strong>3D</strong> <strong>ERT</strong>survey, but full <strong>3D</strong> <strong>ERT</strong> measurements are very time-consuming.The field <strong>data</strong> showed that resistivity inversion models along the x,y, and xy direction respectively can delineate the subsurface structurewith comparable accuracy if the lines spacing and electrodes distanceare comparable with the target dimension, but if the orientation ofarchaeological feature is unknown, only the combination of an xysurvey yielded satisfac<strong>to</strong>ry results.In the examples presented in this paper, the results from theinversion of field <strong>data</strong> where the archaeological feature had lowresistivity in comparison <strong>to</strong> its background showed that the gridorientation effect was absent in the x and xy <strong>data</strong> sets, thus successfulin resolving the anomaly even when a single set of parallel profileswas used. However, these results depend also on the target orientationin respect the grid orientation.Furthermore we emphasize the utility of both 2D <strong>GPR</strong> and <strong>ERT</strong> field<strong>data</strong>. Particularly the 2D <strong>ERT</strong> <strong>data</strong> (field <strong>to</strong>gether synthetic <strong>data</strong>)allowed a better <strong>interpretation</strong> of anomalies zone (stratigraphy andwall of pebbles).Using synthetic <strong>data</strong> we assessed the imaging potential of <strong>data</strong>acquired in the field.To summarise, <strong>ERT</strong> <strong>data</strong> <strong>help</strong> <strong>to</strong> resolve the ambiguities in the<strong>interpretation</strong> of <strong>GPR</strong> <strong>data</strong>. Furthermore, the option in <strong>ERT</strong> <strong>data</strong>processing in which the blocks were divided in half, vertically andhorizontally provides a <strong>resolution</strong> comparable with <strong>ERT</strong> <strong>data</strong>
118 S. Negri et al. / Journal of Applied Geophysics 65 (2008) 111–120Fig. 7. The archaeological site of Muro Leccese (Lecce, Italy): pho<strong>to</strong>s of the <strong>to</strong>mb and wall found after the geophysical investigations.processing in which the blocks were not divided. It is probably due <strong>to</strong>the lines spacing and electrodes distance that are comparable with thetarget dimensions.Is important <strong>to</strong> underling that the <strong>GPR</strong> <strong>data</strong> give usefulin<strong>for</strong>mation about the target orientation and dimension and <strong>help</strong>ed<strong>to</strong> design the <strong>ERT</strong> survey. In fact the knowledge of target orientationand dimension allow both <strong>to</strong> acquire <strong>ERT</strong> <strong>data</strong> in only one direction,<strong>to</strong> determine the lines spacing and electrodes distance, and there<strong>for</strong>ereduces the survey costs and the time of acquisition and elaborationof <strong>data</strong>.AcknowledgementsThis work was made possible thanks <strong>to</strong> the cooperation of Prof.Liliana Giardino, professor of “Classical Urban Studies” at theDepartment of Cultural Heritage at the University of Lecce (Italy).Fig. 8. Comparison between a) the archaeological remains location and the <strong>ERT</strong> 2D resistivity distribution in subsoil — b)E8x, c)E12y.
S. Negri et al. / Journal of Applied Geophysics 65 (2008) 111–120119Fig. 9. Comparison between the <strong>ERT</strong> depth slices (x-direction) and the archaeological remains location.Fig. 10. Comparison between the <strong>ERT</strong> depth slices (y-direction) and the archaeological remains location.Fig. 11. Comparison between the <strong>ERT</strong> depth slices (xy-direction) and the archaeological remains location.
120 S. Negri et al. / Journal of Applied Geophysics 65 (2008) 111–120Fig. 12. Resistivity model employed <strong>for</strong> the analysis of field <strong>data</strong>: a) with wall; b) result of the inversion with the wall; c) without wall; d) result of the inversion without the wall; e) thefield <strong>data</strong> related <strong>to</strong> E8x line.The authors would like <strong>to</strong> thank also Dr. Catia Bianco <strong>for</strong> thedocumentation and archaeological maps.ReferencesAspinall, A., Gaffney, C.F., 2001. The Schlumberger array-potential and pitfalls inarchaeological prospection. Archaeological Prospection 8, 199–209.Bentley, L.R., Gharibi, M., 2004. Two and three-dimensional electrical resistivityimaging at a heterogeneous remediation site. Geophysics 69, 674–680.Brunner, I., Friedel, S., Jacobs, F., Danckwardt, E., 1999. Investigation of a Tertiary maarstructure using three-dimensional resistivity imaging. Geophysical Journal International136, 771–780.Cardarelli, E., Fischanger, F., 2006. 2D <strong>data</strong> modelling by electrical resistivity<strong>to</strong>mography <strong>for</strong> complex subsurface geology. Geophysical Prospecting 54, 121–133.Carrozzo, M.T., Leucci, G., Negri, S., Nuzzo, L., 2002. Applicazione di me<strong>to</strong>di elettrici,magnetici ed elettromagnetici per prospezioni archeologiche in area urbana: il casodi Muro Leccese (Lecce). Atti del 21° Convegno Nazionale GNGTS, Roma 6–9Novembre 2002.Chambers, J.E., Ogilvy, R.D., Kuras, O., Cripps, J.C., Meldrum, P.I., 2002. <strong>3D</strong> electricalimaging of known targets at a controlled environmental test site. EnvironmentalGeology 41, 690–704.Conyers, L.B., Goodman, D., 1997. Ground-Penetrating Radar — An introduction <strong>for</strong>archaeologists. AltaMira Press. 232 pp.Dahlin, T., Berns<strong>to</strong>ne, C., Loke, M.H., 2002. A 3-D resistivity investigation of acontaminated site at Lernacken, Sweden. Geophysics 67, 1692–1700.De Domenico, D., Giannino, F., Leucci, G., Bottari, C., 2006. Integrated geophysicalsurveys at the archaeological site of Tindari (Sicily, Italy). Journal of ArchaeologicalScience 33, 961–970.deGroot-Hedlin, C., Constable, S., 1990. Occam's inversion <strong>to</strong> generate smooth, thedimensional models from magne<strong>to</strong>telluric <strong>data</strong>. Geophysics 55, 1613–1624.Dey, A., Morrison, H.F., 1979. Resistivity modelling <strong>for</strong> arbitrary shaped two dimensionalstructures. Geophysical Prospecting, 27, 1020–1036.Furman, A., Ferré, T.P.A., and Warrick, A.W. 2004. Optimization of <strong>ERT</strong> surveys <strong>for</strong>moni<strong>to</strong>ring transient hydrological events using perturbation sensitivity and geneticalgorithms. Available at www.vadosezonejournal.org. Vadose Zone J. 3:1230–1239.Giannino, F., Leucci, G., Teramo, A., De Domenico, D., 2005. Geophysical surveys <strong>to</strong>improve the knowledge on the S. Salva<strong>to</strong>re <strong>for</strong>tress structure (Messina, Italy). Attidel 24° Convegno Nazionale del GNGTS; Roma 15, 16 e 17 Novembre 2005. CD-Rom.Giardino, L., 2002. Muro Leccese. La città messapica senza nome: dal libro di PasqualeMaggiulli 1992 al parco archeologico del 2000. Edizioni Goffreda, Maglie (Lecce).Godio, A., Strobbia, C., De Bacco, G., 2006. Geophysical characterisation of a rockslide inan alpine region. Engineering Geology 83, 273–286.Griffiths, D.H., Barker, R.D., 1993. Two-dimensional resistivity imaging and modelling inareas of complex geology. Journal of Applied Geophysics 29, 211–226.Guastali, M., 2003. Lo sguardo di Icaro. Le collezioni dell'Aereofo<strong>to</strong>teca Nazionale per laconoscenza del terri<strong>to</strong>rio, pp. 336–338. Edizioni Campisano.Leucci, G., Margiotta, S., Negri, S., 2004. Geological and geophysical investigations inkarstic environment (Salice Salentino, Lecce, Italy). Journal of Environmental andEngineering Geophysics (JEEG) 9, 25–34.Loke, M.H., , 1994, The inversion of two-dimensional apparent resistivity <strong>data</strong>. unpubl.Ph.D. thesis, Un. of Birmingham (U.K.).Loke, M.H., 2001. Res2DMod ver. 3.02a. Geo<strong>to</strong>mo Software. www.geoelectrical.com.Loke, M.H., 2004. Res<strong>3D</strong>inv ver 2.14. Geo<strong>to</strong>mo Software. www.geoelectrical.com.Loke, M.H., Barker, R.D., 1996. Practical techniques <strong>for</strong> <strong>3D</strong> resistivity surveys and <strong>data</strong>inversion. Geophysical Prospecting 44, 499–523.Nowroozi, A.A., Horrocks, S.B., Henderson, B., 1999. Saltwater intrusion in<strong>to</strong> thefreshwater aquifer in the eastern shore of Virginia: a reconnaissance electricalresistivity survey. Journal of Applied Geophysics 42, 1–22.Osella, A., de la Vega, M., Lascano, E., 2005. <strong>3D</strong> electrical imaging of an archaeologicalsite using electrical and electromagnetic methods. Geophysics 4, 101–107.Papadopoulos, N.G., Tsourlos, P., Tsokas, G.N., Sarris, A., 2006. Two-dimensional andThree-dimensional resistivity Imaging in Archaeological Site Investigation. ArchaeologicalProspection 13, 75–90.Sasaki, Y., 1992. Resolution of resistivity <strong>to</strong>mography inferred from numericalsimulation. Geophysical Prospecting 40, 453–464.Slater, L., Glaser, D., Utne, J.I., Binley, A., 2002. Electrical imaging of permeable reactivebarrier integrity. Proceedings of the Symposium on the Application of Geophysics<strong>to</strong> Environmental & Engineering Problems (SAGEEP), February 10–14, Las Vegas, NE,10pp.Slater, L., Binley, A., Reeve, A., 2003. Solute transport processes in peat inferred fromelectrical imaging. Proceedings of the Symposium on the Application of Geophysics<strong>to</strong> Environmental & Engineering Problems (SAGEEP2003), April, San An<strong>to</strong>nio, TX,pp. 676–686.Van Schoor, A., 2002. Detection of sinkholes using 2D electrical resistivity imaging.Journal of Applied Geophysics 50, 393–399.