Tank Containers: A Sustainable Solution for Bulk Liquid ... - Itco.be
Tank Containers: A Sustainable Solution for Bulk Liquid ... - Itco.be
Tank Containers: A Sustainable Solution for Bulk Liquid ... - Itco.be

Create successful ePaper yourself
Turn your PDF publications into a flip-book with our unique Google optimized e-Paper software.
CONTENTS1 FOREWORD FROM ITCO 42 SUMMARY: TANK CONTAINERS PROVIDE A SUSTAINABLE SOLUTION FOR BULK LIQUID TRANSPORT53 TANK CONTAINERS: REUSABLE, RECYCLABLE, RE-MANUFACTURABLE 63.1 Reusable ............................................................................................................. 63.2 Recyclable .......................................................................................................... 73.3 Re-manufacture ................................................................................................. 74 SUSTAINABILITY IN PRACTICE: THE CASE OF TANK CONTAINERS 84.1 Manufacture ...................................................................................................... 84.2 Operations ......................................................................................................... 94.3 Leasing ............................................................................................................. 104.4 <strong>Tank</strong> Service Providers ..................................................................................... 114.5 Inspection ......................................................................................................... 115 ECO-IMPACT OF TANK CONTAINERS 125.1 Carbon footprint: tank container shipment from China to Europe ................. 125.2 All environmental impacts: tank container shipment from China to Europe . 145.3 Variations in transport footprints .................................................................... 156 HOW ISO TANK CONTAINERS MAKE TRANSPORT MORE SUSTAINABLE 186.1 Reduction of deadhead trips ........................................................................... 186.2 Ease of multi-modal transport ......................................................................... 187 AREAS FOR POSSIBLE IMPROVEMENT 197.1 ITCO-internal actions ....................................................................................... 197.2 ITCO-external actions ....................................................................................... 218 REFERENCES 222 Octo<strong>be</strong>r 2011
TABLESTable 1: Carbon footprint by life-cycle phase, ISO tank shipment from China-Europe .......... 14Table 2: Emission factors <strong>for</strong> freight transport (g CO 2 e/tkm) ................................................. 16Table 3: Load factors <strong>for</strong> cargo shipping, by type .................................................................... 18FIGURESFigure 1: Workhorse of the transport sector – a typical tank container ................................... 6Figure 2: Absolute carbon footprint by function, ISO tank container shipment from China toEurope .............................................................................................................................. 12Figure 3: Percentage carbon footprint by function, ISO tank container shipment from Chinato Europe.......................................................................................................................... 13Figure 4: Carbon footprint by life-cycle phase, ISO tank shipment from China to Europe ..... 13Figure 5: Percentage total eco-impact by function, ISO tank shipment from China to Europe.......................................................................................................................................... 15ITCOInternational <strong>Tank</strong> Container OrganisationSuite 3 – Charter House, 26 Claremont Road,GB-Surbiton KT6 4QZ, www.itco.<strong>be</strong>Atlantic ConsultingObstgartentstrasse 148136 Gattikon (Zürich)+41 44 772 1079atlantic@ecosite.co.uk3 Octo<strong>be</strong>r 2011
1 Foreword from ITCOOver the last 30 years there has <strong>be</strong>en a continuing trend to transport an increasingly widerange of cargoes in intermodal ISO shipping containers. <strong>Tank</strong> containers have <strong>be</strong>en part ofthis shift – they have provided safe, reliable and cost-effective transport <strong>for</strong> liquids, powdersand gases, both hazardous and non hazardous, foods and chemicals. Although the shift tocontainers was aimed primarily at improving efficiency and cutting costs, containerisationhas also helped to protect the environment by lowering the carbon footprint and reducingwaste.The International <strong>Tank</strong> Container Organisation(ITCO), <strong>for</strong>med in 1998, is a voluntary, nonprofittrade association that represents theindustry and advances its interests. ITCO’smain function is to <strong>be</strong> a plat<strong>for</strong>m on which theindustry coordinates its ef<strong>for</strong>ts in quality,safety and environmental protection.Mem<strong>be</strong>rs represent much of the global tankcontainer industry, including companies thatmanufacture tank containers, operators,lessors, and service providers such as depotsand inspectors.Sustainability is a key issue <strong>for</strong> ITCO and it supports chemical industry initiatives such asResponsible Care, developed by the European Chemical Industry Council (CEFIC).Responsible Care Mem<strong>be</strong>rs work to:• Improve continuously environmental, health, safety and security knowledge andper<strong>for</strong>mance so as to avoid harm to people and the environment.• Use resources efficiently and minimise waste.• Report openly on per<strong>for</strong>mance, achievements and shortcomings.• Listen, engage and work with the public to understand and address their concernsand expectations.• Cooperate with governments, international institutions and organisations in thedevelopment and implementation of effective regulations and standards. Providehelp and advice to foster the responsible management of chemicals by all those whomanage and use them along the product chain.• Appoint a Responsible Care Coordinator and develop an annual Responsible Careplan.Moreover, tank containers provide sustainable transport. <strong>Tank</strong> containers are re-usable.They reduce the handling of cargo in transit by use of a multi-modal international standardISO transport module. Highly sophisticated logistics techniques are used to transport thetank container from points of loading to discharge. At the end of life, a tank’s materials arereadily recycled.This report documents the sustainability status of <strong>Tank</strong> containers, and it identifies areaswhere further progress might <strong>be</strong> made. We welcome your comments and feedback.Patrick Hicks, ITCO General Secretary4 Octo<strong>be</strong>r 2011
2 Summary: <strong>Tank</strong> containers provide a sustainable solution <strong>for</strong> bulk liquidtransport.As a freight transport option, how sustainable are tank containers?Some of this report’s answers should not surprise. <strong>Tank</strong> containers offer obvioussustainability <strong>be</strong>nefits: they are reusable, recyclable and resistant to product wastage.Safety, quality and efficiency are watchwords throughout the industry.And then there are less-obvious findings. Nearly all of an ISO tank’s environmental impacthappens not during its manufacture, cleaning or disposal, but during its actual usage; i.e. itis not just economically efficient, but environmentally efficient as well. This efficiency –which reduces deadhead journeys and maximises use of water and rail connections – paysits <strong>be</strong>nefits in the <strong>for</strong>m of a lowercarbon footprint.Nonetheless, the ongoing struggleagainst global warming means that<strong>Tank</strong> containers will, like otherindustries, need to find ways to decarboniseeven further. These mightinclude ITCO-led initiatives to workwith Statutory Authorities to enableefficient regulatory controls, cut tareweight, boost capacity and perhaps toimprove aerodynamics. ITCOmem<strong>be</strong>rs also might lead the way inestablishing per<strong>for</strong>mance<strong>be</strong>nchmarks by improving the qualityand quantity of emission factors. Inaddition, mem<strong>be</strong>rs will want to keepabreast of de-carbonisation movesacross the freight-transport sector. One might <strong>be</strong> a reduction in marine travel velocity – a‘speed limit of the sea’.The body of this report is aimed at readers with working, but non-expert, knowledge ofsustainability issues. It is divided into three general parts.First, Chapters 3 and 4 give an overview of how tank containers are inherently sustainableand how sustainability is practised by their manufacturers, operators and service providers.Second, Chapters 5 and 6 discuss the environmental impact of tank containers: where doestheir carbon footprint happen, and how this is lower than some alternative transportmethods?Finally, Chapter 7 points out some ways in which tank containers might <strong>be</strong>come even moresustainable.5 Octo<strong>be</strong>r 2011
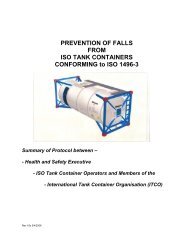
3 <strong>Tank</strong> containers: reusable, recyclable, re-manufacturable<strong>Containers</strong> are a prime choice of shippers, moving more than 90% of non-bulk cargo. Sincetheir introduction in the 1950s and 1960s, the world fleet of all container types has grownto some 25 million units. <strong>Tank</strong> containers <strong>be</strong>long to this fleet: an estimated 290,000 of themare in operation, and more than 10,000 new tank containers are manufactured each year.What are tank containers? They consist of a pressure vessel (the tank) supported andprotected within an ISO frame (Figure 1). The International Standards Organisation (ISO)frame is identical in dimension to an ISO dry freight container, and it uses the same type ofcorner castings to enable lifting and stacking. The tank design is governed by internationalregulations ensuring the safe transport of a wide range of bulk liquids and powders. <strong>Tank</strong>containers are also commonly referred to as “portable tanks” or “ISO tanks”.<strong>Tank</strong> containers are manufactured in a range of capacities, with various configurations ofvalves and fittings. Typically, a standard tank carries 25,000 litres and has a maximum grossweight of 36 metric tonnes. A discharge valve is mounted at the rear end; access <strong>for</strong> loading,cleaning and maintenance is at the top. Accessories can include steam heating, ladders andwalkway access to the top.Figure 1: Workhorse of the transport sector – a typical <strong>Tank</strong> container<strong>Tank</strong> containers are reusable, recyclable and can <strong>be</strong> re-manufactured.3.1 Reusable<strong>Tank</strong> containers are designed <strong>for</strong> an economic life of typically 20 years. During this life thetank is used over and over again. After discharge of cargo the tank is cleaned, inspected andprepared <strong>for</strong> the next cargo load.6 Octo<strong>be</strong>r 2011
A tank container engaged on long-haul trades, <strong>for</strong> instance China to Europe, where thedoor-to-door voyage lasts about 6-7 weeks, might ship up to eight loads annually. Over 20years, that amounts to 160 loads or 4,000 metric tonnes of cargo. Short-haul trades willresult in considerably more loads.The tank operates door-to-door. It is loaded with cargo in plant A and transported by truck,rail and ship to the destination plant B where the tank is unloaded and the cargo directedinto the production process.3.2 Recyclable<strong>Tank</strong> containers aremanufactured of materials thatare very suitable <strong>for</strong> re-cycling.The total weight is typically3,700 kg, of which the majorityis metal, namely the stainlesssteel tank and the carbon steelframe. These are easily cut intomanageable dimensions thatcan <strong>be</strong> melted and made intonew materials.3.3 Re-manufactureTo extend the life <strong>be</strong>yond 20years, tank containers oftenundergo re-manufacture. Thisstarts with the removal of theentire tank frame andinsulation, retaining only thestainless steel tank vessel,valves and fittings. Stainless steel is a long lasting metal; it is highly suitable <strong>for</strong> re-use.The re-manufacture process re-cycles the retained tank into a new frame. The tank is reinsulatedand tested and continues its service life as new. It is expected that this process willextend the life of the tank a further fifteen years.7 Octo<strong>be</strong>r 2011
4 Sustainability in practice: the case of <strong>Tank</strong> containersSustainability is part of an ISO tank’s entire life cycle, from manufacturing to operation. Andit includes not just manufacturers and operators, but also players such as lessors, serviceproviders and inspectors.4.1 Manufacture<strong>Tank</strong> containers are manufactured in specialist plants located within regions where there isa demand <strong>for</strong> at least the initial bulk liquid cargo transport to economically position thecontainer to the buyers place of need. The majority of standard fleet tank manufacture isconcentrated in China and South Africa ensuring manufacturing economy of scale andaccess to export cargo. In addition, regional plants exist world-wide, primarily <strong>for</strong> themanufacture of specialist tanks to meet local requirements.Manufacturing plants are concentrated to take advantage of locally based constructionmaterials (e.g. stainless steel suppliers), thus reducing the effects of transportation.Designs of tank container are primarily required to ensure the maximum safety. The tankshell is manufactured of ductile stainless steel and encased in a high tensile carbon steelframe.The vessel is designed to ASME pressurevessel code, manufactured to the higheststandards and able to withstand testpressures of 6 bar or more. The ISOmodular frame enables the tankcontainer to <strong>be</strong> safely lifted, stacked andtransported on standard intermodaltransport systems and utilising standardand existing infrastructure.<strong>Tank</strong> containers are insulated both tomaintain cargo temperatures and as anadded safety feature. Insulation improvesefficiency by maintaining cargo temperature. By developing improved insulation materialsand systems the cargo is <strong>be</strong>tter protected against temperature rise that might in turnincrease pressure. Temperature fall might also affect the cargo. By maintaining temperaturethroughout the voyage, energy costs to re-heat the cargo at destination are eliminated.Insulation and its outer protective cladding further provide a sandwich construction aroundthe tank, which creates a shield against accidental impact.<strong>Tank</strong> containers are manufactured of sustainable materials. Typically weighing 3700kg, thetank consists of a stainless steel tank barrel within a protective carbon steel modular frame,materials that may <strong>be</strong> recycled at the end of life. Protective paint to the frame is applied invapour filtering paint booths. Insulation materials are less sustainable but researchcontinues to develop improved products.8 Octo<strong>be</strong>r 2011
<strong>Tank</strong> containers are manufactured on production lines designed to reduce workload, energyand emissions. Components and sub-assemblies are made ready “just in time” and materialsare increasingly sourced locally. Material off-cuts from the manufacture process are recycled.<strong>Tank</strong> container designs continually improve to make the optimum use of modern locallyavailable materials. Designs have developed to ensure efficient low energy productionutilising the latest technology e.g. pressed vessel ends, auto-welder machines, rotating jigs,and recycled surface cleaning passivation process. Increased plate dimensions reduce thenum<strong>be</strong>r of plates and there<strong>for</strong>e welded joints and electronically controlled materialthickness control the material used to a fine tolerance. Computer controlled plasma profilecutters ensure the maximum components from each steel plate. Waste material is collectedand recycled.The tank tare weight has <strong>be</strong>en reduced by use of computer aided designs, enabling a higherstrength but lighter structure that maximises cargo payload. Finite element analysissoftware programmes determine the optimum material requirements and ensure safety ofdesign by simulating the potential stresses sustained during tank working life. The design isfurther proven by mechanical prototype tests undertaken in accordance with theregulations and witnessed by the Competent Authority.Component parts such as valves and fittings, sourced locally from specialist manufacturers,are largely universal. This facilitates efficient production and ensures interchange and in duecourse efficient spare parts <strong>for</strong> repairs and maintenance.The latest designs and material have enabled the tank tare weight to <strong>be</strong> reduced by some10%, resulting in lower transport weight or more cargo <strong>for</strong> each tank. Designs have alsoenabled increased tank capacity within the same ISO frame, the standard 25,000 litre tank<strong>be</strong>ing 20% greater cargo capacity than tanks commonly manufactured in the 1970s.4.2 OperationsOperators are specialist third party logistics suppliers providing bulk liquid transportationservices to shippers. ITCO mem<strong>be</strong>r operators account <strong>for</strong> a total fleet of more than 200,000tanks.Shippers load their cargo into an operator’s tank container. Operators undertake the entirelogistic move, transporting the cargo door-to-door. At the required destination, the cargo isdischarged and the tank re-used on another trade. By re-using the packaging (the tankcontainer) <strong>for</strong> a return cargo and ensuring the <strong>be</strong>nefits of multi-modal logistics, theoperation is highly efficient. To achieve efficiency the operator’s business requires:• Expert management and computer management systems• Client base with balanced trade lanes• Network of locally based contracted third party transport modes and depotsOperators frequently achieve fleet utilisation greater than 80%, downtime largely consistingof the time needed to undertake safety maintenance and cleaning <strong>be</strong>tween loads. Cargo is9 Octo<strong>be</strong>r 2011
delivered to meet just-in-time requirements thus minimising shippers’ stock inventories.However, operators also supply tank containers <strong>for</strong> the strategic stock of cargo. This enablesshippers and receivers to obtain temporary storage space and meet the requirements ofpeak demand.Multi-modal transport permits the ISO module tank container to <strong>be</strong> transported by road, railand sea, eliminating the need <strong>for</strong> wasteful and potentially hazardous transhipment of cargofrom one tank to another e.g. from ships tank to rail tank to tank truck or the need <strong>for</strong>handling and disposal of steel drums(125 200 litre steel drums required<strong>for</strong> the equivalent ISO <strong>Tank</strong> load).Investment in sophisticatedcomputer systems provides <strong>for</strong>optimum per<strong>for</strong>mance. A myriad ofdata is processed to ensure the mostsuitable tank is available and in safecondition <strong>for</strong> the next load. Safetyand quality are critical to operatingtank containers, and managementsystems are designed to meet therequirements of quality and safety systems such as ISO 9001, SQAS (Safety and QualityAssessment System) and Responsible Care (International Council Chemical Industries)4.3 LeasingThe tank container industry is supported by a num<strong>be</strong>r of established leasing companies(“lessors”) - companies that own stocks of strategically positioned tanks and lease (rent) tousers <strong>for</strong> short or long term durations.Leasing companies contribute to the sustainability of the tank container industry bybalancing peaks and troughs of operators’ and shippers’ business cycles. This meanscustomers are not required to hold idle inventories of tanks <strong>for</strong> potential strategic needs.In addition to the required fleet of standard tank types that an operator or shipper mightmanage, there is often a requirement <strong>for</strong> a specialist tank to <strong>be</strong> procured at short notice.Lessors are able to fulfil this need by leasing the optimum and most efficient tank <strong>for</strong> thescheduled business.Lessors additionally enable operators to grow their business without expending capital,enabling the operator to invest in efficient management systems and remain competitivewith other less environmentally efficient <strong>for</strong>ms of transportation. The bulk procurement oftank containers by lessors enables manufacturers to gear their production to maximumefficiency, reducing boom and bust cycles.Like operators, lessors manage their tank inventories by investing in expert managementand computer systems and engaging tank service providers in the region of need.10 Octo<strong>be</strong>r 2011
4.4 <strong>Tank</strong> Service Providers<strong>Tank</strong> service providers (TSPs) provide the facilities and expertise to store and maintain tanksin safe working condition. A worldwide network of depots ensures that a facility is availablewithin the region of demand.TSPs have invested heavily in new technology to clean tanks with high pressure automatedjets that conserve water. Effluents are managed in automated treatment plants usingbiodegradable flocculants to accelerate the separation of suspended solids, enabling wastewater to <strong>be</strong> recycled with only the minimal loss. With remaining treated waste at aminimum, it is <strong>be</strong>ing disposed through highly regulated facilities.An inventory of replacement parts are held on site to ensure the minimum downtime. <strong>Tank</strong>containers are increasingly designed to standardize parts required. Replacement seals andgaskets are almost all standard dimensions.<strong>Tank</strong>s, <strong>be</strong>ing a modular dimension, are stored in depots in stacks up to seven high. Thisconsiderably reduces the area required <strong>for</strong> storage. At times of high activity, e.g. when aship has <strong>be</strong>rthed, depots manage incoming and outgoing traffic to reduce truck waitingtimes and thereby reduce fuel use.Health and safety are paramount. TSPs invest in training of their personnel and ensure workis undertaken in accordance with theregulations. A skilled work<strong>for</strong>ce iscontinuously developed to maintain thenecessary high standards. Many depots arehave <strong>be</strong>en accredited to ISO 9001 qualitysystems.4.5 InspectionSafety is paramount and the tank container ishighly regulated with exacting internationaland regional regulatory standards includingUN, IMDG, ADR, RID, CFR49.Compliance entails independent assessment from design approval and prototype testing,inspection and testing at manufacture and retesting at 30 month periods throughout thetanks working life. Furthermore, operators, manufacturers, lessors and TSPs are required tomeet international standards such as SQAS, Responsible Care and ISO 9001 and inspectioncompanies are engaged to undertake independent audits.The regulations ensure that tank containers are operated to the highest standards of safetyprotecting personnel and the public. Safe operation is the most efficient operation. Thehighly regulated industry requires that Inspection Companies locate their personnel instrategic locations. This ensures minimal travel costs and reduces the environmental effectof travel. Local inspectors can promptly respond to the tank operators significantly reducingtank container downtime.11 Octo<strong>be</strong>r 2011
5 Eco-impact of tank containersWhere and how do <strong>Tank</strong> containers affect the environment? This chapter explores answersto that question, looking at carbon footprints and all environmental impacts of a shipmentfrom China to Europe. Then it considers general variations in transport footprints. The nextchapter explores how tank containers help minimise this environmental impact.5.1 Carbon footprint: tank container shipment from China to EuropeCarbon footprints are surely the <strong>be</strong>st-known measure of environmental impact. A carbonfootprint represents the sum of all ‘carbon’ – short <strong>for</strong> greenhouse gases, the primary one<strong>be</strong>ing carbon dioxide – emitted over the lifetime of a product. Lifetime includes extractionof raw materials, manufacturing, distribution, use and disposal, often expressed as ‘cradleto-grave’coverage. The common unit of a footprint is CO 2 e, meaning carbon-dioxideequivalents,usually expressed in g, kg or tonnes. Footprints have <strong>be</strong>en estimated <strong>for</strong> manyproducts and services, from average European passenger-car transport (current footprintaround 180 g CO 2 e/km) to production of potato crisps (around 75g CO 2 e <strong>for</strong> a 33.5g packetof potato crisps, including the packaging).What is a tank container’s footprint? For a typical 24-tonne shipment, originating in Chinaand terminating in Western Europe, the carbon footprint is 422 g CO 2 e per kg of productshipped (or about 19.5 g CO 2 e per tonne-kilometre). This is smaller than the footprint ofmanufacturing, say, a chemical – where production footprints generally fall in the range of1-4 kg CO 2 e per kg of product. This footprint can <strong>be</strong> disaggregated in three ways: byfunction, by life-cycle phase and by greenhouse-gas.5.1.1 By functionThe disaggregated carbon-footprint of the China-Europe shipment by function can <strong>be</strong>expressed in absolute (Figure 2) or percentage (Figure 3) terms.Figure 2: Absolute carbon footprint by function, ISO tank container shipment from China to Europe1 pS h ip p in g ,IS O ,C N -E u r, Life t im e4 2 20 . 0 0 0 2 8 1 pIS O T an k , Bld &D isp o se0 . 0 4 2 1 pT ran sp o rt ,IS O ,1 -w ay C N -E u r0 .0 4 2 1 pLo sse s/ D isp , IS O5 . 8 84 1 23 . 6 70 . 0 0 0 2 8 1 pIS O T an k2 . 3 2 E 4 t k mT ran sp o rt ,t ran so c e an icfre ig h t sh ip / O C E S6 5 7 t k mT ran sp o rt , lo rry> 3 2 t , E U RO 3 / RE RS1 . 1 7 E 3 t kmT ran sp o rt , fre ig h t ,rail/ RE R S3 9 4 t kmT ran sp o rt , lo rry> 3 2 t , E U RO 5 / RE RS4 4 . 5 M JH e at , n at u ral g as,at in d u st rialfu rn ac e lo w -N O x5 . 8 32 4 97 6 .84 64 0 . 93 . 4 60 . 6 6 kgS t e e l, e le c t ric ,c h ro m iu m st e e l1 8 / 8 , at p lan t /RE R0 . 9 9 6 k gM e t al p ro d u c tm an u fac t u rin g ,av e rag e m e t al2 . 5 41 .8 512 Octo<strong>be</strong>r 2011
Figure 3: Percentage carbon footprint by function, ISO tank container shipment from China to Europe1 pShipping,ISO ,CN-Eur,Lifetime100%0.000281 pISO T ank, Bld &Dispose0.0421 pT ransport,ISO ,1-w ay CN-Eur0.0421 pLosses/Disp,ISO1.39%97.7%0.87%0.000281 pISO T ank2.32E4 tkmT ransport,transoceanicfreight ship/O CE S657 tkmT ransport, lorry>32t, EURO 3/RERS1.17E3 tkmT ransport, freight,rail/RER S394 tkmT ransport, lorry>32t, EURO5/RERS44.5 MJHeat, natural gas,at industrialfurnace low -NO x1.38%59%18.2%10.9%9.7%0.82%0.66 kgSteel, electric,chromium steel18/8, at plant/RER0.996 kgMetal productmanufacturing,average metal0.603%0.44%Either way, there are three primary functions in the footprint: construction and disposal ofthe tank container; transport operations, by ship, rail and road; plus losses and disposal.Clearly, the main contributor to the footprint is transport operations. It accounts <strong>for</strong> 98% ofthe total footprint, construction and disposal <strong>for</strong> just over 1%, with the slightly less than 1%remaining to losses and disposal (most of which is generated by tank cleaning).5.1.2 By life-cycle phaseTransport’s dominance of the footprint is again obvious, when the result is presented bylife-cycle phase (Figure 4).Figure 4: Carbon footprint by life-cycle phase, ISO tank container shipment from China to Europekg CO2e/tonne shipped25020015010050013 Octo<strong>be</strong>r 2011
Although the ‘ocean freight’ portion of the journey accounts <strong>for</strong> the largest single part of thefootprint, nearly 60% of the total, it is <strong>for</strong> a much larger distance, some 20,000 km fromShanghai to Rotterdam. Truck transport is only <strong>for</strong> 1,600 km, and rail <strong>for</strong> 1,700 km.5.1.3 By greenhouse gas (GHG)Of the three main greenhouse gases, carbon dioxide dominates the ISO tank footprint (Table1). This is not surprising, given that the transport is dominant, and carbon dioxide isdominant in transport.Table 1: Carbon footprint by life-cycle phase, ISO tank shipment from China-EuropeGreenhouse gasFootprintkg CO 2 e/journeyProportionof totalCarbon dioxide 406.6 96%Methane 3.3 1%Dinitrogen monoxide (N 2 O) 10.8 3%Remaining airborne emission 1.2
create an order-of-magnitude less environmental impact 2 . Still, this comparison is of limitedvalue, <strong>be</strong>cause tank containers and passenger cars are not competing modes of transport.A more useful application of eco-points, in this instance, is to measure them by percentagethroughout the ISO tank lifetime (Figure 5). This shows that the distribution of overall ecoimpactsis almost identical to that of the carbon footprint (Figure 3).Figure 5: Percentage total eco-impact by function, ISO <strong>Tank</strong> shipment from China to Europe1 pShipping,ISO,CN-Eur,Lifetime100%0.000281 pISO <strong>Tank</strong>, Bld &Dispose0.0421 pTransport,ISO,1-way CN-Eur0.0421 pLosses/Disp,ISO1.39%97.8%0.758%0.000281 pISO <strong>Tank</strong>2.32E4 tkmTransport,transoceanicfreight ship/OCE657 tkmTransport, lorry>32t,EURO3/RER S1.17E3 tkmTransport,freight, rail/RER S394 tkmTransport, lorry>32t,EURO5/RER S44.5 MJHeat, natural gas,at industrialfurnace low-NOx1.39%62%17.3%9.58%8.97%0.745%0.66 kgSteel, electric,chromium steel18/8, at0.621%0.996 kgMetal productmanufacturing,average metal0.456%What this means is that, <strong>for</strong> an ISO tank, a carbon footprint is an excellent proxy <strong>for</strong> overalleco-impact. So, rather than using eco-points to discuss an ISO tank’s environmental impact,carbon footprints will do the job just as well – and they are more understandable to nonspecialistaudiences.5.3 Variations in transport footprintsFor the China-to-Europe journey descri<strong>be</strong>d above, the carbon footprint has <strong>be</strong>en compiledfrom the ecoinvent database (ecoinvent 2010), with particular reliance on its transportmodules (ecoinvent 2007). Why ecoinvent? Of the available databases <strong>for</strong> carbon footprintsand life-cycles assessments, ecoinvent is clearly the most authoritative and comprehensive,and it is probably the most-used by environmental analysts.Although ecoinvent is most authoritative, its assignation of precise figures – <strong>for</strong> instance inTable 1 and throughout the above text – <strong>be</strong>lie the inherent variation of carbon footprintdata. Clearly, there is a broad spread among reported figures (Table 2).2 A typical passenger car weighs about one tonne. So comparing the eco-points per tonne-kilometre, the ISO<strong>Tank</strong>’s impact is about one-tenth that of the passenger car.15 Octo<strong>be</strong>r 2011
Table 2: Emission factors <strong>for</strong> freight transport (g CO 2 e/tkm)Source Comment Mode ReferenceRoad Rail MarineType Factor Type Factor Type FactorecoinventUsed in thisreportTruck>32 t,China117Europeanaverage39.4 Transoceanicfreight ship10.7 (ecoinvent2010)CEFIC 3RecommendedaveragefactorsTruck 104>32 t,EuropeTruck 62 Rail,unspecified22 Deep-seacontainerDeep-seatanker85(McKinnonand Piecyk2010)IMODEFRAAll railfreightBargeProductstankerContainerGeneralcargo21 Smallcontainer315.7-4512.5-36.311.9-19.813.5(InternationalMaritimeOrganization2009)(CEFIC andECTA 2011)BSR CleanCargoMcKinnon,based onCoyleSize and loadvariations10 t,50%load151.1LargercontainerAvg deepseacontainer11.58.4 (CEFIC andECTA 2011)(CEFIC andECTA 2011)INFRAS29 t,100%load39.7All railDiesel22.738(CEFIC andECTA 2011)Electric19In transport, this variability of emission factors is a function of four influences:• Mode – In almost all cases, carbon intensity descends in the order oftruck>rail>marine transport.3 European Chemical Industry Council16 Octo<strong>be</strong>r 2011
• Definition of the transport – is it an average or a more-specific measure, is it globalor regional, is it an average of several types (say, all ocean-going ships)? What loadfactorsand repositioning movements are assumed?• Per<strong>for</strong>mance – fuel efficiency, hence emissions intensity, can vary significantly byvehicle type and technology. Operating conditions and maintenance regimes ofteninfluence per<strong>for</strong>mance as well.• Measurement – actual versus imputed values can differ. These differences,however, are usually smaller than those caused by definitions and per<strong>for</strong>mance.17 Octo<strong>be</strong>r 2011
6 How ISO tank containers make transport more sustainableTwo aspects of tank containers make them most sustainable than some competingtransport options. One, using an ISO tank operator rather than dedicated transport canreduce deadhead journeys significantly. Two, tank containers are inherently multi-modal,which can <strong>be</strong> far-less carbon intensive than mono-modal trucking, steel drums and even railtransport. These aspects, and their <strong>be</strong>nefits, are detailed in the following subsections.6.1 Reduction of deadhead trips<strong>Tank</strong> operators (see section 4.1) typically manage a fleet of containers that serve a variety ofcustomers. Because the containers are readily cleaned and are uni<strong>for</strong>m, it is easy <strong>for</strong> themto go from one cargo to another completely-different one. This flexibility is critical tooperators, who want to minimise empty journeys out of their own and their customers’economic interest. Avoiding deadheads is also in everyone’s environmental interest.For marine tankers shipping liquid cargoes, deadheading or partial-load journeys arecommon. According to (International Maritime Organization 2009, Table 9.1, page 131), loadfactors 4 <strong>for</strong> tankers are around 50%, while those <strong>for</strong> tank operators are 85% (Table 3).Table 3: Load factors <strong>for</strong> cargo shipping, by typeType of shipping Average load factorCrude oil tanker 48%Products tanker 45-55%Chemical tanker 64%LPG tanker 48%LNG tanker 48%Container 70%ISO tank operators 85%How does this work in practice? Take, <strong>for</strong> example, a Glasgow-Melbourne route travelled bya Scottish exporter of whisky to Australia. If whisky is shipped one-way and the tankcontainer is returned empty to Scotland, the resulting footprint is 318 kg CO 2 e per tonne ofwhisky. If, instead of returning empty, a cargo of wine is picked up in Australia and returnedto the UK, the resulting footprint per tonne of whisky/wine shipped is about 15% lower.6.2 Ease of multi-modal transport<strong>Tank</strong> containers are inherently multi-modal, transferring easily and quickly from ships tobarges to rail to road. Being able to travel on the water can significantly reduce a journey’sfootprint. For example, the footprint of a cargo shipped by sea from Le Havre (France) to StPetersburg (Russia) is nine times lower than by road. If it goes by rail, the footprint is aboutfive times lower than by road. This order-of-magnitude difference applies to most anyjourney where either water, rail or road transport are viable options.Multi-modal transport’s advantage is its flexibility. For instance, tank containers recentlyhave <strong>be</strong>en shipped from Antwerp to central Asia by rail, rather than by ship and truck. It ispossible that this first option generates a lower footprint, and in any case, these sorts ofmulti-modal shipments are less accessible when shipping in bulk.4 IMO calls them capacity utilization18 Octo<strong>be</strong>r 2011
7 Areas <strong>for</strong> possible improvementAs the world’s population and temperature continue to rise, so too will popular pressure <strong>for</strong>more sustainability. While details of “what-should-<strong>be</strong>-done” and “how-to-do-it” are still verydebatable, one trend is fairly clear: de-carbonisation. Industries, institutions and individualswill <strong>be</strong> expected to cut their carbon footprints. Freight transport generates some 10% of allgreenhouse-gas emissions, so along with other sectors, it will <strong>be</strong> pushed – <strong>for</strong>mally andin<strong>for</strong>mally – to decarbonise. One researcher (Lindstad, Asbjornslett et al. 2011, p 3456)estimates that carbon emissions (per ton-kilometre) <strong>for</strong> sea transport will need to fall by2050 to 20% of their current level.<strong>Tank</strong> containers are already part of this trend. Owners and operators are steadily working toimprove economic efficiency, which as a side effect also lowers carbon emissions.So, what can the tank container industry do above what it is doing already? There is no‘single solution’, no secret <strong>for</strong>mula that will deliver major reductions. However, there areseveral actions that might <strong>be</strong> explored, three of them internal to ITCO mem<strong>be</strong>rs and two ofthem affecting the freight industry as a whole.7.1 ITCO-internal actionsThere are three areas that might <strong>be</strong> explored. One of these relates to tank container design,one to modal optimisation and one to emissions measurement.7.1.1 Reduction in tare weight, increase in capacityIn any transport mode, more weight equals more carbon. For example in road transport,weight reduction has <strong>be</strong>en a leading factor in carbon-efficiency improvements of the pastseveral decades. As noted earlier (seesection 4.1), tank container tareweight has <strong>be</strong>en reduced commonlyby 10%, and capacities have increasedwithin the same ISO frame. Thestandard 25,000 litre capacity is 20%larger and built to a higher standardof safety than those common in the1970s.It would <strong>be</strong> useful <strong>for</strong> ITCO to:quantify the tare weight and capacitytrends in tank containers; and explorethe potential <strong>for</strong> future reductions.7.1.2 Improved aerodynamicsIn freight transport by road, aerodynamic drag accounts <strong>for</strong> about one-third of a vehicle’senergy consumption. According to a study <strong>for</strong> the UK Department <strong>for</strong> Transport (Baker,Cornwell et al. 2010), a ‘typical’ aerodynamic improvement package costing some $5,000per new trailer could cut carbon emissions by about 10%. For existing cabs and trailers,aftermarket packages costing $500-2500 can cut carbon by 0.1-6.5%.19 Octo<strong>be</strong>r 2011
It would <strong>be</strong> useful <strong>for</strong> ITCO to investigate the technical feasibility, economics and carbon<strong>be</strong>nefits of improving tank container aerodynamics.7.1.3 Modal optimisationAs noted previously, carbon intensity of transport generally descends in the order oftruck>rail>marine modes. In other words, the carbon footprint of shipping X tonnekilometresby sea will <strong>be</strong> less than by rail, and both will <strong>be</strong> less than by road.Where this gets tricky is in (potentially) multi-modal transport. For instance, should ashipment from Western Europe to central Asia go via rail or via a combination of sea androad?The economics of such movements are regularly analysed by tank container operators, withan eye to optimising the costs and<strong>be</strong>nefits. It would <strong>be</strong> useful <strong>for</strong>ITCO to investigate the feasibilityof including ‘carbon optimisation’in such analyses.7.1.4 Improved emission-factordatasetsCarbon footprints are estimatedvia input-output models (seeSection 5.1) that rely heavily onemission factors <strong>for</strong> variousprocesses. A carbon emissionfactor is typically expressed as Xunits of CO 2 e (carbon dioxideequivalent) per unit of function.For instance, the emission factorof a new European automobile’s isaround 150 g CO 2 e per kilometre driven.Emission factors <strong>for</strong> various processes are published by researchers and governmentagencies, and they are compiled in databases such as ecoinvent. Although in many cases theavailable emission factors are sufficient to drive decisions, researchers readily admit thatthey could and should <strong>be</strong> improved (see Section 5). Three main deficiencies are evident:• Data-gaps – emission factors <strong>for</strong> many processes are unavailable. Carbonfootprinting is a relatively new discipline, dating back probably about 20 years. Formany processes – say, transport via tank container – no standard factors areavailable. For others, published factors sometimes are out-of-date.• Inappropriate scope – published factors sometimes are over-aggregated or underaggregated<strong>for</strong> particular analyses. For instance, general ‘road freight’ factors of 127-156 g CO 2 e/tonne-kilometre are cited by (International Maritime Organization 2009,Table 9.2), while work commissioned by CEFIC (McKinnon and Piecyk 2010, Table 8)recommends an average factor of 62 g CO 2 e/tonne-kilometre. Reasons <strong>for</strong> thedifference are not entirely clear, but probably due to relative over-aggregation byIMO and under-aggregation by CEFIC. An example of under-aggregation is in power-20 Octo<strong>be</strong>r 2011
generation emission factors. Factors of g CO 2 e per kWh vary dramatically by countryand by fuel type, yet finding a European average <strong>for</strong> them can <strong>be</strong> challenging.• Lack of transparency – many, if not most, published factors are unclear about vehicletype, fuel type and load factors (both percentage loads and repositioning distances).To address these deficiencies, ITCO or its mem<strong>be</strong>rs might consider publishing its own factors<strong>for</strong> transport via tank containers. This would not contribute directly to de-carbonisation, butit would help actual de-carbonisation to <strong>be</strong> measured properly and not <strong>be</strong> confused withmis-measurement.7.2 ITCO-external actionsThere are two areas that might <strong>be</strong> explored. One is a general ‘watching brief’ on industrytrends; the other relates specifically to operations.7.2.1 Watching brief: ef<strong>for</strong>ts to measure and reduce shipping emissionsTo <strong>be</strong> competitive, transport operators and vehicle suppliers are naturally inclined to decarbonise,mainly by improving efficiency. ITCO mem<strong>be</strong>rs already do this (see above),through research and development sponsored individually, through governments and tradeassociations. It might make sense to <strong>for</strong>malise ITCO’s role in this by assigning to a specificperson or group a watching brief:a periodic survey of trends andpolicies in this area. This probablywould entail a periodic review ofreports from governments andtrade associations.7.2.2 Reductions in marine travelspeedOne option <strong>for</strong> cutting marineshippingcarbon emissions notmentioned by the IMO(International MaritimeOrganization 2009) is that ofreducing average speeds. A recentstudy by the Norwegian Instituteof Marine Technology (Lindstad,Asbjornslett et al. 2011) estimates that cost-neutral speed reductions 5 would reduce marinecarbon emissions by 28%. At the same time, to maintain capacity, this reduction wouldrequire a 19% increase in the shipping fleet.Clearly, this sort of step change would require far more support than that of ITCO.Nonetheless, its promise of de-carbonisation coupled with industry growth is surely worthfurther investigation.5 Cost-neutral meaning that shipping times would <strong>be</strong> increased only as much as could <strong>be</strong> saved by increases infuel economy.21 Octo<strong>be</strong>r 2011
8 ReferencesBaker, H., R. Cornwell, et al. (2010). Review of low carbon technologies <strong>for</strong> heavy goodsvehicles, Sponsored by UK Dept Transport.CEFIC and ECTA (2011). Guidelines <strong>for</strong> Measuring and Managing CO2 Emission fromFreight Transport Operations Sponsored by CEFIC, ECTA.ecoinvent (2007). Transport services.ecoinvent (2010). LCI Database. St Gallen, Switzerland. Current database is V 2.2.International Maritime Organization (2009). Second IMO GHG Study 2009. London,International Maritime Organization.Lindstad, H., B. E. Asbjornslett, et al. (2011). "Reductions in greenhouse gas emissions andcost by shipping at lower speeds." Energy Policy 39: 3456-3464.McKinnon, A. and M. Piecyk (2010). Measuring and managing CO2 emissions of europeanchemical transport, Sponsored by CEFIC.22 Octo<strong>be</strong>r 2011