- Page 1 and 2:
NuclearCardiology:The BasicsHow to
- Page 3 and 4:
iiCONTEMPORARY CARDIOLOGYCHRISTOPHE
- Page 5 and 6:
iv© 2004 Humana Press Inc.999 Rive
- Page 7 and 8:
viPrefacetechnologists, laboratory
- Page 9 and 10:
viii
- Page 12 and 13:
xiAUTHORS’ AFFILIATIONSFrans J. T
- Page 14 and 15:
USING THIS BOOK AND THE COMPANION C
- Page 16 and 17:
Chapter 1 / Getting Started 11Getti
- Page 18 and 19:
Chapter 1 / Getting Started 3Fig. 1
- Page 20 and 21:
Chapter 1 / Getting Started 5• Ta
- Page 22 and 23:
Chapter 1 / Getting Started 7• Te
- Page 24 and 25:
Chapter 1 / Getting Started 9SUPPLI
- Page 26 and 27:
Chapter 1 / Getting Started 11Fig.
- Page 28 and 29:
13Table 1-1Considerations for Using
- Page 30 and 31:
Chapter 1 / Getting Started 15Quali
- Page 32 and 33:
Chapter 1 / Getting Started 17The M
- Page 34:
Chapter 1 / Getting Started 19In th
- Page 37 and 38:
22 Nuclear Cardiology, The BasicsTa
- Page 40 and 41:
25Two-Day Tc-99m ProtocolsTable 2-3
- Page 42 and 43:
Chapter 2 / Laboratory Logistics 27
- Page 44:
Chapter 2 / Laboratory Logistics 29
- Page 47 and 48:
32 Nuclear Cardiology, The BasicsTa
- Page 49 and 50:
34 Nuclear Cardiology, The BasicsRa
- Page 51 and 52:
36 Nuclear Cardiology, The Basics12
- Page 53 and 54:
38 Nuclear Cardiology, The Basics
- Page 55 and 56:
40 Nuclear Cardiology, The Basics
- Page 58 and 59:
Chapter 5 / Stress Procedures 435St
- Page 60 and 61:
Chapter 5 / Stress Procedures 45Fig
- Page 62 and 63:
Chapter 5 / Stress Procedures 47Tab
- Page 64 and 65:
Chapter 5 / Stress Procedures 49app
- Page 66 and 67:
Chapter 5 / Stress Procedures 51•
- Page 68 and 69:
Chapter 5 / Stress Procedures 53Fig
- Page 70 and 71:
Chapter 5 / Stress Procedures 55Fig
- Page 72 and 73:
Chapter 5 / Stress Procedures 57CAR
- Page 74:
Chapter 5 / Stress Procedures 59SEL
- Page 77 and 78:
62 Nuclear Cardiology, The BasicsTa
- Page 79 and 80:
64 Nuclear Cardiology, The BasicsTa
- Page 81 and 82:
66 Nuclear Cardiology, The BasicsAc
- Page 83 and 84:
68 Nuclear Cardiology, The BasicsFi
- Page 85 and 86:
70 Nuclear Cardiology, The Basicscr
- Page 87 and 88:
72 Nuclear Cardiology, The BasicsLe
- Page 89 and 90:
74 Nuclear Cardiology, The BasicsTa
- Page 91 and 92:
76 Nuclear Cardiology, The BasicsTa
- Page 93 and 94:
78 Nuclear Cardiology, The BasicsFi
- Page 95 and 96:
80 Nuclear Cardiology, The BasicsFi
- Page 97 and 98:
82 Nuclear Cardiology, The BasicsAC
- Page 99 and 100:
84 Nuclear Cardiology, The BasicsCo
- Page 101 and 102:
86 Nuclear Cardiology, The BasicsTa
- Page 103 and 104:
88 Nuclear Cardiology, The BasicsFi
- Page 105 and 106:
90 Nuclear Cardiology, The BasicsRV
- Page 107 and 108:
92 Nuclear Cardiology, The BasicsTa
- Page 109 and 110:
94 Nuclear Cardiology, The BasicsTa
- Page 112 and 113:
Chapter 10 / Display and Analysis o
- Page 114 and 115:
Chapter 10 / Display and Analysis o
- Page 116 and 117:
Chapter 10 / Display and Analysis o
- Page 118 and 119:
Chapter 10 / Display and Analysis o
- Page 120 and 121:
Chapter 10 / Display and Analysis o
- Page 122 and 123:
Chapter 10 / Display and Analysis o
- Page 124 and 125:
Chapter 10 / Display and Analysis o
- Page 126 and 127:
Chapter EMORY TOOLBOX® 10 / Displa
- Page 128 and 129:
Chapter 10 / Display and Analysis o
- Page 130 and 131:
Chapter 4DM-SPECT® 10 / Display (C
- Page 132 and 133:
Chapter 10 / Display and Analysis o
- Page 134 and 135:
Chapter 10 / Display and Analysis o
- Page 136 and 137:
Chapter 10 / Display and Analysis o
- Page 138 and 139:
Chapter 10 / Display and Analysis o
- Page 140:
Chapter 10 / Display and Analysis o
- Page 143 and 144:
128 Nuclear Cardiology, The BasicsF
- Page 145 and 146:
130 Nuclear Cardiology, The BasicsF
- Page 147 and 148:
132 Nuclear Cardiology, The BasicsF
- Page 149 and 150:
134 Nuclear Cardiology, The BasicsS
- Page 151 and 152:
136 Nuclear Cardiology, The BasicsF
- Page 153 and 154:
138 Nuclear Cardiology, The BasicsF
- Page 155 and 156:
140 Nuclear Cardiology, The BasicsF
- Page 158 and 159:
Chapter 14 / Artifacts and Technica
- Page 160 and 161:
Chapter 14 / Artifacts and Technica
- Page 162 and 163:
Chapter 14 / Artifacts and Technica
- Page 164 and 165:
Chapter 14 / Artifacts and Technica
- Page 166 and 167:
Chapter 14 / Artifacts and Technica
- Page 168 and 169:
Chapter 14 / Artifacts and Technica
- Page 170 and 171:
Chapter 14 / Artifacts and Technica
- Page 172 and 173:
Chapter 14 / Artifacts and Technica
- Page 174 and 175:
Chapter 14 / Artifacts and Technica
- Page 176 and 177:
Chapter 14 / Artifacts and Technica
- Page 178 and 179: Chapter 14 / Artifacts and Technica
- Page 180 and 181: Chapter 14 / Artifacts and Technica
- Page 182 and 183: Chapter 14 / Artifacts and Technica
- Page 184 and 185: Chapter 14 / Artifacts and Technica
- Page 186 and 187: Chapter 14 / Artifacts and Technica
- Page 188 and 189: Chapter 14 / Artifacts and Technica
- Page 190 and 191: Chapter 14 / Artifacts and Technica
- Page 192 and 193: Chapter 14 / Artifacts and Technica
- Page 194 and 195: Chapter 14 / Artifacts and Technica
- Page 196 and 197: Chapter 14 / Artifacts and Technica
- Page 198 and 199: Chapter 14 / Artifacts and Technica
- Page 200 and 201: Chapter 14 / Artifacts and Technica
- Page 202 and 203: Chapter 14 / Artifacts and Technica
- Page 204 and 205: Chapter 14 / Artifacts and Technica
- Page 206 and 207: Chapter 14 / Artifacts and Technica
- Page 208 and 209: Chapter 14 / Artifacts and Technica
- Page 210 and 211: Chapter 14 / Artifacts and Technica
- Page 212 and 213: Chapter 14 / Artifacts and Technica
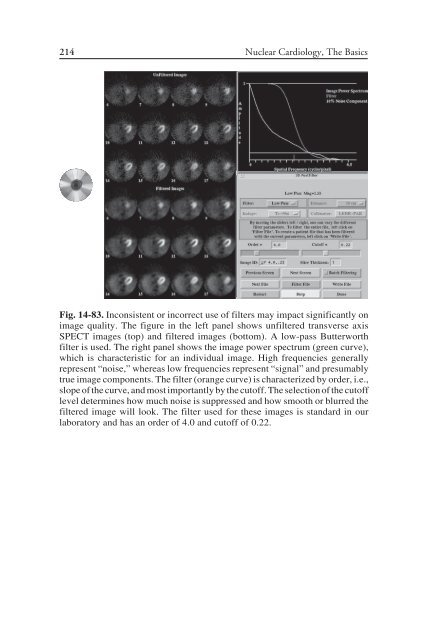
- Page 214 and 215: Chapter 14 / Artifacts and Technica
- Page 216 and 217: Chapter 14 / Artifacts and Technica
- Page 218 and 219: Chapter 14 / Artifacts and Technica
- Page 220 and 221: Chapter 14 / Artifacts and Technica
- Page 222 and 223: Chapter 14 / Artifacts and Technica
- Page 224 and 225: Chapter 14 / Artifacts and Technica
- Page 226 and 227: Chapter 14 / Artifacts and Technica
- Page 230 and 231: Chapter 14 / Artifacts and Technica
- Page 232 and 233: Chapter 14 / Artifacts and Technica
- Page 234 and 235: Chapter 14 / Artifacts and Technica
- Page 236 and 237: Chapter 14 / Artifacts and Technica
- Page 238 and 239: Chapter 14 / Artifacts and Technica
- Page 240 and 241: Chapter 14 / Artifacts and Technica
- Page 242 and 243: Chapter 14 / Artifacts and Technica
- Page 244 and 245: Chapter 14 / Artifacts and Technica
- Page 246 and 247: Chapter 14 / Artifacts and Technica
- Page 248 and 249: Chapter 14 / Artifacts and Technica
- Page 250 and 251: Chapter 14 / Artifacts and Technica
- Page 252 and 253: Chapter 14 / Artifacts and Technica
- Page 254 and 255: Chapter 15 / Nuclear Cardiology Rep
- Page 256 and 257: Chapter 15 / Nuclear Cardiology Rep
- Page 258 and 259: Chapter 15 / Nuclear Cardiology Rep
- Page 260 and 261: Chapter 15 / Nuclear Cardiology Rep
- Page 262 and 263: Chapter 15 / Nuclear Cardiology Rep
- Page 264 and 265: Chapter 16 / Remote Reading and Net
- Page 266 and 267: Chapter 16 / Remote Reading and Net
- Page 268: Chapter 16 / Remote Reading and Net
- Page 271 and 272: 256 Table 17-1 Nuclear Cardiology,
- Page 273 and 274: 258 Nuclear Cardiology, The BasicsB
- Page 275 and 276: 260 Nuclear Cardiology, The BasicsF
- Page 277 and 278: 262 Nuclear Cardiology, The BasicsF
- Page 279 and 280:
264 Nuclear Cardiology, The BasicsT
- Page 282 and 283:
Chapter 18 / Other Laboratory Proto
- Page 284 and 285:
Chapter 18 / Other Laboratory Proto
- Page 286 and 287:
Chapter 18 / Other Laboratory Proto
- Page 288 and 289:
Chapter 18 / Other Laboratory Proto
- Page 290 and 291:
Chapter 19 / Emergency Department I
- Page 292 and 293:
Chapter 19 / Emergency Department I
- Page 294 and 295:
Chapter 19 / Emergency Department I
- Page 296 and 297:
Chapter 20 / Coding and Billing 281
- Page 298 and 299:
Chapter 20 / Coding and Billing 283
- Page 300 and 301:
Chapter 20 / Coding and Billing 285
- Page 302:
Chapter 20 / Coding and Billing 287
- Page 305 and 306:
290 Nuclear Cardiology, The BasicsF
- Page 308 and 309:
Index 293INDEXAccreditation, see La
- Page 310 and 311:
Index 295linearity, 259, 261prevent
- Page 312 and 313:
Index 297Planar equilibrium radionu