Annual Report 2010-2011 - Lake Macquarie City Council
Annual Report 2010-2011 - Lake Macquarie City Council
Annual Report 2010-2011 - Lake Macquarie City Council
- No tags were found...

Create successful ePaper yourself
Turn your PDF publications into a flip-book with our unique Google optimized e-Paper software.
2<strong>City</strong> of <strong>Lake</strong> <strong>Macquarie</strong>- <strong>Annual</strong> <strong>Report</strong> 2009/<strong>2010</strong>messagefrom the mayorOn behalf of the elected <strong>Council</strong>, I am pleased topresent <strong>Lake</strong> <strong>Macquarie</strong> <strong>City</strong> <strong>Council</strong>’s <strong>2010</strong>/<strong>2011</strong><strong>Annual</strong> <strong>Report</strong>.This <strong>Annual</strong> <strong>Report</strong> reflects on what I believe tohave been another successful <strong>Council</strong> performance.On reflection, what stands out to me is the manyimprovements to community facilities around the city.Charlestown has been a big winner for communityfacilities thanks to the redevelopment of CharlestownSquare. Residents are benefiting from the completionof new facilities at Charlestown Oval as well as theopening of The Place: Charlestown Community Centre.With a development as large as at Charlestown,<strong>Council</strong> was determined to see an improved publicdomain and I believe that has been achieved thanks toimprovements to Pearson Street, construction of newbus infrastructure, and the North and South Piazza.I expect all our town centres will become moreattractive places to visit, as <strong>Council</strong> developsstreetscape master plans for the individual areas.Once the pain of the development phase passes, Ibelieve we will have local town centres promotingbusiness opportunities, jobs, and keeping up withcommunity expectations.On a smaller scale some of our community facilitieshave been upgraded including accessibility worksat Teralba Petanque Centre, Argenton CommunityHall, Teralba Community Hall, and Caves Beach SurfClub. <strong>Council</strong> has also constructed a pontoon jetty atBlacksmiths; a new amenities block and car park atEvans Park, Cardiff; and <strong>Lake</strong> <strong>Macquarie</strong>’s best skatepark at Chapman Oval, Swansea.I doubt many residents are unaware that one of<strong>Council</strong>’s major priorities is managing our waste in thefuture. Our landfill at Awaba is nearly full and undercurrent regulation it will be very difficult to get approvalfor a new one, or even an expansion of the existing site,unless we make significant and costly changes to oursystem.<strong>Council</strong> officers developed a Draft Waste Strategy,which included assessing and analysing the city’scurrent waste system and issues, investigating howother councils manage waste, evaluating waste optionssuitable for our city, and consulting with our communityon waste issues and options. <strong>Council</strong> adopted afavoured waste system, which includes three binsfor residents to sort their waste. The decision wasmade after months of investigation, consultation, andtechnical analysis. Our next step is to educate residentson how the three bin system will operate.We are still continuing with our strong focus onenvironmental sustainability and this year developedthe Environmental Sustainability Action Plan <strong>2011</strong>-2018. This plan provides a framework for sustainabilityplanning, and decision-making and action, to achieveimproved environmental sustainability for <strong>Lake</strong><strong>Macquarie</strong>.We are also continuing with our works to ensure ourwaterways are clean and healthy. We implementedon-ground ecosystem enhancement projects includingthe installation of five Stormwater Quality ImprovementDevices, foreshore and streambank stabilisation at eightsites, and wetland and saltmarsh rehabilitation at 12sites.I am proud to report that we were the first <strong>Council</strong> toreceive Silver Partner status in the NSW Government’sSustainability Advantage Program that recognises<strong>Council</strong>’s action to improve both its environmentalperformance and financial bottom line. Being involvedin the program gave us an opportunity to prove thevalue we return to ratepayers by making sure we arebeing cost-efficient in the way we run our services. Sofar our involvement has helped us save $150,000 and736 tonnes of greenhouse gas emissions. The programinitially focussed on <strong>Council</strong>’s Works Depot andAdministration Building, and it is now being rolled out toa range of <strong>Council</strong> facilities.Another highlight was <strong>Council</strong> being acknowledgedas one of six Climate Change Adaptation Champions.Since 2007, <strong>Council</strong> has actively researched and takenaction to adapt to predicted climate changes with apriority on the effects of sea level rise and increasedflooding. Receiving this national recognition is veryencouraging for us and justifies the effort our staff havemade in this very challenging policy area.As you can see from some of the highlights statedabove, <strong>Council</strong> has had another successful year acrossmany areas. I am pleased to present this report toinform our community on <strong>Council</strong>’s performance duringthe reporting period.Cr Greg Piper MPMayor
3message from thegeneral managerCurrent economic and legislative conditions – ratepegging, cost shifting from other levels of government,and increasing costs – have all restricted our ability tomeet existing and emerging community priorities fromcurrent income. In past years, <strong>Council</strong> consistentlydelivered balanced budgets. However, cost increaseshave meant we have had to draw on the <strong>City</strong>’s assetreplacement reserves to achieve this result. If thingsstayed the same, a $132 million budget deficit wasprojected over the next seven years.<strong>Council</strong> has an extensive asset base, valued at over $2billion. Most of this is infrastructure used for the deliveryof services including roads, bridges, drains, buildings,and parks. These assets deteriorate over time. As<strong>Council</strong> has not had sufficient funds to maintain andreplace its infrastructure, a backlog of works has builtup. The current estimated cost to bring the infrastructureup to a satisfactory standard is $67 million.Deteriorating infrastructure is a major issue for localgovernment across Australia.Faced with these challenges, <strong>Council</strong> first looked atways to save money and increase income.Earlier this year, staff completed a comprehensive2-year service review project. Professor Brian Dollery,Centre for Local Government, University of New Englandsaid “in my many years of researching local governmentreform I have not experienced as comprehensive areview process.”The review demonstrated that our operations werealready lean – our employee costs are the lowest percapita of our comparable councils. However, dedicatedstaff across the organisation still managed to makeapproximately $4 million in savings and improvements.Whilst $4 million was helpful, it did not, on its own,address <strong>Council</strong>’s future financial sustainability, so staffwere encouraged to put their minds to entrepreneurialactivities to generate additional income to reduce therate burden on residents.<strong>Lake</strong>mac Enterprises was established as a businessunit of <strong>Council</strong> and is expected to generate revenue inexcess of $1 million per year within five years.Additionally, a new 5-year Investment Property Strategyto expand entrepreneurial opportunities projects averageproceeds of $6 - $9 million per year over the next fiveyears, and staff efforts in managing occupational healthand safety resulted in savings of $104,848 compared tothe previous financial year.The total benefit of the service review is estimated to bebetween $10 - $14 million per year.In 2006, council invested $3 million in a CollaterisedDebt Obligation (CDO) known as Ashwell Security Series2006. During the turmoil of the global financial crisis,the market value of this particular security dropped toless than 20c in the dollar but thankfully the marketsassociated with this investment began to recover in June2009. By April this year, the investment matured and<strong>Council</strong> redeemed the full market value.We are committed to accountability, performancereporting, and demonstrating progress in deliveringprojects and community outcomes. During <strong>2010</strong>/<strong>2011</strong>,we achieved 83% of the targets we set for ourselves asa <strong>Council</strong>.During the past two years, the Asset Managementdepartment was restructured to address a numberof important issues, including the requirements of thenew Integrated Planning and <strong>Report</strong>ing FrameworkNSW, and to take a more strategic approach to assetmanagement. An Asset Management Strategy wasprepared, and separate Asset Management Plans weredeveloped for roads, transportation, stormwater, parksand reserves, and buildings. This gives us a far betterindication of our current asset condition and also thefuture maintenance and replacement needs. Theseplans were reviewed by the NSW Division of LocalGovernment and received a favourable assessment.Despite this extensive work from our committed staff,the current financial challenges mean that we cannotcontinue to provide the existing level of services withincurrent budget arrangements. <strong>Council</strong> is consideringmaking an application to the Independent Pricing andRegulatory Tribunal (IPART) for a special rate variation tosecure the funding our <strong>City</strong> will need.These are just some of the major challenges andachievements we have been busy with over the<strong>2010</strong>/<strong>2011</strong> financial year. I am proud of our staff for theircommitment to addressing the challenges we face. Ifyou would like further information about any of <strong>Council</strong>’sservices, visit www.lakemac.com.au or call one of ourcustomer service officers on 02 4921 0333.Brian BellGeneral Manager
The Year in Review 5The <strong>2010</strong>/<strong>2011</strong> <strong>Annual</strong> <strong>Report</strong> and Financial Statementsoffer a broad overview of <strong>Lake</strong> <strong>Macquarie</strong> <strong>City</strong> <strong>Council</strong>’sperformance over the financial year.The <strong>Annual</strong> <strong>Report</strong> outlines <strong>Council</strong>’s activities,outcomes, and financial position. It contains adetailed section on the organisation’s performanceagainst the <strong>2010</strong>/<strong>2011</strong> Operational Plan, andinformation about community-based services.A comprehensive report on the state of theenvironment is required once every four yearsfollowing a local government election. The lastcomprehensive report was published for 2008/2009.The next report is due for the <strong>2011</strong>/2012 financialyear. A summary of the state of our environment isincluded in this year’s <strong>Annual</strong> <strong>Report</strong>.Summary of <strong>Council</strong>’sPerformance in deliveringour Operational PlanWe achieved 83% of our targets for <strong>2010</strong>/<strong>2011</strong>compared to 84% for the 2009/<strong>2010</strong> period.Below is a summary of our performance in meetingthe targets set in the <strong>2010</strong>/<strong>2011</strong> Operational Plan.You can find details of individual targets in the‘Our Performance’ section of this <strong>Annual</strong> <strong>Report</strong>.<strong>2010</strong>/<strong>2011</strong> Final Status of Operational Plan Indicators by Focus AreaNumber of KPIsFocus AreasThe Year in Review
6<strong>City</strong> of <strong>Lake</strong> <strong>Macquarie</strong>- <strong>Annual</strong> <strong>Report</strong> <strong>2010</strong>/<strong>2011</strong>highlightsof <strong>2010</strong>/<strong>2011</strong>Our Environment<strong>Council</strong>’s inaugural sustainability event, LivingSmart Festival, attracted a crowd of 8,000 toSpeers Point Park. The event is an educationaland inspirational celebration of sustainable livingaimed to increase awareness of sustainabilitythrough music, dance, performance, presentation,stalls, workshops, art, fashion, and food.<strong>Lake</strong> <strong>Macquarie</strong> now has a total of 17 SustainableNeighbourhood groups across 30 suburbs whoare working towards reducing their ecologicalfootprint.<strong>Council</strong> joined the NSW Government’sSustainability Advantage Program to improveresource efficiency, engage its staff, and make itssupply chain more sustainable. <strong>Lake</strong> <strong>Macquarie</strong>is the first council to receive Silver Partner status.Our involvement so far has helped save $150,000and 736 tonnes of greenhouse gas emissions.Residents disposed of their waste responsibly bytaking advantage of drop off locations to recycle83.7 tonnes of eWaste, 184kg of batteries, 65kgof mobile phones, 175kg of light globes, and3.2 tonnes of Life Cycle products.Our CommunityThe Place: Charlestown Community Centre hasgiven community groups and residents a modernand centrally located venue to hold events,activities, and workshops.A number of <strong>Council</strong> facilities have undergoneaccessibility upgrading including Teralba andArgenton Community Halls (disability toilets andramps), Teralba Petanque Centre (disability toilet,ramp, and parking) and Caves Beach Surf Club (liftand disability toilet).As part of the NSW Graffiti Action Plan, <strong>Council</strong>partnered with the Department of Human Services- Juvenile Justice, and coordinated a graffitihotspot program to remove graffiti and implementstrategies to prevent the reoccurrence with fundstotalling $84,600 provided by the Department ofJustice and Attorney General.<strong>Council</strong> held an Aboriginal CommunityConsultation Forum aimed at developing betterways to communicate with the Aboriginalcommunity, increasing Aboriginal employmentwithin <strong>Lake</strong> <strong>Macquarie</strong>, and supporting communitygroups.
8<strong>City</strong> of <strong>Lake</strong> <strong>Macquarie</strong>- <strong>Annual</strong> <strong>Report</strong> <strong>2010</strong>/<strong>2011</strong>2009/<strong>2010</strong>highlightsof <strong>2010</strong>/<strong>2011</strong>Sport, Recreation, and CultureDuring the <strong>2010</strong>/<strong>2011</strong> beach season, ourlifeguards rescued 156 people and applied over1,330 first aid treatments. They prevented over2,400 potential dangers to swimmers and surfersduring the season, reducing the need for rescues.People with disabilities have improved recreationfacilities thanks to the construction of two pontoonjetties that allow disability access at Blacksmithsand Speers Point.<strong>Lake</strong> <strong>Macquarie</strong> <strong>City</strong> Art Gallery won the <strong>2011</strong>Aboriginal Cultural Development Award forWrapped in a Possum Skin Cloak by the <strong>Lake</strong>.The Gallery’s Aboriginal Reference Group (ARG),collaborated with our libraries to host a series ofworkshops to facilitate the design and creation ofa possum skin cloak by members of the Aboriginalcommunity.<strong>Lake</strong> <strong>Macquarie</strong>’s newest, biggest, and bestskate park at Chapman Oval, Swansea opened.Designed in collaboration with local users, the60m long skate park’s unique design allows bothinexperienced and experienced skate boarders touse the facility simultaneously.
Our <strong>City</strong> 11snapshotof our cityOur <strong>City</strong>’s First Inhabitants<strong>Lake</strong> <strong>Macquarie</strong> was first inhabited by the Awabakalpeople over 8,000 years ago. <strong>Lake</strong> <strong>Macquarie</strong>’soriginal inhabitants derived their name from the lake,with the word Awabakal meaning ‘people of the calmsurface.’ Three bodies manage Aboriginal lands in<strong>Lake</strong> <strong>Macquarie</strong>: Bahtabah Local Aboriginal Land<strong>Council</strong>, Awabakal Local Aboriginal Land <strong>Council</strong>,and the NSW Aboriginal Land <strong>Council</strong>.<strong>Lake</strong> <strong>Macquarie</strong> <strong>City</strong> has the second largestAboriginal community in NSW.The Place<strong>Lake</strong> <strong>Macquarie</strong> is located on the east coast ofAustralia. By road, it is 90 minutes north of Sydney,15 minutes from Newcastle, and 40 minutesfrom Hunter Wine Country and the NSW CentralCoast. The people of <strong>Lake</strong> <strong>Macquarie</strong> enjoy 787.4square kilometres of mountains, coastline beaches,and coastal plains. The area encircles one of thelargest coastal saltwater lakes in the southernhemisphere. The city has well established arts, crafts,entertainment, sporting activities, services, andinfrastructure.The People<strong>Lake</strong> <strong>Macquarie</strong> is one of the fastest growing citiesin the Hunter, and the fourth largest in New SouthWales, with a population over 200,000. Our cityhas a diverse mix of cultures, age groups andfamily structures, all which require varying servicesand facilities. The population of <strong>Lake</strong> <strong>Macquarie</strong> isexpected to grow by 60,000 – 70,000 people in thenext 25 years. The percentage of our populationaged 55+ will increase from 29% to 39% of our totalpopulation in the next 20 years.The Economy<strong>Lake</strong> <strong>Macquarie</strong>’s economic strength was derivedfrom its diverse landscape and natural resources, inparticular coal and timber, with other key industriesdeveloping out of agriculture and fishing. Today,the city has developed into a major hub for small tomedium size business with home business generatingin excess of $1.5 billion annually. Knowledge andtechnology-based industries are growing.The EnvironmentThe natural heritage of the city provides a high qualitylifestyle experienced by <strong>Lake</strong> <strong>Macquarie</strong>’s residentsand visitors. Natural ecosystem diversity includesover 38,000 hectares of remnant vegetation, woodedmountainsides, freshwater streams, wetlands,saltmarsh, sandy beaches, rocky shores and, ofcourse, the lake. These are home to a variety ofwildlife, including threatened species populationsand communities such as Squirrel Glider, Green andGolden Bell Frog, Powerful Owl, and the plantBlack-eyed Susan, which continue to be subject to avariety of threats.Our<strong>City</strong>
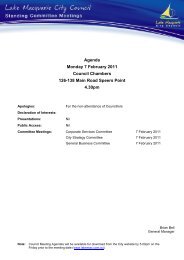
12<strong>City</strong> of <strong>Lake</strong> <strong>Macquarie</strong>- <strong>Annual</strong> <strong>Report</strong> <strong>2010</strong>/<strong>2011</strong><strong>Lake</strong> <strong>Macquarie</strong> Facts<strong>City</strong> Area: 787.4km 2Population: 200,849 (Estimated Resident Population ABS June 2009/<strong>2010</strong>).Largest city in the Hunter – accounts for 37% of Lower Hunter populationClimate:Rainfall:Employment:Tourism:Business/Industry:Mean daily maximum temperature 22.8°CMean daily minimum temperature 18.0°CAverage annual rainfall 1,065.8mm76,737 employed across the city71% of jobs are filled by <strong>Lake</strong> <strong>Macquarie</strong> residentsUnemployment rate of 5.2% is the lowest in the Lower Hunter Region969,000 visitors per year12,000 businessesNorthWardWest WardGlendaleCardiffCharlestownWarners BayTorontoBelmontEast WardPulbahIslandMorissetSwanseaWyee
Our <strong>City</strong> 13OURCOUNCILMEMBERSMayor Cr Greg Piper MPNorthWard<strong>Council</strong>lorPaul Scarfe<strong>Council</strong>lorBarry Johnston<strong>Council</strong>lorJodie Harrison<strong>Council</strong>lorHannah GissaneWestWard<strong>Council</strong>lorWendy Harrison<strong>Council</strong>lorArnold TammekandResigned May <strong>2011</strong><strong>Council</strong>lorDaniel Wallace<strong>Council</strong>lorAnthony BirtEastWard<strong>Council</strong>lorKay Fraser<strong>Council</strong>lorLaurie Coghlan<strong>Council</strong>lorGarry Edwards<strong>Council</strong>lorPhillipa Parsons
Our Purpose 15OUR MISSION, VISION,GOals, AND VALUESOur mission<strong>Lake</strong> <strong>Macquarie</strong> <strong>City</strong> <strong>Council</strong> provides a diverse rangeof services and facilities for residents.The mission statement represents and embodiesour overarching goal in providing these services…‘Quality Lifestyle’Our vision:establish a place where the environment will be protected and enhanced, and where people and native floraand fauna will co-exist in harmonyhave a prosperous economy with a supportive attitude to balanced economic growth managed in a way toenhance quality of life and satisfy the employment and environmental aims of the communityrecognise, encourage, and develop the city’s diverse cultural life and talents and protect and promote itsheritageencourage a community spirit, which promotes a fulfilling lifestyle, enhances health and social wellbeing,encourages family life and lifestyle choices, allows opportunities to participate in sport and recreation, promotesequal access to all services and facilities, as well as enables all citizens to contribute to the city’s economic andsocial developmentencourage and enable all people to participate fully in the economic and social life of the community, as well asenjoy equal life chances and equal opportunity for access to the resources of the communityOur Purpose
Our Performance 19DELIVERY PROGRAMPROGRESS<strong>Council</strong> is required to report on its progress against the <strong>City</strong> of <strong>Lake</strong> <strong>Macquarie</strong> DeliveryProgram 2009-2013. <strong>Council</strong>’s Delivery Program objectives link directly to the OperationalPlan actions and the corresponding performance measures. The following informationgives detail of our performance against each of the actions in the Operational Plan for<strong>2010</strong>-<strong>2011</strong>.1. Caring for our EnvironmentPriority 1.1 Environmental RiskPerformance Targets1.1.1 Analysis of environmental security, ecosystem enhancement andsustainable living footprints with respect to 2007/2008 baselinereported annually1.1.2 Analysis of return in terms of risk reduction on <strong>Council</strong> investment insustainability initiatives reported annually1.1.3 Conduct and document gap analysis between aspirational target andmaximum achievable target for minimising sustainability risksTarget Achievedor Not AchievedAchievedAchievedNot achievedCommentsDue to lack ofavailable data1.1.4 <strong>Report</strong> on outcomes from Sustainable Neighbourhoods Program Achieved1.1.ABest possible targets established for reduction in sustainability risksand increase in community wellbeingAchievedOur Performance
22<strong>City</strong> of <strong>Lake</strong> <strong>Macquarie</strong>- <strong>Annual</strong> <strong>Report</strong> <strong>2010</strong>/<strong>2011</strong>2. Caring for our CommunityPriority 2.1 Social and Cultural PlanningPerformance TargetsTarget Achievedor Not AchievedComments2.1.1 Key priorities from social and community plans implemented Achieved2.1.2 Development of a strategy to ensure that halls and facilities meetthe needs of current and future residents is commenced in linewith the review of the Developer Contributions Plans for individualcatchment areas2.1.3 Priority works identified in <strong>Council</strong>’s Disability Action Plan areundertaken2.1.4 <strong>Council</strong> owned child care centres are upgraded and maintained, andmeet Department of Community Services (DOCS) standards2.1.5 Delivery of the Community Development Support ExpenditureScheme and projects developed for the Community Buildersfunding schemeAchievedAchievedAchievedAchieved2.1.ACommunity satisfaction levels are maintained at a minimum of:- 3.0 for services and facilities for people with disabilities;- 3.2 for community safety, 2.9 for youth services and facilities;- 3.16 for services and facilities for older people;- 3.2 for child care services;- 3.1 for services for Aboriginal and Torres Strait Islander.Achieved
Our Performance 23Priority 2.2 Provide Family Day CarePerformance Targets2.2.1 High quality accreditation status maintained through National ChildCare Accreditation <strong>Council</strong>Target Achievedor Not AchievedAchievedComments2.2.2 DOCS licence maintained Achieved2.2.3 Carry out not less than ten prospective carer information sessionsfor the public2.2.4 Provide a minimum of ten training sessions for prospective andregistered care providersAchievedAchieved2.2.5 Carry out a minimum of six Child Protection information sessions Achieved2.2.6 Partnership and funding for Brighter Futures Early InterventionProgram (DOCS) maintained2.2.7 Provision of ‘best practice’ play session partnership withTAFE maintained2.2.8 Employer sponsored placements with Hunter New England AreaHealth continueAchievedAchievedAchieved2.2.A2.2.BCommunity satisfaction with family day care services is maintainedat a minimum of 3.23Survey specific users of service to determine satisfaction of;- Brighter Futures program- quality practices- information services provisionAchievedAchievedPriority 2.3 Respond to Community Concerns Relating to Rangerand Public Health IssuesPerformance TargetsTarget Achievedor Not AchievedComments2.3.1 Measure and report on a number of regulatory inspections completed Achieved2.3.2 Measure number, type, and responsiveness of customer requestsreceivedAchieved2.3.A<strong>Report</strong> annually on the number and type of service requests receivedfor ranger activities and develop trend monitoringAchieved
Our Performance 253. Sport, Recreation, and CulturePriority 3.1 Improve <strong>Council</strong> pool facilities that will allow us to offera range of recreational activities and programsPerformance Targets3.1.1 Timeframes for design and construction at priority centrehave been established3.1.2 Minimum number of pool visits is 300,000 per annum acrossall centres3.1.3 Community satisfaction with swimming pools is maintained ata minimum of 3.43.1.4 Customer participation levels across available activitiesincreased by 5% per annumTarget Achievedor Not AchievedNot achievedAchievedAchievedAchievedCommentsStaffing and resourceshortage delayed projectplan developmentPriority 3.2 Recreation and Community Land PlanningPerformance TargetsTarget Achievedor Not AchievedComments3.2.1 Parbury Park, Swansea floodlighting project completed Not achieved Electrical design contractorappointed. Due to unavailabilityof detailed design, constructionnot started3.2.2 Gregory Park, West Wallsend amenities building design andapprovals completedNot achievedDesign work has started. Theelectrical design and StateEnvironmental Planning Policy(infrastructure) assessmentremain incomplete3.2.3 Design and construction of Blacksmiths pontoon jetty completed Achieved3.2.4 Design and approvals of upgrade works at the Eleebana boatramp car park project completedAchieved3.2.5 Evans Park amenity building and car park completed Achieved3.2.ACommunity satisfaction levels are maintained at a minimum of:- 3.4 for ovals and sporting facilities;- 3.3 for public jetties and boat ramps;- 3.2 for playgrounds.Achieved
26<strong>City</strong> of <strong>Lake</strong> <strong>Macquarie</strong>- <strong>Annual</strong> <strong>Report</strong> <strong>2010</strong>/<strong>2011</strong>Priority 3.3 Public Domain ImprovementsPerformance TargetsTarget Achievedor Not AchievedComments3.3.1 Public Art Policy completed and strategy commenced Not achieved Policy submitted to <strong>Council</strong>for approval in first quarter of<strong>2011</strong>/2012, therefore the strategyhas not commenced3.3.2 Commence implementation of town entry signage Achieved3.3.3 Designs for city entry statements completed Not achieved Pursuing development of minortown entry signs which has delayedthe completion of the designs forthe city entry statements3.3.4 Complete detail design of Warners Bay Master Plan Not achieved Draft Plan of Managementand Master Plan exhibited andsubmissions summary providedto consultants. Documents notadopted, therefore detailed designnot possible3.3.5 Complete detail design of Blacksmiths and NorthSwansea Channel Master Plan3.3.6 Complete prioritised implementation plan for thepreparation of town centre streetscape master plans3.3.7 Commence two town centre streetscape master plans inline with prioritisation reportNot achievedAchievedAchieved<strong>Council</strong> adopted the Master Plan inMay and consultants are finalising.Detailed design not possible untilfinalisation3.3.ACommunity satisfaction with the overall appearance of thecity is maintained at a minimum of 3.2AchievedPriority 3.4 Delivery of major projects for the communityPerformance TargetsTarget Achievedor Not AchievedComments3.4.1 Chapman Oval Skate Park construction works completed Achieved3.4.2 Chapman Oval, Swansea amenities building reconstruction works commenced Achieved3.4.3 Speers Point All Abilities Playground works progressing Achieved3.4.4 Stages 4 and 5 of Fernleigh Track construction completed Achieved3.4.5 Construction of Cameron Park Multi-purpose Centre commenced AchievedPriority 3.5 Increase community engagement in Art Gallery programsand provide a holistic experience for visitors and the communityPerformance TargetsTarget Achievedor Not AchievedComments3.5.1 One artist-in-residence project by June <strong>2011</strong> Achieved3.5.2 Increase collection by three works including sculpture commission by June <strong>2011</strong> Achieved
Our Performance 27Performance TargetsTarget Achievedor Not AchievedComments3.5.3 Increase profit from craft sales by 5% by June <strong>2011</strong> Achieved3.5.4 Website live June <strong>2011</strong> Not achieved Rescheduled for 20123.5.5 Average 85% capacity attendance of education/publicprograms3.5.6 Increase number of visits to the Art Gallery by 5%by June <strong>2011</strong>AchievedNot achievedVisitation down due to nopermanent full time Education andAudience Development Officer todrive promotion3.5.7 Maintain community satisfaction with Art Gallery at 95% annually Achieved3.5.8 Indigenous cultural project on display by June <strong>2010</strong> AchievedPriority 3.6 Provide adaptive library services to meet community needsPerformance Targets3.6.1 Reach 85% attendance at each library program byJune <strong>2011</strong>Target Achievedor Not AchievedAchievedComments3.6.2 Circulation of a minimum of 1.5 million loans per annum Not achieved Loans down by 90,710 is consistentwith state downward trends.Although decreasing, loan statisticsmet the state average. Working withconsultants on the Draft LibraryService Delivery Model to revitaliselibrary services and increase loans3.6.3 Minimum number of library visits is 850,000 Not achieved Visits down by 59,765 is consistentwith state downward trends. Workingwith consultants to revitalise libraryservices and increase visits3.6.4 Minimum membership registration of 56,000 Achieved3.6.5 Library Service Review complete and recommendations to<strong>Council</strong> by June <strong>2011</strong>Achieved3.6.ACommunity satisfaction with libraries is maintained at aminimum of 4.1AchievedPriority 3.7 Provision of beach patrol servicesPerformance TargetsTarget Achievedor Not AchievedComments3.7.1 Obtain sponsorship for one program by June <strong>2011</strong> Not achieved Due to competing priorities withessential activities and resourceconstraints sponsorship was notpursued. A sponsorship packagefor the beaches is currently underdevelopment and sponsorship willbe pursued in <strong>2011</strong>/20123.7.2 Provide emergency training program to one corporateorganisation by June <strong>2011</strong>Achieved3.7.ACommunity satisfaction with beach patrol services ismaintained at a minimum of 3.9Achieved
28<strong>City</strong> of <strong>Lake</strong> <strong>Macquarie</strong>- <strong>Annual</strong> <strong>Report</strong> <strong>2010</strong>/<strong>2011</strong>4. Transport, Roads, and DrainagePriority 4.1 Improve the transportation network across the cityPerformance Targets4.1.1 Commence shared pathways and city bicycle plan andimplementation strategy4.1.2 Deleted as approved by <strong>Council</strong> in the December Review report dueto a duplication with progress indicator 3.4.4Target Achievedor Not AchievedAchievedNot applicableComments4.1.ACommunity satisfaction is maintained at a minimum of:- 2.6 for footpaths;- 3.3 for cycleways and walking paths;- 2.9 for public transport.AchievedPriority 4.2 Provide and maintain drainage infrastructurePerformance Targets4.2.1 Commence audit of existing infrastructure and prioritise capital andrehabilitation works program4.2.2 Development of Drainage Asset Management Plan and dataacquisition commencedTarget Achievedor Not AchievedAchievedAchievedComments4.2.ACurrent satisfaction level with drainage maintenance maintained atleast at 2.9Not achieved Not achieved -mean communitysatisfaction rating /was 2.7.However, this will beaddressed within therate variation review(Securing our Future).
30<strong>City</strong> of <strong>Lake</strong> <strong>Macquarie</strong>- <strong>Annual</strong> <strong>Report</strong> <strong>2010</strong>/<strong>2011</strong>5. Urban and Economic DevelopmentPriority 5.1 Develop sustainable and socially responsible economicgrowth within the cityPerformance TargetsTarget Achievedor Not AchievedComments5.1.1 Strategic review completed Not achieved Town Centre Program and tourism strategic reviewincomplete. Expect report to be submitted insecond quarter <strong>2011</strong>/20125.1.2 Business analysis survey completed Achieved5.1.3 Action plan in each town centre implemented Achieved5.1.4 Continued roll out of branding strategy Achieved5.1.ACommunity satisfaction with generating localemployment opportunities is maintained at aminimum of 3.1Not achievedSatisfaction level of 2.98 was down as <strong>Council</strong>’scontribution to creating local employment opportunitiesis now heavily weighted on the Town Centre Programcontrolled by the local Chamber of Commerce5.1.BMaintain number of people in <strong>Lake</strong> <strong>Macquarie</strong>engaged in work within the cityAchieved5.1.CMaintain number of vacancies and activebusinesses within the cityAchievedPriority 5.2 Maximise economic benefit from tourismPerformance Targets5.2.1 Monitor and measure website hits, bookings,visitor numbers, and phone enquiriesTarget Achievedor Not AchievedAchievedComments5.2.2 Develop new trails booklet Achieved5.2.3 Leverage $50,000 cooperative funding fromoperators5.2.4 Visitor numbers show an upward trend in:- revenue from bookings;- number of visit enquiries;- number of beds provided in the city.AchievedNot achievedThe tourism market has shown a sharp declinecompared to <strong>2010</strong>. Effects of the financial climatehas resulted in households reducing expenditureand increasing savings resulting in a downwardstrend in domestic tourism5.2.ACommunity satisfaction with tourism facilitiesis maintained at a minimum of 3.3Not achievedSatisfaction at 3.18 due to tourism marketing beingdirected outside of the city and the Lower Hunter
Our Performance 31Priority 5.3 Landuse PlanningPerformance TargetsTarget Achievedor Not AchievedComments5.3.1 Lifestyle 2030 (LS2030) reported to <strong>Council</strong> foradoptionNot achieved Refer to explanation under 5.3.25.3.2 Draft LMLEP <strong>2011</strong> reported to <strong>Council</strong> foradoptionNot achievedThe Department of Planning and Industrydid not approve the exhibition of draftLMLEP <strong>2011</strong> by 30 June <strong>2011</strong>.The draft LMLEP <strong>2011</strong>, draft DCP <strong>2011</strong>,and draft LS 2030 were to be exhibited atthe same time to allow the community tounderstand the full scope of changes tothe city’s planning instruments. The draftLMLEP <strong>2011</strong> approval delay has alsodelayed exhibition of the other documentsand the implementation of a number ofproposed changes to the DCP5.3.3 Draft DCP <strong>2011</strong> reported to <strong>Council</strong> for adoption Not achieved Refer to explanation under 5.3.2 above5.3.4 Internal reference group established to reviewscenic quality guidelines5.3.5 Incorporate <strong>Council</strong> policies on sea level rise andextreme weather events into the citywide DCP5.3.6 Seek funding from NSW Heritage Branch tocontinue to offer small grants for local heritageprojectsAchievedNot achievedAchievedRefer to explanation under 5.3.2 above5.3.ACommunity satisfaction with protecting heritagevalues and buildings in the city is maintained at aminimum of 3.3Achieved5.3.BCommunity has opportunity to provide input ondraft LEP <strong>2011</strong>, Draft DCP <strong>2011</strong> and draft Lifestyle2030Not achievedRefer to explanation under 5.3.2 abovePriority 5.4 Ensure responsible developments in the cityPerformance Targets5.4.1 Major development applications (DAs)– Median processing time – 80 working days5.4.2 Medium development applications– Median processing time – 55 working days5.4.3 General development applications– Median processing time – 30 working days5.4.4 Fast track development applications– Median processing time – 20 working days5.4.5 Tree assessment processing time– 30 working daysTarget Achievedor Not AchievedNot achievedAchievedAchievedAchievedAchievedCommentsMedian processing time was 100 days.There were four DAs in this category, withdelays to one DA due to a complex rangeof issues. Ongoing performance is beingmonitored and corrective action will beimplemented if warranted5.4.ACommunity satisfaction with managingdevelopment is maintained at a minimum of 3.0Achieved
32<strong>City</strong> of <strong>Lake</strong> <strong>Macquarie</strong>- <strong>Annual</strong> <strong>Report</strong> <strong>2010</strong>/<strong>2011</strong>Priority 5.5 Developer ContributionsPerformance TargetsTarget Achievedor Not AchievedComments5.5.1 Review of five Contribution Catchment Plans continuing Achieved5.5.2 Review of Northlakes and North Wallarah contributionplans commencedAchieved5.5.3 Review of policies and procedures complete Not achieved Not complete as they will beexamined in conjunction withthe review of the Morisset andCharlestown contribution plans6. Civi<strong>Lake</strong>Priority 6.1 Generate a commercial return for <strong>Council</strong> on itsinvestment in external worksPerformance Targets6.1.1 The total value of external works is not less than 6% of Civi<strong>Lake</strong>’sannual turnover6.1.2 The surplus on ‘for profit’ external works is not less than 10% of theexpenditureTarget Achievedor Not AchievedAchievedAchievedCommentsPriority 6.2 Bulk construction materials procurement, recycling,and sustainabilityPerformance Targets6.2.1 Agreement with current gravel supply partner is maintained for theappropriate period of time6.2.2 All actions relevant to the proposed Sustainable Resource Centreare dealt with in the shortest practical time frame6.2.3 All bulk material at and/or removed from Civi<strong>Lake</strong> work sites is managedin accordance with Office of Environment and Heritage requirementsTarget Achievedor Not AchievedAchievedAchievedAchievedComments
Our Performance 337. Property ManagementPriority 7.1 Provide a high standard of facilities for holiday parksPerformance TargetsTarget Achievedor Not AchievedComments7.1.1 Retain or improve the parks AAA tourism rating Achieved7.1.2 Complete Benchmarking <strong>Report</strong> and present the report to <strong>Council</strong>to establish fees and charges on an annual basis7.1.3 Establish and complete capital works program for <strong>2010</strong>/<strong>2011</strong> ontime and budget7.1.4 Complete the action items within the Sales and Marketing Programfor <strong>2010</strong>/<strong>2011</strong>7.1.5 Undertake manager’s performance appraisal to ensure parkstandards for presentation and service are met7.1.6 Complete the action items within the Environmental ManagementPlans for <strong>2010</strong>/<strong>2011</strong>AchievedAchievedAchievedAchievedAchieved7.1.AUndertake customer satisfaction survey to ensure that expectationsare being metAchievedPriority 7.2 Increase net yield on commercial andresidential propertiesPerformance TargetsTarget Achievedor Not AchievedComments7.2.1 Completion of residential lease reviews six monthly Achieved7.2.2 Completion of commercial rent reviews as permitted under leaseterms and conditionsAchieved7.2.3 Finalise new community leases for those expiring in <strong>2010</strong>/<strong>2011</strong> Achieved7.2.A All rentals appraised to market within one month of due date Achieved
34<strong>City</strong> of <strong>Lake</strong> <strong>Macquarie</strong>- <strong>Annual</strong> <strong>Report</strong> <strong>2010</strong>/<strong>2011</strong>8. Civic LeadershipPriority 8.1 Customer ServicePerformance Targets8.1.1 Progress against targets in Customer Service Strategy reportedquarterly8.1.2 Best customer service delivery model for organisation determined by30 June <strong>2011</strong>8.1.3 Progress on Service Review recommendations and continuousitems reported quarterlyTarget Achievedor Not AchievedAchievedAchievedAchievedComments8.1.4 80% of telephone calls answered in 30 seconds Achieved8.1.5 80% of all enquires received by Contact Centre dealt with by Centre Achieved8.1.6 Average wait time at counter 3.30 minutes Achieved8.1.7 80% of emails received by Contact Centre processedwithin 24 hoursAchieved8.1.AExternal Customer Service survey shows an increased percentageof very satisfied responses against 2009 survey- Attitude of customer service officers- Information provided- Timeliness of service- Overall handling of enquiryPriority 8.2 Community EngagementPerformance TargetsTarget Achievedor Not AchievedComments8.2.1 Six monthly reports on community engagement completed Achieved8.2.2 Audit of projects for communication plans completed by30 June <strong>2011</strong>Achieved8.2.3 Better Services Program underway Achieved8.2.4 Social networking guidelines for organisation developed Achieved
Our Performance 35Priority 8.3 Financial SustainabilityPerformance TargetsTarget Achievedor Not AchievedComments8.3.1 Financial modelling available to organisation Achieved8.3.2 Investment performance reported to <strong>Council</strong> monthly Achieved8.3.3 Quarterly budget reviews reported to <strong>Council</strong> within eight weeks ofend of quarterAchieved8.3.4 Ten year financial plan completed by 30 June <strong>2011</strong> Achieved8.3.A Financial Statements published as part of <strong>Annual</strong> <strong>Report</strong> by 30November <strong>2010</strong>AchievedPriority 8.4 Open, ethical and transparent leadershipand representationPerformance TargetsTarget Achievedor Not AchievedComments8.4.1 Number of closed meetings Achieved8.4.2 Implementation of Government Information (Public Access) ActfinalisedAchieved8.4.3 Corporate communication strategy implemented Achieved8.4.4 <strong>Council</strong>’s website meets accessibility guidelines Achieved8.4.A Community Survey shows increasing usage of <strong>Council</strong>’s website AchievedPriority 8.5 Business efficiencies and levels of servicePerformance TargetsTarget Achievedor Not AchievedComments8.5.1 Service Review progress reported to <strong>Council</strong> by 30 June <strong>2011</strong> Achieved8.5.2 Better Services program underway Achieved8.5.3 Status report on business opportunities completed by 30 June <strong>2011</strong> Achieved
36<strong>City</strong> of <strong>Lake</strong> <strong>Macquarie</strong>- <strong>Annual</strong> <strong>Report</strong> <strong>2010</strong>/<strong>2011</strong>Access and equityA role of local government is to promote social justice andenhance community wellbeing.Access and equity activities relate to:• a council’s social/community welfare, health, cultural and recreation activities; and• ensuring all community members have equitable access to infrastructure and services,planning and regulatory activities, and to information and decision-making processes.The following information in this section outlines <strong>Lake</strong> <strong>Macquarie</strong> <strong>City</strong> <strong>Council</strong>’s activities incarrying out access and equity activities.Social PlanningThe <strong>Lake</strong> <strong>Macquarie</strong> <strong>City</strong> <strong>Council</strong> Social Plan2009-2014 identifies the key trends and issuesaffecting all people that live and work in the city.It also identifies strategies to address these issues.The plan focuses on the areas of housing, health,education, employment and child care, transport,community safety, leisure, recreation, culture, urbandevelopment, and the built environment.During <strong>2010</strong>/<strong>2011</strong>, we completed the followingactions from the social plan:provided new community facilities includingThe Place: Charlestown Community Centre andCameron Park Community Centre;supported 19 clubs in <strong>Lake</strong> <strong>Macquarie</strong> to provideapproximately $300,000 in CDSE (CommunityDevelopment Support Expenditure) support grantsto community organisations;organised and facilitated five regional meetingsfor community service organisations to strengthencollaboration and partnerships between localservice providers;developed a draft Community Facilities Strategythat aims to ensure <strong>Council</strong>’s community facilitiesmeet the expectations and needs of current andfuture residents;reviewed <strong>Council</strong>’s Development Control Plan(DCP) to ensure social impacts were consideredfor new developments;worked with childcare centres and out-of-schoolhoursprograms to extend their licence forincreased placement numbers in order to provideadditional child care places;provided additional footpaths and on-road and offroadcycleways;implemented targeted strategies to address majorcrime concerns within the city;worked with youth services to develop activitiesand events for young people, including NationalYouth Week activities;upgraded <strong>Council</strong>’s facilities to ensure they meetaccessibility standards, including Teralba PetanqueCentre, Argenton Community Hall, and TeralbaCommunity Hall;reviewed <strong>Council</strong>’s Developer Contribution Plans toensure that new development provides adequatefacilities for the incoming population;provided input on various development andrezoning applications to ensure that theproposals conform to accessibility standards,crime prevention through environmental designprinciples, and adequately considered socialissues and needs.
Our Performance 37Making our <strong>City</strong>Accessible for All<strong>Lake</strong> <strong>Macquarie</strong> <strong>City</strong> <strong>Council</strong> places great importancein making the city a liveable and accessible place forall people. We take a holistic approach to improvingservices and facilities for people with a disability.These strategies include improvements to policiesand development controls, identifying capital worksfor on-ground improvements, facilitating developmentof accessible pedestrian infrastructure, andhighlighting increased opportunities for education andfor people with a disability to participate in communityand cultural activities and <strong>Council</strong> planningprocesses.In <strong>2010</strong>/<strong>2011</strong>, we completed the following projects:<strong>Council</strong> partnered with Disability Network HunterInc and Newcastle <strong>City</strong> <strong>Council</strong> in organisingthe International Day for People with a Disability(IDWP) which resulted in more than 500 peopleenjoying an exhibition of work by artists with adisability.<strong>Council</strong> endorsed a Public Toilet Strategy thatprovides a program of work for its public toiletfacilities available 24 hours per day. All new andmodified facilities will provide access for peoplewith a disability and will result in even more publictoilets being fitted with the universal key system,Master Locksmiths Access Key (MLAK).<strong>Council</strong> extended the All Abilities Playground inSpeers Point Park to include a bike/wheelchairtraining circuit, additional equipment to facilitatethe development of sensory and motor skills, anda Quiet Zone for children with special needs.<strong>Council</strong> constructed a new amenities blockadjacent to the All Abilities Playground to includewheelchair accessible toilets and an adult changefacility suitable for use by disability support groups.Under the Disability Action Plan <strong>2010</strong>/2013,installed facilities include lifts to first floor functionareas, ramped entries, wheelchair accessibletoilets for community and recreation areas,plus parking spaces and wheelchair accessiblepathways.<strong>Council</strong> provided comment on non-discriminatoryaccess and use provision on 105 developmentapplications for a variety of developments.
38<strong>City</strong> of <strong>Lake</strong> <strong>Macquarie</strong>- <strong>Annual</strong> <strong>Report</strong> <strong>2010</strong>/<strong>2011</strong>Planning for Older People<strong>Council</strong> established the Ageing and DisabilityAdvisory Panel, which represents the interests ofolder people, carers, and people with a disability.The panel ensures equity of access to servicesand facilities for all <strong>Lake</strong> <strong>Macquarie</strong> residents.People with a disability and older people arenow better informed with an updated ScooterSurvival Guide, which provides information onthe purchase, use, and maintenance of mobilityscooters.In preparation for the development of a SeniorsHousing Strategy, a series of group discussionswere held to identify what factors, benefits,and facilities contributed to housing choices.The discussions also identified the servicesor infrastructure needed that are already notavailable.We reviewed non-discriminatory access and useprovision of Development Control Plan No 1 andprovided comment relevant to ageing and disabilitytarget groups on the Library Service DeliveryModel.<strong>Council</strong> contributed to the development of theHunter Regional Ageing Plan and also the LocalGovernment and Shires Association Cost ofAgeing.During the past year, <strong>Council</strong> supported 17organisations by providing assistance withinformation or other resources on ageing anddisability matters.Now in its third year, the <strong>Lake</strong> <strong>Macquarie</strong>Seniors Program continues to grow with 74events held, which is double to last year. Topicsincluded aqua aerobics, tai chi, food preparation,computer courses, housing options, family law forgrandparents, and personal and household safety.UnitingCare Ageing Hunter continued as jointsponsor for the second year.
Our Performance 39Children and Families<strong>Council</strong> continued to implement the Children andFamily Services Strategy. The strategy aims to identifyhow <strong>Council</strong> can contribute to enhancing the qualityof life for children with the major focus being on acommunity that encourages and supports children toreach their potential, now and in the future.The introduction of the National Quality Reforms andpreparing for the implementation of the Early YearsLearning Framework and National Quality Standardshas been the key priority for the children’s servicessector in <strong>Lake</strong> <strong>Macquarie</strong>. The changes to theChildren’s Services Regulations resulted in changesto the ratio of carers in a service from 1:5 to 1:4 forchildren aged from birth to two years. The changeshave been implemented through planning anddeveloping services to be sustainable now and into thefuture, all the while being cost conscious to families.Community Activities <strong>Lake</strong> <strong>Macquarie</strong> (CALM),KidSafe Hunter, and <strong>Council</strong> hosted a successfulFamily Fun Day to celebrate Children’s Week atSpeers Point Park in October <strong>2010</strong>.<strong>Council</strong> celebrated International Women’s Dayby holding a breakfast with guest speakers atClub <strong>Macquarie</strong> and the very popular WOWInternational Film Night at <strong>Lake</strong> <strong>Macquarie</strong>Performing Arts Centre.<strong>Council</strong> supported the community’s work aroundthe issue of domestic and family violence, andfinalised the ‘Not a Hair on My Head’ Programwhich commenced in 2009.Completing the maintenance audit on <strong>Council</strong>owned child care centres resulted in kitchen andbathroom upgrades to older buildings. WoodrisingChild Care Centre underwent a major upgrade,which required a temporary centre for threemonths.<strong>Council</strong> participated in both a Reference Groupand Design Group for the development of anAboriginal Child and Family Centre at Toronto Westin 2012/2013.To keep abreast of changes to the licensing systemfor providers of children services, we participated inthe Community Services Education Campaign, whichincluded visits by Community Services staff andtraining for educators.
40<strong>City</strong> of <strong>Lake</strong> <strong>Macquarie</strong>- <strong>Annual</strong> <strong>Report</strong> <strong>2010</strong>/<strong>2011</strong><strong>Lake</strong> <strong>Macquarie</strong> Family Day Care<strong>Lake</strong> <strong>Macquarie</strong> Family Day Care continued to provide high quality childcare with 93 educatorsproviding family day care services to more than 830 children from 641 families. The graphshows the age range of children in care during the <strong>2010</strong>/<strong>2011</strong> year.Number of children in care per age group <strong>2010</strong>/<strong>2011</strong><strong>Lake</strong> <strong>Macquarie</strong> Family Day Care participatedin several forums regarding the National QualityFramework and wrote a submission providingfeedback to the Department of Education Employmentand Workplace Relations about the proposed draftNational Quality Standards.With a strong focus on safety and wellbeing ofchildren, there was an emphasis on child protectiontraining and procedures. This included:policy and procedure review with a focus onchildren’s safety and supervision;implementation of improved risk assessmentprocesses for educators planning to take childrenon excursions;training for educators and staff by the KidSafePlayground Advisory Unit – creating challenging andsafe outdoor environments;Keep Them Safe Facilitators upgrade (two staff) andconducted 14 child protection information sessions;Interagency partnerships continued to be highly valuedand beneficial for children and families. The partnersincluded:Samaritans (lead agency), Department ofCommunity Services, Eastlake Family Support,Catholic Care, Mercy Community Services, andNorthern Settlement Services participating with<strong>Council</strong> in the Brighter Futures Early InterventionProgram.The strong interagency partnership aims to reduceinstances of child abuse and neglect, and improveoutcomes for children by supporting and developingparenting skills at an early age. In its third year ofoperation, 63 children were provided with familyday careHunter Institute of TAFE- Children’s ServicesGlendale increased their ‘best practice’ play sessionfor educators and children to five days per weekHunter New England Area Health fully utilised theiremployer sponsored placementsintroduction to Early Years Learning Framework;conducted 11 information sessions attended by78 members of the public for people interested inestablishing a family day care service in their home;andChildren’s Week <strong>2010</strong> –‘A Caring World Shares’Family Fun Day held at Speers Point Park.
Our Performance 41Aboriginal ServicesIn November <strong>2010</strong>, <strong>Council</strong> resolved to make landavailable for an Aboriginal Child and Family Centreto be built in the Toronto area. The centre is aCommonwealth Government initiative that aims toimprove the overall health and wellbeing of childrenand support for their families.<strong>Council</strong> applied for and received an ‘Alive andWell’ local government grant through the Cancer<strong>Council</strong>, with initiatives to be implemented in<strong>2011</strong>/2012. The grant will enable healthy eatingand active living programs.For Reconciliation Week <strong>2011</strong>, <strong>Council</strong> helda Reconciliation Children’s Concert at <strong>Lake</strong><strong>Macquarie</strong> Performing Arts Centre with more than200 people attending.<strong>Council</strong> celebrated NAIDOC Week by holding aflag raising ceremony followed by a communitymorning tea. <strong>Council</strong> also assisted with theplanning of numerous NAIDOC Week eventsaround the city.<strong>Council</strong> conducted a consultation forum in June<strong>2011</strong> to look at the best way for <strong>Council</strong> tocommunicate with the Aboriginal community inan ongoing way. A further forum is planned forSeptember <strong>2011</strong>.Planning for Young People<strong>Council</strong> continued to implement the actions withinits Youth Community Plan 2007/<strong>2011</strong>. This plan isnow into its final year and research has begun for theYouth Strategy 2012/2016.During the reporting period, <strong>Council</strong>:worked with the GPT Group and openedThe Place: Charlestown Youth and CommunityCentre. The Place provides a space in a supportedand professional coordinated environment foryouth and community services;constructed a new skate park at ChapmanOval, Swansea with a unique design that issuitable for both inexperienced and experiencedskate boarders to use simultaneously. Priorto construction, <strong>Council</strong> worked with a localmanagement committee to ensure communityacceptance;worked with the Community Drug Action Teamto implement educational programs, at shoppingcentres in <strong>Lake</strong> <strong>Macquarie</strong>;participated with the police, CharlestownShopping Centre, and the Charlestown BusinessChamber to develop actions to reduce anti-socialbehaviour;assisted with local youth services and networks indeveloping events in the city in support of NationalYouth Week <strong>2011</strong>;won the “Most Innovative Youth Week Program<strong>2010</strong>” award at the Local Government and ShiresAssociation Awards; andworked with the <strong>Lake</strong> <strong>Macquarie</strong> suicideprevention and support networks to build anddistribute prevention and post incident informationand support packs.
42<strong>City</strong> of <strong>Lake</strong> <strong>Macquarie</strong>- <strong>Annual</strong> <strong>Report</strong> <strong>2010</strong>/<strong>2011</strong>Youth Advisory <strong>Council</strong>The <strong>Lake</strong> <strong>Macquarie</strong> Youth Advisory <strong>Council</strong> hasmoved on many youth issues in <strong>Lake</strong> <strong>Macquarie</strong>through the following actions:Providing input into the management model forthe Charlestown Youth and Community Centreand the mural creation and design for Keith EvansOval, Holmesville.Working with Newcastle Youth <strong>Council</strong> in planningfor the State Youth <strong>Council</strong> Conference.Hosting events including a youth wish tree at theAustralia Day <strong>2011</strong> celebrations.Assisting in the selection panel for events duringNational Youth Week <strong>2011</strong>.Participating in <strong>Council</strong>’s Great Waste Debate.Successfully applying for funding to purchase avideo camera, laptop computer and software forresearch projects involving young people in <strong>Lake</strong><strong>Macquarie</strong>.Collecting the Youth Week Award on behalfof young people and youth agencies in <strong>Lake</strong><strong>Macquarie</strong>.Crime PreventionWith support from the National Motor Vehicle TheftReduction <strong>Council</strong> and the Attorney General’sDepartment, <strong>Council</strong> continued to implement actionsfrom <strong>Council</strong>’s Crime Prevention Plan for the followingprograms:Operation Bounce Back – this program involvedraising public knowledge about motor vehicle theftin <strong>Lake</strong> <strong>Macquarie</strong> of vehicles pre-2000.Graffiti Hotspot Program – with an AttorneyGeneral’s department grant, <strong>Council</strong> establisheda positive partnership with the Department ofJuvenile Justice (DJJ) in cleaning up private andpublic places in Edgeworth and Cardiff.<strong>Council</strong> conducted a safety audit for theCharlestown CBD with recommendations assistingstrategies to make public areas safer.<strong>Council</strong> took the lead in the annual Graffiti ActionDay by coordinating the supply of cleaningequipment and chemicals. With the supportof local business chambers and communitymembers who enlisted volunteers, many graffititags were removed from several localities.
44<strong>City</strong> of <strong>Lake</strong> <strong>Macquarie</strong>- <strong>Annual</strong> <strong>Report</strong> <strong>2010</strong>/<strong>2011</strong>Responsible PetOwnership Education<strong>City</strong> rangers conduct annual programs to educatepeople about responsible pet ownership.Spot Program is aimed at infants, teaching themabout responsible pet ownership and dog biteprevention. Since its introduction, rangers have visitedone school per month.PET PEP is similar to Spot, but aimed at schoolchildren from year two and up.Puppy Preschool is held at Hillsborough Dog Clubevery eight weeks. This class covers topics from pettraining to responsible pet ownership.Microchipping days are held throughout the yearto allow owners of companion animals to be able toget their animals microchipped at a reduced rate.Howloween with the Hounds is aimed atpromoting responsible pet ownership in a funatmosphere. Owners are educated about theimportance of microchipping and registering theirdogs.Online information on <strong>Council</strong>’s website alsoeducates people about their responsibilities as a petowner.Promoting the Desexing ofDogs and CatsTo promote the importance of desexing pets andassisting owners in paying for the procedure,<strong>Council</strong> participates in National Desexing Month. Byworking with Hunter Animal Watch and subsidisingthe cost of the procedure, city rangers canpromote the importance of desexing pets throughcommunications campaigns.Alternatives to Euthanasia forUnclaimed Animals<strong>Council</strong> rangers seek alternatives to euthanasingunclaimed animals. Education programs, reducedmicrochipping prices, and special free microchippingdays encourage pet owners to microchip their pet.Through these programs, <strong>Council</strong> emphasises theimportance of microchipping as it can increase thechance of owners being reunited with their pet. If aranger collects an animal that cannot be identified,the ranger will take it to the RSPCA for assessment.Only animals that are not fit for sale are euthanased.Off leash areas providedin the council areaResidents, visitors, and their pets can enjoythe outdoors in leash-free areas throughout thecity. Locations where pets and pet owners canexercise leash free include:Barnsley - Taylor ParkBelmont North - Lenaghan ParkButtaba - Foreshore ReserveCardiff - off Orchard StreetCaves Beach - Hams BeachBlackalls Park - part of the easterly park landBlacksmiths - Dobinson Reserve and 9 Mile BeachCoal Point - Biriban ReserveCroudace Bay ParkDora Creek - off Douglas StreetBolton Point - off Bay and Quigley RoadsBonnells Bay - Pendlebury ParkBooragul Foreshore ReserveGateshead - intersection of Willow Roadand Goundry StreetMarks Point - reserve off Haddon CrescentMorisset - Bernie Goodwin Memorial ParkRathmines ParkRedhead BeachRedhead - Molly O’Connor ParkSpeers Point ParkSwansea - Thomas Humphreys ReserveToronto - Lions Park and Hampton Street ReserveValentine - off Ruston AvenueWest Wallsend - Gregory Parkand Les Wakeman FieldWindale - Bahloo ReserveWyee OvalOnly a portion of each of the above areas areleash-free areas. For further details and maps,obtain a brochure from <strong>Council</strong>’s CustomerService Centre, city libraries, or onwww.lakemac.com.au.
Our Performance 45state of the environment<strong>Council</strong> is committed to caring for ourlocal environment and making a faircontribution to a sustainable planet.Community EngagementProgramsSustainable Neighbourhoods ProgramThrough the Sustainable Neighbourhoods Program,initiated in July 2008, <strong>Council</strong> collaborates withresidents to plan and implement communityaction to reduce our city’s ecological footprint,neighbourhood by neighbourhood. The programincludes a community planning process involvingthe development of a neighbourhood vision, thearticulation of local values and challenges, andthe implementation of actions to achieve theneighbourhood vision.In <strong>2010</strong>/<strong>2011</strong> <strong>Council</strong> worked with 17 localsustainable neighbourhood groups. Five of thesegroups, and the program support resources, havebeen supported through the assistance of two NewSouth Wales (NSW) Government Environmental Trustgrants totalling $297,132.The outcomes arising from the SustainableNeighbourhoods Program extend beyond itsenvironmental sustainability focus. The extent andnature of the community engagement processitself has significantly contributed to <strong>Council</strong>’sunderstanding of the values and challenges forresidents and the issues that are important to them.In further recognition of the program, <strong>Council</strong>accepted the Communication, Education andEmpowerment award at the 2009/<strong>2010</strong> LocalGovernment and Shires Association EnvironmentAwards.Making Connections in Cocked Hat CreekCocked Hat Creek is a tributary of Cockle Creek thatflows through the middle of the Northlakes Estatein Cameron Park. The Northlakes Estate is typicalof many large, modern, residential housing estateswith 1,500 homes already built and a further 2,800planned for the next 10 years. Urban encroachment,stormwater and pollution impacts, weeds, anddegradation of its banks and riparian zone affectCocked Hat creek, like many other urban creeksacross the city. Downstream, towards Edgeworth,the creek has been highly modified, straightened,and turned into a concrete channel. Residents aredisconnected from the values of the creek, with manyconsidering it nothing more than a drain.Since 2009, <strong>Council</strong> with the assistance of a$240,132 grant from the NSW EnvironmentalTrust, has formed a partnership with residentsand community associations to strengthen thecommunity’s connection to the creek. Three offour prioritised erosion control works have beenconstructed helping to stabilise over 500 metres (m) ofcreek channel and improve in-stream aquatic habitat.Over 6.4 hectares (ha) of land has been managed forlantana, privet, and blackberry infestations and over12,000 natives planted by schools and communitygroups. Baseline water quality monitoring has alsobeen established and volunteer groups contributedover 1,000 work days.Towards EnvironmentalSustainability
46<strong>City</strong> of <strong>Lake</strong> <strong>Macquarie</strong>- <strong>Annual</strong> <strong>Report</strong> <strong>2010</strong>/<strong>2011</strong>NSW Waterwatch in <strong>Lake</strong> <strong>Macquarie</strong>The NSW Waterwatch and <strong>Lake</strong> <strong>Macquarie</strong>Adopt-a-SQID (Stormwater Quality ImprovementDevice) programs provide community education andmonitoring for waterways, SQIDs, foreshore, andestuary environments. The program is funded by<strong>Council</strong> and is supported by Landcare, Office of theEnvironment and Heritage (OEH), and Eraring Energy.The program provides residents with the opportunityto increase their knowledge of natural ecosystemsthrough assessing, monitoring, and reporting onthe water quality in their local environment, andto observe and assess native flora and fauna.Participating groups use their findings as a basisfor educating the wider community on the need toprotect local waterways, including the lake, and tohelp <strong>Council</strong> manage stormwater more effectively.Project pages are available onwww.lakemac.com.au and further detailedinformation is provided in the Water chapter of thisreport.Project Aware on the CoastWith over 30 kilometres (km) of coastline, includingthree biologically diverse rocky platforms, thecoastline of <strong>Lake</strong> <strong>Macquarie</strong> <strong>City</strong> provides animportant environmental and recreational resourceto the region. Some inter-tidal stretches of thiscoastline are highlighted in the BroadscaleBiodiversity Assessment of the Hawkesbury ShelfMarine Bioregion (MPA 2005). The Central CoastRocky Shore Biodiversity Assessment (Gladstone etal 2007:19) identifies Swansea Heads rock platformas having the highest irreplacability value of any rockplatform on the central coast.The program provided three avenues to discover thevalue of marine and coastal areas. These included anadult marine and coastal education course, a seriesof marine discovery talks, and hands-on coastalactivities over the year:Twenty two students completed the adult marineeducation course during March <strong>2011</strong> with 20marine education projects developed.The summer coastal activities included a seriesof 18 hands-on activities for the community.Approximately 350 people participated in rambles,walks, and workshops along the city’s coastline inJanuary <strong>2011</strong>.The marine discovery series, attended by 240members of the community, involved the deliveryof nine public lectures covering a range of localand national marine topics such as: whales;artificial reefs in <strong>Lake</strong> <strong>Macquarie</strong>; fish surveys in<strong>Lake</strong> <strong>Macquarie</strong>; Great White Shark populationdynamics; marine algae; Wrasse behaviour; marineand coastal birds of <strong>Lake</strong> <strong>Macquarie</strong>; deep seacanyons of the Hunter coast region and oceanicplankton.Community EcosystemMonitoring ProgramThe Community Ecosystem Monitoring Program(CEMP) aims to engage the community in identifyingchanges in ecosystem health and buildingunderstanding of threats, impacts, and ecosystemprocesses. It combines data collected by communityvolunteers at permanent monitoring sites acrossthe local government area (LGA) with data fromother sources to monitor and quantify changes inecosystem health over time.Over the past 18 months, approximately 30community volunteers have been gaining experiencein establishing and monitoring terrestrial sites.An increasing number of the volunteers now havethe capacity to independently monitor theselong-term sites.Three monitoring seasons have been conducted.Forty one randomly distributed, communitymonitoring sites have been established withbenchmark values being generated from 121 sites.Monitoring events measure 13 attributes of vegetationstructure and composition. Data from the communitysites is compared with benchmark data for sites withsimilar vegetation class to provide a health score forthe site. Sites are rated on a scale A (pristine) to E(degraded) and scores for 41 community sites and121 benchmark sites are shown in Table 1.Community participation in monitoring of waterwaysis primarily through the NSW Waterwatch program.<strong>Annual</strong> scorecards are being developed basedon water quality, macroinvertebrates, riparianassessment, and hydrology for sites.
Our Performance 47Table 1: Health Scores for Community Ecosystem Monitoring Programand Benchmark Sitescommunity sitesbenchmark sitesEcosystem TypeNumber ofSamplesAverageGradeNumber ofSamplesRainforest 4 B 15 BAverageGradeForest 14 B- 31 B-Woodland 11 B- 29 B-Heath 4 C+ 19 BWetland 8 C+ 27 B-TOTAL 41 121Flagship SpeciesSeveral flagship species have been selected to raisecommunity awareness about significant threatsto different ecosystems and involve people inbiodiversity monitoring. The species were identifiedbased on community recognition, association withthreats, ecological functionality, and the potential forlow cost monitoring, with one species being selectedto represent each specific ecosystem type.Interested volunteers are encouraged to participatethrough specialist groups, such as the Hunter BirdObservers Club that is partnering to deliver theflagship species program for the Powerful Owl andthe Superb Lyrebird. This approach will providecontinued and long-term support for the programas well as input from interested volunteers withmonitoring skills.Further detail on the flagship species communityawareness program is available onwww.lakemac.com.au.Catchment Connections CarnivalWorld Environment Day was celebrated at theCatchment Connections Carnival. Over 160 students,teachers and parents representing 11 primary andsecondary schools attended. Local communityenvironmental groups supported the event by runningactivities and workshops alongside <strong>Council</strong>.Sustainable Business<strong>Council</strong> has continued to work closely with OEHand local businesses to deliver sustainable businessprograms that embed sustainability into businessoperations and integrate efficient energy, water, andwaste management practices.<strong>Council</strong> has promoted a range of services andexisting programs available to businesses:Sustainability Advantage and Energy Saver<strong>Council</strong> is contracted to assist two companiesto facilitate the NSW Government SustainabilityAdvantage Program to identify cost savings of$227,000 and carbon pollution savings of2,041 tonnes (t). <strong>Council</strong> has helped five largebusinesses complete nine modules, and commenceda further nine through the program. The SustainabilityAdvantage Program engages large organisations toreduce waste, energy, and water use, and implementsustainable supply chain actions and engage staffand external stakeholders on how their businesscan achieve economic, environmental and socialsustainability. Current members include AvondaleCollege (Bronze Member), Centennial Coal, EraringEnergy (Bronze Member), <strong>Lake</strong> <strong>Macquarie</strong> <strong>City</strong><strong>Council</strong> (Silver Member), Norris Industries and TorontoPrivate Hospital. <strong>Council</strong> is actively inviting otherlarge, proactive businesses in <strong>Lake</strong> <strong>Macquarie</strong> <strong>City</strong> tojoin the program.<strong>Council</strong> has approached several larger businessesto sign onto OEH’s Energy Saver program. A standalone, fast track part of Sustainability Advantage,Energy Saver, offers large energy users a heavilysubsidised audit and consultant time to investigateand cost energy saving actions that in turn reduce thebusinesses outgoings.
48<strong>City</strong> of <strong>Lake</strong> <strong>Macquarie</strong>- <strong>Annual</strong> <strong>Report</strong> <strong>2010</strong>/<strong>2011</strong>Win-Win Sustainable Business Program<strong>Council</strong> continues to promote the Energy Efficiencyfor Small Business program available through OEH.Approximately 25 businesses have applied forthe rebates available and it is estimated they willsave a combined $23,000. <strong>Council</strong> is encouragingbusinesses that have already received an assessmentto apply for a rebate.Commercial Recycling<strong>Council</strong> continues to make available avalue-for-money commercial recycling service forsmall to medium businesses. Businesses can accessa 240 litres (L) recycling bin and fortnightly collectionfor a yearly cost of $65. In <strong>2010</strong>/<strong>2011</strong>, participation inthe service increased by 16%. <strong>Council</strong> aims to boostthe number of small to medium businesses recyclingby 20 per cent in 2012.Choose GreenPower Program<strong>Council</strong> ran a pilot of a successful GreenPowerprogram implemented in Victoria. Forty onebusinesses had their electricity accounts assessedto establish eligibility to purchase GreenPower, andreduce their carbon pollution. The pilot identified thatdue to lack of competitiveness in the NSW electricitymarket, incentives for businesses using less than40 megawatt hours (MWh) of electricity per year toconvert to GreenPower were small. However, thepilot did identify significant savings for businessesthat spend over $10,000 per year on electricity.Three business sites converted to GreenPower andanticipate significant carbon pollution savings.OzHarvest<strong>Council</strong> has recently partnered with OzHarvest toexpand its food rescue collection service to small tomedium food businesses in the city. OzHarvest willcollect surplus food from providers, free of charge,and distribute the food to not-for-profit outlets thatprovide a service to the community. The partnershipwill expand on the 815 kilograms (kg) per month thatOzHarvest currently collects from city businesses,that would otherwise be sent to landfill.Sustainable Schools ProgramIn <strong>2010</strong>, <strong>Council</strong> surveyed schools in <strong>Lake</strong> <strong>Macquarie</strong><strong>City</strong> to gain a better understanding of what schoolsneed to support their environmental sustainabilityprograms. There was a 35% response rate, with 31schools completing the survey.More than half of the schools surveyed indicatedthey have taken some action to reduce their energyuse in the past 12 months and 90% of schools haveinitiated water saving activities. All use recycled paperand the majority indicated a desire for more recyclingfacilities to enable greater levels of recycling.The top five areas where schools sought <strong>Council</strong>assistance were: applying for funding and grants;energy and water saving hardware and measuringdevices, as well as usage audits; vegetableand/or herb gardens; shade worm farms and frogponds; and tools and soil testing devices.School Environment AwardsThis annual program provides <strong>Council</strong> with anopportunity to reward schools for their environmentalinitiatives. Prizes have included monetary support,books, plants, and in-kind labour. Twenty six primaryschools, four high schools, and two combinedschools contested the <strong>2010</strong> competition (Table 2).Sponsors of the <strong>2010</strong>/<strong>2011</strong> awards include DeltaElectricity, Hunter Resource Recovery, LifeCycle,Centennial Mandalong, Energy Australia, and Treesin Newcastle.Table 2: School Environment Award WinnersCategoryOverall Winner – Primary SchoolOverall Winner – High SchoolWasteEnergyWaterSchool GroundsInnovationEncouragementWinnerCharlestown East Public SchoolSt Paul’s High School, Booragul<strong>Lake</strong> <strong>Macquarie</strong> High School<strong>Macquarie</strong> CollegeRathmines Public SchoolSt Mary’s Primary School, Warners BayEleebana Public SchoolCooranbong Public School and Gateshead West Public School
Our Performance 49Sustainable Schools Workshops<strong>Council</strong> delivered 15 sustainability workshops toschools with 401 students participating. Subjectsincluded: How reliant on energy are you; Water –essential for life; Waste – trash or treasure; and OurNatural Environment.Other Environmental Education Activities<strong>Council</strong> also prepared the <strong>2011</strong> Green Access Posterin partnership with other lower Hunter councils andthe Wetlands Environmental Education Centre andprovided environmental education resources, asrequired.Ecoadvocate NewsletterLaunched in February 2006, <strong>Council</strong> continues todistribute the quarterly Ecoadvocate Newsletter,which is dedicated entirely to the <strong>Lake</strong> <strong>Macquarie</strong><strong>City</strong> environment. Regular items include Dr Worm’sDiary, weed identification, sustainable living, wastemanagement, energy and water rebates, and<strong>Council</strong>’s programs and events. The newsletter has2,080 subscribers and it is also available through<strong>Council</strong> libraries and on www.lakemac.com.au.<strong>2010</strong> Living Smart Festival<strong>Council</strong>’s inaugural sustainability event, the LivingSmart Festival, was held in <strong>2010</strong> with approximately8,000 people attending. The low waste, consumption,and pollution event was an educational andinspirational celebration of sustainable living. Itfocused on the community and current sustainabilityissues. The festival aimed to increase awareness ofsustainability through music, dance, performance,presentation, stalls, workshops, art, fashion, andfood. Participants were surveyed and the outcomesrecorded: 100% wanted the event again in <strong>2011</strong>; 84%have made changes to live more sustainably; and71% have made their homes more sustainable.Table 7 in the Waste chapter reports furtheroutcomes.<strong>Council</strong>’s <strong>Annual</strong> Plant Giveaway<strong>Council</strong> held its annual Native Plant Giveawayin September <strong>2010</strong> at the Living Smart Festival,with smaller giveaways at Belmont and Morissetthe following day. <strong>Lake</strong> <strong>Macquarie</strong> residents andratepayers were provided with two free plants from achoice of over 50 native species, ranging from treesto ferns and grasses. About 4,000 plants were givenaway over the two days. Residents were also informedabout the many benefits of native plants and givenadvice to help the selection of appropriate plants fortheir situation.10:10 ChallengeSince the successful launch in April <strong>2010</strong>, the 10:10Challenge has encouraged residents, communitygroups, business, and industry to make pledges andchange their behaviour. From April to November <strong>2010</strong>more than 13,700 pledges were made around thethemes energy, water, transport, consumption, andwaste.The success of the 10:10 Challenge has been inits ability to engage people to take action towardsclimate change regardless of their philosophicalbeliefs, lifestyle, or life circumstances. Through theirpledges, an estimated 9,000 tonnes of greenhousegas emissions was saved with an estimated overallsaving of $570,000.Energy Efficiency for Residents<strong>Council</strong> continued to promote ways residents couldsave energy in their home through the Ecoadvocatenewsletter, website, workshops, the Living SmartFestival, and the 10:10 Challenge. <strong>Council</strong> also madethe following programs available:Energy Efficiency Rebates<strong>Council</strong> awarded 318 energy efficiency rebates toresidents for the following actions:installing solar hot water or heat pump(291 rebates/bill savings $75,660)insulating solar hot water system and pipes(10 rebates/bill savings $2,800)installing insulation (five rebates/bill savings $850)installing draught-proofing(two rebates/bill savings $250)installing draught-proofing and pipe insulation(two rebates/bill savings $250)replacing halogen down lights with energy efficientglobes (five rebates/bill savings $294)insulating hot water pipes(one rebate/bill savings $20)replacing old fridge/freezer seal(two rebates/bill savings $26)
50<strong>City</strong> of <strong>Lake</strong> <strong>Macquarie</strong>- <strong>Annual</strong> <strong>Report</strong> <strong>2010</strong>/<strong>2011</strong><strong>Council</strong> encouraged residents to reduce energyusage in their homes and to install solar hot watersystems before the state government rebate ran out.Further information on the uptake of OEH rebates in<strong>Lake</strong> <strong>Macquarie</strong> <strong>City</strong> can be found in Table 32 of theEnergy chapter.Home Power Savings ProgramThe Home Power Savings Program allowspensioners, health care, and veteran affair cardholders to access free energy assessments with areport of recommendations and approximate savingthat the resident can implement. The visit alsoincludes an energy saving kit that includes energyefficient light bulbs, a water and energy efficientshowerhead and shower timer, draught proofing, tapaerators, and an energy saving power board.<strong>Council</strong> continues to actively promote thisgovernment funded program to eligible groupsthrough its newsletters, website, and face to facemeetings. Since beginning promotions in July <strong>2010</strong>,2,005 eligible residents have taken advantage ofthe program. An estimated 1,604 tonnes of carbonemissions (t CO 2-e) have been saved from existingparticipants.Power Meter Loans and Energy Saving InformationIn 2009 <strong>Council</strong> libraries commenced lending powermeters to residents to conduct their own householdenergy audit and compare the amount of electricityused by various appliances. The power meters stillenjoy popularity among library users recording 203loans throughout <strong>2010</strong>/<strong>2011</strong>.<strong>Council</strong> also partnered with Energy Australia’sEnergy Efficiency Training program, to train stafffrom Charlestown, Morisset, and Toronto libraries,to advise residents on ways to save money ontheir power bill and where to go if they are havingdifficulties in paying their power bill.Community ShowerheadExchange ProgramHunter Water Corporation (HWC) and <strong>Council</strong> invitedresidents to exchange their existing showerhead fora free water efficient one. With 650 showerheadsexchanged (323 premium and 327 standard units)the program is expected to deliver savings ofapproximately 8,200 kilolitres (kL) of water and 161tCO 2-e each year. In further recognition of the program,<strong>Council</strong> accepted the Water Conservation Awardat the 2009/<strong>2010</strong> Local Government and ShiresAssociation Environment Awards.Let’s Clear the AirFinanced through a $20,000 Department ofEnvironment, Climate Change and Water Clean Airand Healthy Communities grant, in July <strong>2010</strong> <strong>Council</strong>to delivered the following three components:Cycling Rack InstallationExpressions of interest from the community weresought on suggestions of new locations for cyclingracks. This resulted in the installation of 20 racks withsignage thanking residents for cycling and cleaningthe air.Cycling Skills DevelopmentRunning from August to October <strong>2010</strong>, free cyclingworkshops were offered to residents as part ofthe On Your Bike program. Thirty two residents,from children to seniors, learnt cycling and bikemaintenance skills to help them safely use <strong>Council</strong>’sextensive shared pathways.WOW Schools ChallengeThe WOW (Walk on Wednesdays and Other Days)challenge ran throughout November and December<strong>2010</strong>. The Challenge’s aim was for schools toencourage their students to ride, walk, or skate toand from school. The benefits included reducingtraffic and air pollution around the schools, studentsbecoming fitter and healthier, and connectingstudents, parents, and teachers. Over 24,000active transport trips were recorded, 1,100 studentstook part, with 400 of these students recordingthe maximum possible trips. The WOW AwardsPresentation, in March <strong>2011</strong>, identified that a numberof schools would continue with the behaviour -one school pledged to run the Challenge again,while another started a Walking School Bus on apermanent basis.Natural Disaster Awareness andPreparednessThe objective of <strong>Council</strong>’s natural disaster awarenessand preparedness work is to assist the community toidentify and be prepared for natural disaster risks, tostay safe, and recover should a natural disaster occur.<strong>Council</strong> started the Emergency Ready <strong>Lake</strong><strong>Macquarie</strong> project, utilising a $20,000 grantreceived from the Natural Disasters Resilience GrantScheme. The project will develop web pages on<strong>Council</strong>’s website to provide practical and up-to-dateinformation about natural disasters including planning,preparing and recovering, should a natural disasteroccur.
Our Performance 51Sustainable Eating GuideAs a project partner with the NSW GovernmentLove Food Hate Waste campaign, <strong>Council</strong> developedan eating guide to promote both healthy, local, andseasonal food shopping and strategies for reducingfood waste and related pollution. The guide listsfarms, markets, and shops that supply sustainablyproduced food items as well as recipes that reflectseasonal foods. Two thousand copies of the guidehave been distributed at events, such as SustainableLiving Workshops, Love Food Hate Waste, and theLiving Smart Festival. An electronic copy of the guideis available at www.lakemac.com.au.Sustainable Living GuideThis guide provides citizens with practical informationabout actions to decrease water and energyconsumption and reduce waste. <strong>Council</strong> reprinted500 copies to hand out at events, workshops, anddistribute through local libraries. The implementationof actions set out in this guide will benefit both currentand future generations by providing a sustainableplanet for all. An electronic copy is available atwww.lakemac.com.au.Environmental GrantsEnvironmental Research GrantsSince 1987, the <strong>Lake</strong> <strong>Macquarie</strong> EnvironmentalResearch Grants Scheme has provided fundingsupport for approximately 117 environmental researchprojects by universities and other organisations.The projects that received research grants during<strong>2010</strong>/<strong>2011</strong>, with assistance of sponsorship fromEraring Energy ($1,100), Delta Electricity ($3,000),and Oceanic Coal / Xstrata ($5,500) include:Distribution of genotypes of the vulnerableTetratheca juncea Sm. (Elaeocarpaceae) andimplications for its conservation ($6,364);Underlying mechanisms and managementsolutions of Indian Myna (Acridotheres tristis)population expansion in the Hunter region($6,784);Seagrass trophic interactions in a changing ocean($7,720);Assessment of bioaccumulation of lead in chickeneggs from residential backyards in the vicinity of adisused lead/zinc smelter ($7,950); andReview of <strong>Lake</strong> <strong>Macquarie</strong> <strong>City</strong> <strong>Council</strong>environmental communications strategies ($3,045).
52<strong>City</strong> of <strong>Lake</strong> <strong>Macquarie</strong>- <strong>Annual</strong> <strong>Report</strong> <strong>2010</strong>/<strong>2011</strong>Environmental Sustainability GrantsThe Environmental Sustainability Grants Program provides grants of up to $3,000 for community groups andschools to fund projects that support improved environmental sustainability behaviours. Grants totalling $29,726were awarded to 13 community groups and schools to undertake environmental sustainability projects (Table 3).Table 3: Summary of Environmental Sustainability Grants RecipientsApplicant Project Title $ funds awardedLT Creek Sustainable Neighbourhood Group LT Creek Sustainable Neighbourhood Group Notice604BoardWarners Bay Community Garden Warners Bay Community Garden Bike Rack Project 1,300Birralee Long Day Care Centre Birralee Waste, Water and Energy Efficiency Project 1,860Morisset High School Wildlife Corridor (Phase 2) 3,000Belmont Men’s Shed and Community Garden Solar Installation 3,000Blacksmiths Public School Water for the Future 3,000Awabakal Environmental Education Centre Binless and Brave 2,850Garden Suburb Public SchoolIllawong Park LandcareOutdoor Environmental Learning Area and VegetableGardenProtecting and Revitalising Illawong Park, SwanseaHeads3,0001,412Native Animal Trust Fund Incorporated, WildlifeRescue ServiceSupporting <strong>Lake</strong> <strong>Macquarie</strong>’s Baby Birds 2,980Hunter Alliance for ChildhoodSustainable Living education component for the‘Expo for Childhood’2,440St John Vianney Catholic School, Morisset Operation Half Flush 1,280South <strong>Lake</strong> Community Services IncorporatedSouthlake Environmental and Sustainable LivingWorkshops3,000
Our Performance 53Government Environment GrantsGovernment environmental grants totalling $340,335 awarded to <strong>Lake</strong> <strong>Macquarie</strong> community groups (Table 4).Table 4: Summary of Government Environmental Grants to <strong>Lake</strong> <strong>Macquarie</strong> <strong>City</strong>Community GroupsGroup/Individual Project Title funding source $ amountLandcare Resource OfficeIllawong Park Littoral Rainforest and Themeda GrasslandFloraville regeneration of remnant rainforest gully plusawareness programLandcare for YouthNSW Environmental Trust 46,75027,86046,750Blacksmiths BeachDunecareWangi Ridge PreservationLandcareWarners Bay LandcareMarmong LandcareCaves Beach DunecareFernleigh Track LandcareBlack Ned’s Bay LandcareBlacksmiths Dunal Restoration and Demonstration ProjectWangi Peninsula Green Corridor ProjectWarners Creek Riparian and Community Involvement ProjectWetland Rehabilitation and Community Education ProgramDune Restoration at Caves BeachLinking the Fernleigh Track Green CorridorLittoral Rainforest Restoration at Black Ned’s BayAustralian GovernmentCaring for Our CountryCommunity Action Grant20,00020,00020,00020,00020,00020,00020,000<strong>Lake</strong> <strong>Macquarie</strong> LandcareNetworkCommunity Landcare Resource Centre Mowerand Trailer ProjectsNSW Government BuildingPartnerships Program15,000<strong>Lake</strong> <strong>Macquarie</strong> LandcareNetworkLandcare Resource OfficePump Station Carbon Offset ProgramRedhead Rising MainWindaleHWC 7,50020,90014,900Landcare Resource Office Highfields – Fernleigh Track edge Crown Reserve Project– Department of PrimaryIndustry10,000<strong>Lake</strong> <strong>Macquarie</strong> LandcareNetworkBelmont WetlandsLandcare Australia – MobileMuster10,000Landcare Resource Office Galgabba Fifteen Trees Project 675Environment and SustainabilitySpecial Rate VariationIn April 2009, <strong>Council</strong> successfully applied to theMinister for Local Government for a special variationto the ordinary rates to fund a program of activitiesdirected towards sustainability and environmentalimprovements. This is a dedicated program to benefitthe lake, its catchment, the coastline, and the healthand wellbeing of the community.Projects funded from the Environment andSustainability Special Rate Variation include:<strong>Lake</strong> and catchment on-ground works, includingSQID installation, to enhance the health ofterrestrial and aquatic ecosystems;On-ground works to improve the health ofsaltmarsh and wetlands;Creek stabilisation and riparian vegetation works;Ecosystem enhancement works, includingparticipation in local community tree planting,bushland weeding, and protecting threatenedhabitats;Energy and water efficiency projects, includingpromoting efficiency measures and rebates forhouseholds and businesses, and SustainabilityAdvantage Program;Infrastructure and system installation to reduceemissions in <strong>Council</strong> operations, includingpurchase of GreenPower, solar photovoltaicinstallations, and the uptake of smaller fleetpassenger vehicles;
54<strong>City</strong> of <strong>Lake</strong> <strong>Macquarie</strong>- <strong>Annual</strong> <strong>Report</strong> <strong>2010</strong>/<strong>2011</strong>Waste reduction strategies for <strong>Council</strong> operationsand across the city, including business wastemanagement, Love Food Hate Waste and 10:10campaigns, and Clean Up <strong>Lake</strong> <strong>Macquarie</strong>;Establishment of a contaminated sites register forland within the city;Provision of community information about naturaldisaster risk minimisation from floods, storms, andbushfire;Climate change planning and adaptationmeasures, including a new award-winning tool,eShorance, to estimate potential recession of thelake foreshore due to sea level rise;Flood mitigation on-ground works, including floodwarning signage and height markers;Measuring and auditing improved energyefficiency, water saving, waste minimisation, andcarbon footprint reduction for the city and <strong>Council</strong>operations;Measuring and auditing <strong>Council</strong>’s performance toprevent ecosystem degradation, environmentalhealth, adapting to climate change, and minimisingrisks from natural disasters;Involving the community in local sustainabilityprojects and facilitating the establishment ofSustainable Neighbourhood groups within the city;andCoordination of the Sustainable Schools program.An overview of the work fully or partially funded bythe Special Rate Variation is contained within the OurFinances section of this annual report.<strong>Lake</strong> <strong>Macquarie</strong> <strong>City</strong> <strong>Council</strong> –‘Walk the Talk’Oil Supply Vulnerability Policy andSchedule of Activities<strong>Council</strong> adopted the <strong>Lake</strong> <strong>Macquarie</strong> <strong>City</strong> Oil SupplyVulnerability Policy and Schedule of Activities on 11November <strong>2010</strong>. This policy and schedule buildson <strong>Council</strong>’s Greenhouse Gas Emission ReductionTargets Policy (2008) and provides the frameworkto manage risks associated with predicted futureshortage of oil and related increase in price.<strong>Council</strong> endeavours to prepare the city for likelyincreases in the cost of living associated withincreased fossil fuel prices. It is also committed topromoting understanding of the world’s oil depletionproblem, and to working with its citizens and otherstakeholders to identify and raise public awarenessand respond to threats posed by predicted, andfuture, oil supply vulnerabilities.Environmental Sustainability Action PlanOn 29 July, <strong>Council</strong> adopted the <strong>City</strong> of <strong>Lake</strong><strong>Macquarie</strong> Environmental Sustainability Action Plan<strong>2011</strong>-2018. This plan updates and replaces the2004 <strong>Lake</strong> <strong>Macquarie</strong> Environmental Action Planwith the aim of setting out strategic objectives,actions, community/organisational indicators, anddepartmental responsibilities for the delivery ofenvironmental sustainability outcomes.Adoption of this plan assists <strong>Council</strong> to deliver on itscommitment to a sustainable future by integratingmeasurable actions across the organisation. Theplan enables the organisation to track progressagainst environmental targets, facilitates updatesof operational and business plans, and fulfilsrequirements to receive the NSW Government Wasteand Sustainability Improvement Payments. The planwill be updated annually and progress reported in<strong>Council</strong>’s <strong>Annual</strong> and State of Environment <strong>Report</strong>s.
Our Performance 55Sustainability Advantage<strong>Council</strong> became a member of the OEH SustainabilityAdvantage program in 2009 and targeted the WorksDepot and Administration Building to identify areasfor improvement in resource efficiency. The programengages stakeholders from different areas of <strong>Council</strong>to assist mainstreaming of sustainability throughoutthe organisation. The program scope has increasedto include other <strong>Council</strong> facilities and operationalareas.Two further modules have been undertaken throughthe program. The Staff Engagement module resultedin adoption of a Staff Sustainability Strategy. TheSupply Chain Management module aims to increase<strong>Council</strong>’s sustainable procurement through identifyingalternative goods and working with suppliers toincrease business sustainability.The Emit-O-MeterThe Emit-O-Meter is a digital display connectedto the electricity meters of <strong>Council</strong>’s 15 largestfacilities. It calculates the carbon pollution of eachsite for the current week and compares it to thepollution produced the same week in the previousyear, demonstrating the success of <strong>Council</strong>’s carbonreduction programs. The Emit-O-Meter also providessuggestions to support our city in replicating <strong>Council</strong>’sproven carbon reduction strategies. If you wish toview <strong>Council</strong>’s carbon reduction there is a monitoravailable in <strong>Council</strong>’s Customer Service Centre andSwansea Library.In recognition of its demonstrated commitment tosustainability, <strong>Council</strong> was awarded Silver Partnerstatus for the delivery of tangible and long-termsustainability outcomes.
56<strong>City</strong> of <strong>Lake</strong> <strong>Macquarie</strong>- <strong>Annual</strong> <strong>Report</strong> <strong>2010</strong>/<strong>2011</strong>WASTE AT A GLANCESOLID Waste ManagementSTATEPoor The city experienced a decrease of 135kg per capita in <strong>2010</strong>/<strong>2011</strong> of waste landfilled compared to the 2001/2002baseline of 607kg per capita. The remaining life of the Awaba Waste Management Facility is approximately fouryears. <strong>Council</strong> adopted a preferred waste processing technology, which recommends the phased introduction of athree bin system. The additional bin will be provided for green waste collection, initially for garden waste and with theaddition of food waste after an implementation period.PRESSUREIncreasingThere is increased pressure from: a growing residential population and associated consumption habits; diminishinglandfill capacity; increasing cost of NSW Government landfill charges; and a potential future price on carbonpollution. These pressures, together with increasing community expectation to provide resource recovery servicesand emerging problematic waste streams, such as eWaste and fluorescent light globes, continue to adversely affectthe environment.RESPONSEImprovingThere is ongoing waste minimisation campaigns and continued provision of waste services. Currently progressingwaste management strategies and infrastructure options to extend the life of the Awaba Waste Management Facilityand reduce waste to landfill.Effluent ManagementSTATEStableThere are approximately 2,287 septic system installations approved within <strong>Lake</strong> <strong>Macquarie</strong> <strong>City</strong>.PRESSUREIncreasingHWC reports 1,067 sewer overflows during <strong>2010</strong>/<strong>2011</strong> (866 due to roots). These overflows have the potential tocause environmental harm.RESPONSEImproving<strong>Council</strong>’s Sewer Audit Program enforces connection to sewer system in areas where connection has becomeavailable. HWC is continuing to upgrade the sewerage system to prevent overflows occurring.Waste
Our Performance 57ENVIRONMENTAL INDICATORSSolid Waste ManagementANNUAL LEVEL<strong>2010</strong>/<strong>2011</strong>CURRENTTRENDTotal waste landfilled 94,073tTotal waste re-used and recycled at the Awaba Waste ManagementFacility5,646tCapture and flaring of methane gas at Awaba Waste ManagementFacility (in partnership with Landfill Management Services):Approximate combustion of landfill gas (powering a one megawattcapacity power generation facility)Megawatt hours suppliedSupplying electricity to approximate number of householdsEquating to greenhouse gas abatement572m 3 /hour8,120 megawatt hours1,08035,538t CO 2-eApproximate remaining capacity at the Awaba WasteManagement Facility457,949m 3Projected life of waste landfill site4 yearsTotal waste diverted from landfill 24,942tTotal waste landfilled per capita472kgTeralba Worm Farm:Waste recycled (through worm farming, composting, and mulchingduring the reporting period and converted into garden products)Estimated greenhouse gas reduction through diversion of waste fromlandfill (by worm farming, composting, and mulching)434.3t(further detail Table 8)529t CO 2-eIncome from sale to the public$4,294Number of unit sales through direct sales, educational activities, andhands-on educational demonstrationsEstimated greenhouse gas reduction through direct sales of wormfarms, compost bins, and vermiculture units10335t CO 2-eEstimated total greenhouse gas reduction resulting from diversion oforganic waste from landfill564t CO 2-e
58<strong>City</strong> of <strong>Lake</strong> <strong>Macquarie</strong>- <strong>Annual</strong> <strong>Report</strong> <strong>2010</strong>/<strong>2011</strong>ENVIRONMENTAL INDICATORSEffluent ManagementANNUAL LEVEL<strong>2010</strong>/<strong>2011</strong>CURRENTTRENDNumber of sewage treatment plantsStandard of treatment provided at each treatment plantApproximate number of waste/sewer customer connections serviced in<strong>Lake</strong> <strong>Macquarie</strong> <strong>City</strong>Note: Remains unchanged to the nearest 1,000 customer connections from 2009/<strong>2010</strong> report.Volume effluent recycled% of total effluent recycledNumber of on-site sewage treatment systems licensed to operate in<strong>Lake</strong> <strong>Macquarie</strong> <strong>City</strong>4Belmont: secondaryDora Creek: tertiaryEdgeworth: tertiaryToronto: tertiary75,000 customer connections(72,000 residentialconnections)1,694 megalitres (ML)(see Table 12)100%2,287Solid Waste ManagementAwaba Waste Management FacilityWaste arrives at the facility from a variety of sources, including <strong>Council</strong> collection vehicles, waste collectioncontractors, or self-haulage by businesses and residents. Upon entering the facility, waste is classified andcharged in accordance with the following categories: mixed waste (e.g. building and demolition waste); organicgarden waste; household recyclables; special wastes (e.g. asbestos); and clean fill. A summary of landfill andrecycling waste streaming is provided in Tables 5 and 6 respectively.Table 5: Awaba Waste Management Facility – Solid Waste Operations<strong>2010</strong>/<strong>2011</strong>Total waste receivedOn-site use for operations99,525.01t686tWaste recovered for reuse 4,960tWaste to landfill 93,878tWaste landfilled per capita472kgCompared to 2001/2002 waste landfill rate performance target (607kg/capita) 22%
60<strong>City</strong> of <strong>Lake</strong> <strong>Macquarie</strong>- <strong>Annual</strong> <strong>Report</strong> <strong>2010</strong>/<strong>2011</strong>Hands-on workshops, and <strong>Council</strong>’s Living Smart Festival, aim to build the capacity of residents to live a moreenvironmentally friendly and sustainable lifestyle.Table 7: Workshops and activitiesWorkshops <strong>2010</strong>/<strong>2011</strong>Sustainable Living Workshops:Backyard GardeningEnergy Smart LivingFood for ThoughtDelightful DecompositionGardening with NativesNatural Pest Control and Companion PlantingNature Watching in KahibahMake Your Own Backyard HabitatRainwater Tank MaintenanceSustainable EatingSupermarket Your BackyardWaste Not Want NotTeralba Worm Farm:Total number of people engaged in waste educationTotal number of visitorsTotal number of pre-organised group toursTotal number of groups visiting site (including pre-organised)Total number of visits to schoolsTotal number of visits to community groupsTotal number of pre-school worm farm factory set-upsTotal number of people engaged in waste education off siteChemical CleanOut (May <strong>2011</strong>)eWaste drop-offHome Composting Trial:Composting workshops conducted in partnership with Bunnings, Belmont19 workshops - 304 attendees (in total)1 workshop - 21 attendees3 workshops - 35 attendees2 workshops - 32 attendees1 workshop - 17 attendees1 workshop - 19 attendees2 workshops - 32 attendees1 workshop - 14 attendees1 workshop - 26 attendees2 workshops - 31 attendees3 workshops - 45 attendees1 workshop - 16 attendees1 workshop - 16 attendees1,02390620 groups20 groups1 visit/ 35 students plus teachersNil3 events / 82 children plus carers117601 visitorsNil during <strong>2010</strong>/<strong>2011</strong>26 workshops - 135 attendeesActivities <strong>2010</strong>/<strong>2011</strong><strong>2010</strong> Living Smart Festival Held: 12 September <strong>2010</strong>Atttendees: Approximately 8,000Stalls: Over 60Workshops: 24 workshops - 502 attendeesLow Energy Event: 100% solar powered(including stage)<strong>Council</strong> handouts: 500 copies SustainableLiving Guide10:10 pledges: 160 peopleBike Valet Parking: 60 bikesWaste: 3 bins only / 4,104L wasteTable 8: Tonnes of Waste Recycled through Teralba Worm Farm OperationsYearTOTAL - Waste throughworm farm (t) Income generated ($)Estimated greenhouse gas reduction incarbon pollution (t CO 2-e)<strong>2010</strong>/<strong>2011</strong> 434.3 4,294 529Note: National Greenhouse Accounts Factors (revised July <strong>2011</strong>) (DCC&EE <strong>2011</strong>) were utilised to calculate the estimated greenhouse gas reduction:Food (including vegetable waste, restaurant waste) 1.6; Paper (including paper towel and shredded paper) 2.5; and Garden (including grass clippings andwoodchip) 1.2.
Our Performance 63Hunter Water Corporation Effluent and Biosolids ReuseEffluent (Table 12) and biosolid recycling (Table 13) reduces the demand for potable water, and the need to usewater from natural sources. This recycling, also found to reduce the volume of effluent discharged from treatmentplants, further reduces potential environmental impacts.Table 12: Approximate Effluent ReuseSites 2008/2009 (ML) 2009/<strong>2010</strong> (ML) <strong>2010</strong>/<strong>2011</strong> (ML)Eraring Power Station 1,334 1,312 1,064 *Edgeworth Washery 547 888 545 #Waratah Golf Course 108 94 85 +Total (ML) 1,989 2,294 1,694Source: LMCC (<strong>2010</strong>) and HWC (<strong>2011</strong>)* Eraring Power Station usage has decreased due to a number of maintenance shut down periods over the year (approximately eight) a well as a period oftime in October/November <strong>2010</strong> where reuse had to be limited to 3ML/day due to critically low dam levels.#Edgeworth - Oceanic Coal Washery reuse decrease is associated with algal issues on the recycled water storage pond in July <strong>2010</strong> as well as theconstruction of the new ultraviolet disinfection system and recycled water storage at Edgeworth Wastewater Treatment Works resulting in limited supplyopportunities since April <strong>2011</strong>.+Decreased Waratah Golf Course usage may be attributed to wet weather, reducing need for irrigation.Table 13: Approximate Dewatered Biosolid ReuseYearAgriculture(%)Mine SiteRehabilitation(%)MunicipalComposting(%)Landscaping(%)Stockpile(%)TOTALBiosolidsProduced(t)BiosolidsReused (%)TOTALBiosolidsReused2008/2009 40.48 47.52 0 0 12* 5,785 88* 5,0912009/<strong>2010</strong> 60.63 39.37 0 0 0 2,029 100 2,029<strong>2010</strong>/<strong>2011</strong> 68.23 25.5 0 0 6.27* 2,186 93.73* 2,049Source: HWC (<strong>2011</strong>a)* 12% and 6.27% stockpiled for reuse over time – HWC is effectively operating at 100% reuse.Note: The above biosolids figure for 2008/2009 is much higher than reported in 2009/<strong>2010</strong> and <strong>2010</strong>/<strong>2011</strong> – HWC explains that council boundaries andcatchment boundaries do not match up and in 2008/2009 it appears a total figure, including areas within Newcastle <strong>City</strong> may have been included, as figureswere based on catchments rather than council boundaries. For 2009/<strong>2010</strong> and <strong>2010</strong>/<strong>2011</strong> reporting year, HWC has only included biosolids/sludge productionthat occurs within <strong>Lake</strong> <strong>Macquarie</strong> <strong>City</strong>.Trade Waste PermitsMany liquid wastes, generated as a by-product of trade industries, contain products detrimental to the HWCsewerage system. These liquid wastes, defined as ‘trade waste’, require an agreement to discharge into the sewersystem. As such, Trade Waste Permits issued by HWC regulate the discharge of this wastewater stream to thesewerage system (Table 14).Table 14: Waste Permits issued by Hunter Water CorporationYear No. of Permits Type of Permit Issued<strong>2010</strong>/<strong>2011</strong> 66 0 deemed trade waste agreements14 renewal of minor trade waste agreements32 new minor trade waste agreements6 renewals of moderate trade waste agreements8 new moderate trade waste agreements2 new major trade waste agreements4 renewal of major trade waste agreementsSource: HWC (<strong>2011</strong>a)Further detail regarding Trade Waste Permits is provided in the Hunter Water Trade Wastewater Policy available onHWC’s website www.hunterwater.com.au.
64<strong>City</strong> of <strong>Lake</strong> <strong>Macquarie</strong>- <strong>Annual</strong> <strong>Report</strong> <strong>2010</strong>/<strong>2011</strong>LAND AT A GLANCELand Use ChangesSTATEImprovingThe density of development in existing residential areas is increasing, with town centres increasingly being supportedby higher density development. However, limiting greenfield development on the urban fringe remains a challenge.PRESSUREIncreasing The demand for land for urban development will consistently remain high in order to accommodate the anticipatedpopulation growth in the Lower Hunter and in <strong>Lake</strong> <strong>Macquarie</strong> <strong>City</strong>, in particular. Demand for land is placing pressure onrural and bushland areas.RESPONSEImproving Recent trends indicate increasing numbers of higher density and mixed use redevelopments in the city centres. Thepreparation of draft <strong>Lake</strong> <strong>Macquarie</strong> Local Environment Plan (LMLEP) <strong>2011</strong>, draft Development Control Plan (DCP) <strong>2011</strong>,and draft Lifestyle 2030 (LS 2030) and their ultimate adoption will provide the framework for continued improvementsin the sustainability, equity, efficiency, and liveability of land use. The draft planning controls will continue to encouragemedium density infill redevelopment and reduce pressure for new greenfield development.Population and Settlement PatternsSTATEImprovingRecent trends indicate increasing settlement and redevelopments in the city centres. Growth continues in residential,commercial, and industrial development. Limiting the development on the urban fringe remains a challenge.PRESSUREIncreasing The population is expected to grow by 60,000 people over the next 20 years, which will create a demand for 36,000 new dwellings.RESPONSEGood The implementation of Lifestyle 2020 (LS 2020), LMLEP 2004 and DCP No. 1 sets high standards to accommodatesustainable future growth. The preparation of draft LMLEP <strong>2011</strong>, draft DCP <strong>2011</strong>, and draft LS 2030 and their ultimateadoption will provide the framework for continued improvements in the sustainability, equity, efficiency, and liveability ofland use. The draft planning controls will continue to encourage medium density infill redevelopment and reducepressure for new greenfield development.Community LandsSTATEStable<strong>Council</strong> has continued to improve and enhance the environmental condition of its community land, principally throughLandcare and lake shoreline rehabilitation projects.PRESSUREIncreasing Increasing population and urban development is placing pressure on existing areas of community land.RESPONSEGood <strong>Council</strong> prepares and updates plans of management to guide the use and management of community land. Whilegeneric plans cover most areas, individual plans are prepared for larger and more significant areas of land. The care,control, and management of most sporting areas are delegated to community operating committees or incorporatedsporting clubs. In addition, <strong>Council</strong> cares for informal parks, picnic areas, and playgrounds, and manages Crownland where <strong>Council</strong> is the trust manager. As limited funds are available for the maintenance and rehabilitation works inbushland reserves, the increasing number of Landcare groups are assisting with management of these areas.Land
Our Performance 65Soil ErosionSTATEStablePRESSUREIncreasingRESPONSEImprovingOngoing development and major infrastructure projects by statutory authorities, such as underground electricityand gas provision by various contractors, HWC and the NSW Roads and Traffic Authority (RTA), continue to providechallenges to <strong>Council</strong> staff.Soils in the city have moderate to extreme erosion hazard, depending on the type of soil and slope. Mostdevelopment sites are sloping with dispersible soils. Major earthworks at Cameron Park, Cooranbong, Belmont, and<strong>Macquarie</strong> Hills continue to be a source of complaint.Development and <strong>Council</strong>’s operations must comply with <strong>Council</strong>’s erosion and sediment control requirementsin DCP No. 1. <strong>Council</strong> is reviewing the erosion and sediment control conditions for development approvals. Allresidents, contractors, and developers have obligations to prevent water pollution under the NSW Protection of theEnvironment Operations Act 1997 (PoEO Act).Potential Acid Sulfate SoilsSTATEStablePRESSUREIncreasingRESPONSEGoodAcid Sulfate Soil Planning Maps, which detail the location of actual and potential acid sulfate soils, have beenprepared by OEH.Expanding population of the area and the development associated with this growth increases the risk of exposure ofpotential acid sulfate soils.Clauses in LMLEP 2004 and DCP No. 1 and No. 2 assist in managing potential acid sulfate soils through thedevelopment assessment process.Contaminated LandSTATEWidespreadin northernareasPRESSUREUnknownRESPONSEReasonableSoils historically contaminated with heavy metals (lead, arsenic, chromium, cadmium) from smelting occur across theLGA, particularly in the north.Contaminated soils associated with smelting have two major sources:• atmospheric fallout from the Cockle Creek lead smelter which operated from 1922 to 2003; and• smelter by-product (black slag), used widely by <strong>Council</strong> and community as fill material in engineering andconstruction works (surface levelling, backfill to walls and drains, drainage medium). In excess of 2 million tonnesof slag may have been transported off-site during smelter operations.Consequently, black slag underlies some public reserves, parks, ovals, lake foreshore and paths, kerbs and roadways.Lead and other heavy metals in slag-affected soils may adversely affect human health and the environment.Research funded by <strong>Council</strong> revealed that black slag contains high lead concentrations, which may affect humanhealth if absorbed into the bloodstream via ingestion or inhalation.Accumulation resulting in high lead blood levels can have serious health impacts, particularly for children, pregnantwomen, and the elderly. However, in most cases, the slag deposits are covered by topsoil, which reduces potentialhealth risks.<strong>Council</strong>’s Policy for the Management of Contaminated and Potentially Contaminated Land and an associatedregister of contaminated sites provides a system to inform property owners and potential buyers regarding anyhistory of contaminating activities and remedial works on a site.A <strong>Council</strong> procedure for ongoing management of public land contaminated by black slag provides risk assessmentand prioritisation of sites for remediation.A communication strategy informs the community and <strong>Council</strong> staff, particularly in relation to identifying black slagaffected soils and minimising potential health risks.<strong>Council</strong>’s DCP No. 1 requires consideration of soil contamination issues. Potentially contaminated land may requiredetailed assessment by a qualified contaminated land consultant and remediation to suit the intended use.
66<strong>City</strong> of <strong>Lake</strong> <strong>Macquarie</strong>- <strong>Annual</strong> <strong>Report</strong> <strong>2010</strong>/<strong>2011</strong>Flood Prone LandSTATEStablePRESSUREIncreasingRESPONSEGoodThe number and extent of flooding issues are progressively being addressed as floodplain risk management studiesand plans are developed, and implementation programs emanating from the plans are undertaken and completed.There is sustained interest for development, subdivision, and rezoning proposals on floodplains within the city.<strong>Council</strong> is continuing to undertake flood studies, floodplain risk management studies and plans for major catchmentareas, based on a strategic priority list compiled by its Floodplain Management Committee, and implementsmitigation actions as recommended in the Management Plans. <strong>Council</strong>’s development planning policies also placerestrictions on development in areas where the land is likely to be subject to flooding eg. minimum floor heightcontrols, site location controls, filling and sediment controls (refer to DCP No. 1 [2.1.7])Further, <strong>Council</strong> is taking a lead role in planning for sea level rise due to climate change. Future development in lowlyingareas will be required to consider the impacts of predicted sea level rise, increased frequency and intensity ofrainfall and increased flood levels.ENVIRONMENTAL INDICATORSLand Use ChangesRezoning for greenfields development (gazetted)Number of development approvals for:SubdivisionsResidential development (including strata title)Commercial premisesIndustrial premisesANNUAL LEVEL<strong>2010</strong>/<strong>2011</strong>51.1 hectares (ha)(2 sites)1062,00920323CURRENTTREND(decrease in area)Soil ErosionNumber of complaints reported to <strong>Council</strong> and investigated relating tonon-compliant erosion and sedimentation controls and water pollutionfrom construction sitesNumber of ‘Clean up’ and ‘Prevention’ notices issued under the PoEOAct for water pollution$ - amount – notices issued <strong>2010</strong>/<strong>2011</strong> under the PoEO Act and NSWEnvironmental Planning and Assessment Act 1979 (EP&A Act)Improvement noticesPotential Acid Sulfate SoilsArea of potential acid sulfate soils1255$9,720No longer issued7,602haContaminated Land (from <strong>Council</strong> database)Number of possible site contamination records 82Number of possible lead contamination records 2,748
Our Performance 67ENVIRONMENTAL INDICATORSANNUAL LEVEL<strong>2010</strong>/<strong>2011</strong>CURRENTTRENDContaminated Land (listed under the NSW Contaminated Land Management Act 1997)Records:Contaminated Land – SiteContaminated Land – OrderContaminated Land – VoluntaryContaminated Land – Maintenance9160Contaminated Land – Audit682Flood Prone LandNumber of properties potentially affected by flooding Approx. 15,000Population and Settlement PatternsEstimated population in <strong>Lake</strong> <strong>Macquarie</strong> <strong>City</strong>released 31 March <strong>2011</strong>, Australian Bureau of Statistics (ABS)Community LandsTotal area of community land<strong>Council</strong> SupportRegistered Landcare groupsLandcare in Schools groupsAboriginal Landcare groupsFinancial support to Landcare from <strong>Lake</strong> <strong>Macquarie</strong> <strong>City</strong> <strong>Council</strong>as follows:Support for Landcare Resource OfficeDune management – coastal systems programsWeed management programsSpecial projects – bush regeneration200,849*Approx. 2,450ha291705$105,825$100,000$150,000$102,000(0.9% increase)* ABS estimates of the resident population of Local Government Areas of Australia, according to the <strong>2010</strong> edition of the Australian Standard GeographicalClassification (ASGC).Note: previous estimate provided for 2009/<strong>2010</strong> report (199,277) revised to 199,074, and estimate for <strong>2010</strong> stated above, is preliminary.
68<strong>City</strong> of <strong>Lake</strong> <strong>Macquarie</strong>- <strong>Annual</strong> <strong>Report</strong> <strong>2010</strong>/<strong>2011</strong>Land Use ChangesDevelopment<strong>Council</strong> approved 2,341 development applications,and issued 1,900 construction certificates forbuildings (770 by private certifiers, 1,130 <strong>Council</strong>certified).Environmental Planning InstrumentsLMLEP 2004 and DCP No. 1 implement the strategicdirections contained in LS 2020. LMLEP 2004 hasprovided major policy improvements through:forging an explicit relationship between futuredevelopment and the vision, values, and aims ofLS 2020;incorporating objectives for each land use zone;a comprehensive list of permissible uses anddefinitions;promotion of ecologically sustainabledevelopment; andprotection of sensitive environments and items ofheritage significance.Between June <strong>2010</strong> and July <strong>2011</strong>, five amendmentsto LMLEP 2004 were gazetted. Within the sameperiod, one general revision to DCP No. 2 was carriedout. <strong>Council</strong> is in the process of convertingLMLEP 2004 into the Standard Instrument – PrincipalLocal Environmental Plan in accordance with theplanning reforms required by the NSW Government.The preparation of draft LMLEP <strong>2011</strong>, draft DCP<strong>2011</strong>, and draft LS 2030 and their adoption willprovide the framework for continued improvementsin the sustainability, equity, efficiency, and liveability ofland use.The following strategic documents were adopted by<strong>Council</strong> during the reporting period:Wyee Structure Plan;Morisset Town Centre Area Plan; andCoorumbung Road Dora Creek Area Plan.Bushfire Hazard Reduction andManagement PlansUnder the NSW Rural Fires Act 1997, land managersand owners are responsible for conducting hazardreduction to protect existing dwellings, majorbuildings, or other assets susceptible to fire. Thecost to <strong>Council</strong> for fire mitigation within reserve landtotalled $607,375 to include hazard reduction work:Asset Protection Zone maintenance –approximately 85ha (or approximately 1,728km)comprised of approximately 285 sites; and• Fire Trail Maintenance – approximately 8km.Note: previous registration and reporting of HazardReduction Certificates, within the Regional FireService, Bushfire Risk Information ManagementSystem, is currently under review.To prioritise <strong>Council</strong>’s bushfire mitigation worksprogram, a <strong>Lake</strong> <strong>Macquarie</strong> Bushfire RiskManagement Plan was drafted. The plan details andmaps all urban interface assets (residential housing,retirement villages, hospitals etc.) and allocates ahazard rating from low to extreme against each asset.With the adopted plan, <strong>Council</strong> will re-evaluate allbushfire mitigation works and areas including assetprotection zones, strategic fire advantage zones, andfire trails.Population andSettlement PatternsThe estimated population is over 200,000, makingit the largest city in the Lower Hunter and the fourthmost populous in NSW. For the period 2005 to<strong>2010</strong>, the city’s annual population growth rate was1%. Between 2009/<strong>2010</strong> and <strong>2010</strong>/<strong>2011</strong> the city’spopulation grew by 1,775 people (0.9%). Over thenext 20 years, the percentage of our populationaged 55 plus is expected to increase from 29% to39% and the overall population is expected to growby 60,000 people, creating demand for 36,000new dwellings and 12,200 new jobs (Department ofPlanning 2006).
Our Performance 69Amendments to LMLEP 2004 continue to facilitatesustainable outcomes for the city. This includes theincremental review and rezoning of land parcelscurrently zoned 10 - investigation to a mix of urbanand conservation zones. The preparation of draftLMLEP <strong>2011</strong>, draft DCP <strong>2011</strong>, and draft LS 2030 willprovide the framework for continued improvementsin the sustainability, equity, efficiency, and liveability ofland use. The draft planning controls will continue toencourage medium density infill redevelopment andreduce pressure for new greenfield development.Community Lands<strong>Council</strong> controls approximately 300ha ofsportsgrounds, 325ha of parks, 1,750ha of naturalareas (bushland, wetland, foreshores, escarpments,watercourses, etc.), and 75ha of general communityuse land (leased areas, public halls, child carecentres, senior citizens centres, etc.).Total area ofcommunity land is approximately 2,450ha.This equates to approximately 123m²/resident of<strong>Council</strong>-owned community land.The total areaof community land increased from the previousreporting year due to improved analysis of databaseinformation.The areas above do not include Crown land(total area of approximately 2,645ha) that <strong>Council</strong>manages. Crown land includes areas such as SpeersPoint Park, Warners Bay foreshore reserve, ChapmanOval (Swansea), Kahibah Recreation Reserve, andBernie Goodwin Park (Morisset), plus extensivebushland reserves and most of the small foreshorereserves. The city has approximately 255m²/residentof total open space, including this Crown land, andexcluding the body of <strong>Lake</strong> <strong>Macquarie</strong>.Illegal DumpingIn <strong>2010</strong>, <strong>Council</strong> launched a comprehensive programto address illegal dumping across the city. Theprogram began with an ‘illegal dumping blitz’ thatidentified and mapped the location of dumping hotspots. The data gathered from this process has beenused to ensure that <strong>Council</strong>’s program is specificallytargeted to problem areas and waste types. Theprogram consists of three streams that includeon-ground works, compliance, and communityeducation. Through the on-ground works stream, aseries of deterrence measures were trialled at eightsites including gates, fencing, landscaping, and signs.The trial identifies successful techniques appliedat additional hot spots in the city. The compliancestream involves the use of surveillance and rangerpatrols. These measures are proving to be a key toolin managing illegal dumping and have resulted in theissuing of clean-up notices and fines. Finally, <strong>Council</strong>has run a series of community education noticesincluding a television commercial, newspaper articles,and media releases. The education seeks to promoteappropriate disposal of waste whilst highlighting thenegative impacts illegal dumping has on the amenity,aesthetic, and environmental values of the city.Office of Environmentand HeritageCommunity InvolvementOEH undertook community involvement projects inthe following National Park estates (OEH <strong>2011</strong>a):Ongoing works within portions of <strong>Lake</strong> <strong>Macquarie</strong>State Conservation Area (SCA) include:- Awaba Bay Landcare Group – regeneratingbushland between Marmong Point and BoltonPoint – 220 volunteer hours;- Wangi Peninsula Landcare Group regeneratingbushland with continued support through aHunter-Central Rivers Catchment ManagementAuthority (HCRCMA) grant to target weeds ofnational significance including Bitou Bush andLantana – 165 volunteer hours;- Morisset Park Landcare Group – regeneratingbushland reserve and supported byEnvironmental Trust funding – 240 volunteerhours; and- ongoing support for Morisset Rotary who visitPulbah Island to remove rubbish from theisland’s foreshore throughout the year.With support from NSW Maritime and NSW WaterPolice, two community bush regeneration dayswere held on Pulbah Island. Volunteers contributed320 hours to regenerating Pulbah Island –community days have been held twice a year since2000, and volunteers have helped regenerate over10% of the 70ha island.
70<strong>City</strong> of <strong>Lake</strong> <strong>Macquarie</strong>- <strong>Annual</strong> <strong>Report</strong> <strong>2010</strong>/<strong>2011</strong>Land ManagementOEH also undertook the following land managementactivities:Bushfire management, including wildfiresuppression and firebreak maintenance, across<strong>Lake</strong> <strong>Macquarie</strong> SCA.Engagement of contractors using EnvironmentalTrust funds to carry out bush regeneration.A weed management strategy for the southernportion of Morisset Park, completed usingEnvironmental Trust funds.Weed control programs on Pulbah Island and inWallarah National Park and <strong>Lake</strong> <strong>Macquarie</strong> SCA –with focus on Bitou Bush, Lantana, Crofton Weed,Morning Glory and other environmental weeds.Member of the Endangered Shore Birds projectworking to protect the nesting sites of the LittleTern and Pied Oystercatcher in and aroundSwansea channel.Soil ErosionThe city experienced weather extremes from heavyrain through to hot, dry, and windy conditions,which affected soil erosion and sediment loss. Over1,200 development sites, primarily residential, wereaudited across the city. Each site was visited at leastonce, often twice, during construction to ensureerosion and sediment controls were in place andmore frequently during wet periods. A focus oneducation for building contractors, site supervisors,and developers has resulted in an improvement insediment and erosion control measures and theirmaintenance across the city.<strong>Council</strong>’s Erosion and Sediment Control Officerreviews Category 3 and 4 development applications(residential and commercial subdivisions, largecommercial developments, and sites identified ashigh risk) as part of <strong>Council</strong>’s integrated planningprocess. Continual audits of development sites assistin minimising soil loss throughout the city.An emerging problem is the occupation of dwellingsprior to completion of landscaping and driveways.Properties are often unprotected as the erosion andsediment control measures are generally removedby new homeowners, due to a lack of understandingof their purpose and benefits. <strong>Council</strong> is workingproactively with residents to provide information andassistance to protect their land and the lake.Contaminated LandThe Lead Abatement StrategyIn 2007, the NSW Minister for Planning approvedrehabilitation of the former Pasminco Cockle CreekSmelter site, on the condition that a lead abatementstrategy be developed and implemented. DeedAdministrators managing the rehabilitation of thesmelter site, Ferrier Hodgson, commissionedconsultants, Fitzwalter Group, to prepare a LeadAbatement Strategy and Implementation Document.The Lead Abatement Strategy provides for soiltesting and rehabilitation services, for a limited timeperiod, to voluntary private property owners withinan identified area including part of the suburbs ofArgenton, Boolaroo, and Speers Point. In <strong>2010</strong>,<strong>Council</strong> sent letters to the affected private propertyowners, encouraging them to participate in the LeadAbatement Strategy. By July <strong>2011</strong>, approximately1,200 property owners had signed up to participate.Soil testing results indicated approximately 70% ofproperties did not require remediation.Flood Prone LandThere has been no change to the pressures on floodprone land. However, it is recognised that increasingdemand for development places pressure on marginallands, including flood prone and flood fringe areas.<strong>Council</strong> is continuing to undertake flood studies,floodplain risk management studies and plansfor major catchment areas in the city, based ona strategic priority list compiled by its FloodplainManagement Committee and endorsed by <strong>Council</strong>.Copies of completed studies and plans are availableon www.lakemac.com.au.Complementing <strong>Council</strong> policies regarding floodprone land is the <strong>Lake</strong> <strong>Macquarie</strong> Sea Level RisePreparedness Adaptation Policy report. Thisdocument commits <strong>Council</strong> to identify and respond toemerging hazards and risks associated with sea levelrise. <strong>Council</strong> is currently undertaking a review of the<strong>Lake</strong> <strong>Macquarie</strong> Waterway Flood Study/Plan reports1998 and 2001 to incorporate the implications ofclimate change, including predicted sea level rise andincreased frequency/intensity of rainfall. The emerginggoal is to provide a policy framework to assist <strong>Council</strong>and residents, as stewards of the city’s environment,to respond responsibly and proactively to emergingclimate change risks.
72<strong>City</strong> of <strong>Lake</strong> <strong>Macquarie</strong>- <strong>Annual</strong> <strong>Report</strong> <strong>2010</strong>/<strong>2011</strong>StormwaterSTATEStablePRESSUREIncreasingRESPONSEGoodMonthly water quality monitoring, and annual seagrass and macroalgae surveys, all show an improvement in thecondition of the lake overall. However, approximately 80% of pollutants, mainly sediment and nutrients, are enteringthe lake from non-point sources, such as urban runoff. These pollutants, together with altered stream flow patterns,continue to degrade the quality of creeks and waterways.New and infill urban development is increasing the number of waterways impacted by degraded stormwater runoffpatterns and water quality, despite planning controls and retrofitting of SQIDS.The Stormwater Management Plan (SMP) provides the strategic framework for the sustainable management ofstormwater in the lake and coastal catchments. <strong>Council</strong> is also continuing its SQID construction program, andimplementation of water sensitive urban design principles for new development areas. A project (in partnership with OEH)is currently underway (scheduled for completion in October <strong>2011</strong>) to model the stormwater runoff for the <strong>Lake</strong> <strong>Macquarie</strong>catchment, which will assist in quantifying the health of freshwater streams, as well as assist in their management.ENVIRONMENTAL INDICATORSDrinking Water Quality and ConsumptionAverage dwelling water consumption (per connection)Total residential water use supplied by HWCANNUAL LEVEL<strong>2010</strong>/<strong>2011</strong>178kL13,253,429kLCURRENTTRENDTotal industrial water use supplied by HWC914,705kLTotal commercial/municipal water use supplied by HWC4,112,489kLCompliance with National Health and Medical Research <strong>Council</strong>(NHMRC) and Australian Drinking Water Guidelines – Drinking waterquality for <strong>2010</strong>/<strong>2011</strong> (HWC <strong>2011</strong>a)Coasts and EstuariesBeach Suitability Grades (OEH <strong>2011</strong>b):Dudley, Redhead, Blacksmiths, and Caves beaches generally haveexcellent water quality and very few potential sources of faecal pollution.Swansea Heads Little Beach, and Glenrock Lagoon Beach generallyhave good water quality with some pollution generally triggered afterrainfall.NOTE: Percent compliance based reporting is no longer utilised (as per NHMRCGuidelines 2008). Recreational water quality is assessed in Beach Suitability Grades (verygood, good, fair, poor, very poor)*<strong>Council</strong>’s Summer Bathing Water Quality Monitoring (14 sites):1 Star “Bad”2 Star “Poor”3 Star “Fair”4 Star “Good”Star rating categories are derived from the microbial assessment categories used in theNHMRC (2008) guidelines (OEH <strong>2011</strong>c):‘Good’ rating - bacterial levels are safe for bathing according to National Health andMedical Research <strong>Council</strong> guidelines.‘Fair’ rating - bacterial levels indicate an increased risk of illness to bathers, particularlythose with lower immune function such as the elderly and young children.‘Poor’ and “Bad’ ratings - bacterial levels indicate a substantially increased risk of illnessto bathers.100%Very GoodGood171536248* <strong>Council</strong>’s summer bathing water quality monitoring has been rationalised from 25 sites (sampled fortnightly) to 14 sites (sampled weekly). <strong>Report</strong>ing currenttrends will occur within the <strong>2011</strong>/2012 State of the Environment report.
Our Performance 73ENVIRONMENTAL INDICATORSStormwaterNumber of ‘Clean up’ notices issued under the PoEO Actfor water pollutionNumber of ‘Prevention’ notices issued under the PoEO Actfor water pollutionANNUAL LEVEL<strong>2010</strong>/<strong>2011</strong>10CURRENTTRENDDrinking Water Quality and ConsumptionWater consumption for <strong>Lake</strong> <strong>Macquarie</strong> <strong>City</strong> as supplied by HWC (Figure 1) was as follows:total residential consumption – 13,253,429kL, a decrease 3.54% (486,381kL);average dwelling consumption (including houses, flats, and units)– 178kL/connection, a decrease of 4.3% (8kL);total industrial consumption – 914,705kL, a decrease of 3.9% (37,154kL);total commercial/municipal consumption – 4,112,489kL, an increase of 3.22% (128,451kL).Source: HWC (<strong>2011</strong>b)Figure 1: Water consumption for <strong>Lake</strong> <strong>Macquarie</strong> <strong>City</strong> (based on HWC water year20 April <strong>2010</strong> to 19 April <strong>2011</strong>)OEH Rainwater Tank RebatesFurther information on this rebate scheme is incorporated in Table 32 of the Energy chapter.
74<strong>City</strong> of <strong>Lake</strong> <strong>Macquarie</strong>- <strong>Annual</strong> <strong>Report</strong> <strong>2010</strong>/<strong>2011</strong>Freshwater Ecosystem HealthThe most significant indicator of freshwaterecosystem health is the amount of urbanisationwithin the catchment, with urban waterways havingmoderate to poor health.Aquatic pests, including Gambusia holbrooki(mosquito fish), carp, Salvinia, Senegal Tea, andAlligator weed, continue to spread and threatennative species. Widespread flooding (June 2007)has increased the risk of aquatic weeds spreading,particularly Alligator weed.Community Water Quality MonitoringAdopt-a-SQID and Waterwatch groups in <strong>Lake</strong><strong>Macquarie</strong> <strong>City</strong> are trained and use standardisedequipment, procedures, and methods to carry outwater quality monitoring for a number of parameters:water temperature, pH, total dissolved solids,electrical conductivity, turbidity, dissolved oxygen,and available phosphate. Only high school andcommunity groups test the latter two parameters,as chemicals are required. In <strong>2010</strong>/<strong>2011</strong>, groupsuploaded 371 data sets (Table 15). To date this hasprovided 2,238 sets of water quality data for the city.The results are available on the Waterwatch websitewww.waterwatch.org.au.Along with regular water monitoring, groups canregister and participate in biannual macroinvertebratesurveys and P Day (Phosphorus Awareness Day).Quality Assurance (QA) is an important aspect ofthe monitoring program. To maintain and provideevidence of accuracy and precision in monitoring,Waterwatch groups are encouraged to participatein QA trials in conjunction with Sydney WaterStreamwatch. The QA trials are designed to test thevalidity and accuracy of testing methods and comparethe results with National Association of TestingAuthorities (NATA) accredited laboratory results.In 2009, 12 groups in <strong>Lake</strong> <strong>Macquarie</strong> <strong>City</strong>participated in the QA trials. As in previous years,more than 88% of groups fell within the acceptablerange used by NATA accredited laboratories on allparameters tested. This level has been maintainedsince 2004 and indicates that “Waterwatch datais reliable and could be used with a high levelof confidence in identifying emerging issues incatchments and for environmental reporting” (SydneyWater 2007).<strong>Council</strong> continued to develop and implementeducation programs aimed at improving water quality,including participation in Water Week (October) andthe annual <strong>Lake</strong> <strong>Macquarie</strong> Catchment ConnectionsCarnival (held 3 June <strong>2011</strong>).Hunter-Central Rivers WaterwatchThe Waterwatch program involves people who wishto help improve the health of our waterways. Table 15details basic activity of local groups for <strong>2010</strong>/<strong>2011</strong>.For further information see the NSW Waterwatchwebsite www.waterwatch.org.au.Most Waterwatch groups are registered with either<strong>Council</strong>’s Adopt-a-SQID or Waterwatch in <strong>Lake</strong><strong>Macquarie</strong> (Estuary Watch) groups.Table 15: Hunter - Central Rivers Waterwatch Activity (<strong>Lake</strong> <strong>Macquarie</strong> <strong>City</strong>)<strong>2010</strong>/<strong>2011</strong>Registered groups 78Sites registered 168Data sets uploaded 371Active groups 38New groups trained and registered 11Waterwatch retraining sessions 3Source: HCRCMA (<strong>2011</strong>)
Our Performance 75Water Bug SurveysMacroinvertebrate (water bug) testing is one indicatorused to determine the health of a waterway. Eachspecies of water bug is sensitive to changes inwater quality, with some bugs being more sensitivethan others. The different species are identified andcounted to calculate a Stream Pollution Index (SPI).Waterwatch groups are able to participate in biannualsurveys. In the Spring (October <strong>2010</strong>) Water BugSurvey, five sets of data were collected. One dataset was collected for the Autumn (March <strong>2011</strong>)Water Bug Survey. The SPI is based on a weightingof the bug’s sensitivity to pollutants, the number ofdifferent species, and the number of individuals ofeach species present. The sites surveyed during<strong>2010</strong>/<strong>2011</strong> Spring and Autumn Water Bug Surveyswere not duplicated for each event.P Day - PhosphorusAwareness DayPhosphorus is a nutrient that occurs naturally inlow concentrations. Waterways with high availablephosphate (PO 4) levels from polluted run-offand treated wastewater contribute to increasedaquatic weeds and algae. Phosphorus awarenessis promoted by NSW Waterwatch each year inNovember as National P Day, with the theme ‘Keepyour P Out of the Creek’.For P Day <strong>2010</strong>, 11 groups (from Hunter-CentralRivers Waterwatch and <strong>Council</strong>) tested 31 sitesaround the city registering available phosphoruslevels within the following categories: two sites at veryhigh; nine high; 11 medium; and nine low. Seventyper cent of sites tested across <strong>Lake</strong> <strong>Macquarie</strong> <strong>City</strong>were above the trigger value of 0.6mg/L, this result issimilar to those obtained across the Hunter CentralRivers catchment area (68% above the trigger).Source: HCRCMA (<strong>2011</strong>)Figure 2: Phosphorus Awareness Week Results <strong>2010</strong> (Lower Hunter section)
76<strong>City</strong> of <strong>Lake</strong> <strong>Macquarie</strong>- <strong>Annual</strong> <strong>Report</strong> <strong>2010</strong>/<strong>2011</strong>Coasts and Estuaries<strong>Council</strong> continues to implement the <strong>Lake</strong> <strong>Macquarie</strong>Estuary Management Plan (LMCC 1997) and the<strong>Lake</strong> <strong>Macquarie</strong> Coastline Management Plan(LMCC 1999a). <strong>Council</strong> carried out on-ground worksin and around the estuary and in priority wetland andsaltmarsh areas to improve water quality, preventerosion, and improve biodiversity. These worksincluded on ground ecosystem enhancement worksprojects including:Foreshore Stabilisation and Littoral Zone Revegetation:Sunshine – Sunshine North – 150 metres (m);Sunshine - Casuarina Point - 45m; andWarners Bay – Warners Bay (North) – 460m.Wetland and Saltmarsh Rehabilitation:Belmont - Belmont Lagoon - 0.5ha;Bonnells Bay - Fullers Creek - 0.2ha;Brightwaters - <strong>Lake</strong> Petite - 1ha;Fassifern - Fennell Bay - 0.5ha;Pelican – Soldiers Road – 1.2ha;Marmong Point - Marmong Wetland - 2ha; andSwansea – Swansea Flats saltmarsh – 0.1ha.Dudley HeadlandRehabilitation of an area of <strong>Council</strong> owned bushlandat Dudley headland has continued. Environmentalweeds such as Bitou Bush have been controlled andremoved. Arrangements have been made to transferthis land to OEH for inclusion in the Glenrock SCA.Project Aware on the Coast<strong>Council</strong> supported a project to improve awarenessof the marine and coastal environment and itsbiodiversity. Refer to the Towards EnvironmentalSustainability chapter for further details on thisproject.Sea Level Rise Policy<strong>Council</strong> is implementing the NSW Sea Level RisePolicy Statement and its various planning, coastal,and flood guidelines to reduce the risk to humansettlements and the natural environment from risingsea and lake levels, estimated to increase by 0.9metres by 2100.<strong>Council</strong> has:assessed all new developments in areas vulnerableto rising sea levels using interim developmentassessment procedures for areas affected by sealevel rise;incorporated interim provisions for considering ofsea level rise in <strong>Council</strong>’s DCP No.1 for exhibitionin <strong>2011</strong>/2012;begun preparing comprehensive provisions forconsideration of sea level rise for inclusion in the<strong>Lake</strong> <strong>Macquarie</strong> LEP and DCP; andprepared a draft revision of the <strong>Lake</strong> <strong>Macquarie</strong>Flood Management Plan to include the effects ofsea level rise.<strong>Lake</strong> <strong>Macquarie</strong> <strong>City</strong> <strong>Council</strong> was named as oneof three national ‘Climate Change AdaptationChampions’ recognised at the National ClimateChange Adaptation Research Facility (NCCARF)National Conference, for their pioneering role inplanning for sea level rise.Review of the <strong>Lake</strong> <strong>Macquarie</strong> CoastalZone Management PlanThis plan was formerly called the <strong>Lake</strong> <strong>Macquarie</strong>Estuary and Coastline Management Plan. StateGovernment Guidelines to develop Coastal ZoneManagement Plans were released to provide <strong>Council</strong>with guidance for the revision of the <strong>Lake</strong> <strong>Macquarie</strong>Coastal Zone Management Plan. Coastal hazardand health assessments were undertaken in orderto feed into the review. <strong>Council</strong> completed the <strong>Lake</strong><strong>Macquarie</strong> Coastal Ecosystem Resilience Study andobtained information on coastal ecosystem condition,threats, opportunities, and sandy beach intertidalecology. Part A – <strong>Lake</strong> <strong>Macquarie</strong> Coastal ZoneManagement Plan is due for completion in July 2012.
Our Performance 77<strong>Lake</strong> <strong>Macquarie</strong> Estuary Ecosystem Response Model ProjectWith funding assistance from the NSW Government’s Estuary Management Program, <strong>Council</strong> is undertaking aproject to develop an Ecosystem Response Model for the <strong>Lake</strong> <strong>Macquarie</strong> Estuary. The development of the modelis being undertaken by OEH’s Coastal Catchments Unit, and involves several components:Catchment ModelThis involves modelling runoff quality and quantity from the sub catchments (Figure 3) that flow into<strong>Lake</strong> <strong>Macquarie</strong> to quantify catchment inputs (particularly nutrients and sediments) into the <strong>Lake</strong> <strong>Macquarie</strong>estuary. The development of this model has also involved a water monitoring program at various sites throughoutthe catchment (measuring water quality fortnightly and during rainfall events) to calibrate the model to localconditions.Figure 3: Catchment Model - <strong>Lake</strong> <strong>Macquarie</strong> sub-catchment boundaries and modelparametersHydro-Dynamic ModelDevelopment of a hydro-dynamic model (Figure 4) to describe water flows, including the influences of catchmentrunoff, tidal exchange, as well as wind generated waves and current.Figure 4: Basic grid architecture of hydro-dynamicmodel for <strong>Lake</strong> <strong>Macquarie</strong>
78<strong>City</strong> of <strong>Lake</strong> <strong>Macquarie</strong>- <strong>Annual</strong> <strong>Report</strong> <strong>2010</strong>/<strong>2011</strong>Ecosystem Response ModelOutputs of the catchment model and hydro-dynamic model will be combined with ecological information (includingfood-web analysis, a seagrass model, a benthic mirco-algae model, and a sediment re-suspension model) todescribe how water quantity and quality affects the ecology of <strong>Lake</strong> <strong>Macquarie</strong> (Figure 5).Source: OEH (<strong>2010</strong>)Figure 5: Basic food-web conceptual model for estuarine environmentsFollowing its completion in October <strong>2011</strong>, the project will:inform future estuary management planning (within the framework of the revision of the <strong>Lake</strong> <strong>Macquarie</strong> EstuaryManagement Plan);assist <strong>Council</strong> in determining relevant environmental criteria (such as water quality standards) for inclusion in itsrelevant planning controls (ie, LEP, DCP etc.);aid <strong>Council</strong> in making strategic planning decisions concerning landuse within the lake catchment;assist in quantifying water quality and aquatic ecology impacts associated with larger development proposals;provide a tool for prioritising environmental rehabilitation and water quality improvement works within thecatchment;inform future water quality and aquatic monitoring programs for <strong>Lake</strong> <strong>Macquarie</strong>; andprovide tools (such as conceptual models) to assist <strong>Council</strong> in its community education programs.StormwaterStormwater quality continues to be a major influenceon lake water quality, with around 80% of pollutantsentering the lake generated from non-point sources,such as urban runoff.There has been little change to the pressures onstormwater in the city during <strong>2010</strong>/<strong>2011</strong>. Theintroduction of BASIX to regional NSW, in 2005, hasled to many new homes installing a rainwater tankand has helped reduce the volume of stormwaterfrom new estates during small and mediumrainstorms. Continuing urbanisation of the catchment(see Land Use Changes section of the Land Chapter)is the main contributor to increased volumes ofstormwater, and increased levels of pollutants suchas nitrogen and phosphorus, discharging to <strong>Lake</strong><strong>Macquarie</strong>.
Our Performance 79Stormwater ManagementServices Activities<strong>Council</strong> does not administer an annual charge forstormwater management services.Stormwater Management PlanImplementationThe SMP was released in 1999 as a strategicframework for the sustainable management ofstormwater in the lake and coastal catchments. TheSMP contains a total of 93 actions across four mainstrategy areas. Significant achievements throughoutthe year are detailed below.On-Ground Works<strong>Council</strong> carried out the following works in thecatchment to improve water quality, prevent erosion,and improve biodiversity.SQIDs (approximate ha enhanced):Balmoral - Letchworth Parade (Gross PollutantTrap) (GPT) - 20ha;Booragul - Hayden Brook Road (GPT) - 80ha;Brightwaters - Kalaroo Road (GPT and vegetatedswale) - 3ha;Dudley - Ivy Street (GPT) - 5.5ha; andNords Wharf - Government Road - (2 x GPTs) -8.5ha.Streambank Stabilisation and Riparian VegetationImprovements:Cocked Hat Creek (three sites) – bed controlstructures;Barnsley - Cockle Bay – bank stabilisation; andGlendale - Winding Creek – bank stabilisation.Policy and PlanningThe implementation of <strong>Council</strong>’s water cyclemanagement requirements (included in DCP No. 1)has seen a greater emphasis on sustainablestormwater management outcomes for newdevelopments. <strong>Council</strong>’s stormwater managementcriteria for new developments include requirementsfor water sensitive drainage system design andon-site stormwater harvesting. The ongoingimplementation of <strong>Council</strong>’s Protection ofWatercourses and Drainage Lines Policy has resultedin the protection of numerous watercourses and theirassociated riparian vegetation.Wherever possible, <strong>Council</strong> seeks to support anintegrated water cycle management approachwhere stormwater is considered a resource firstand a waste to be treated second. A number ofoptions are being investigated to ascertain whetherstormwater harvesting and irrigation reuse is possibleat previously constructed wetlands, as well as someplanned wetlands, with the possibility of attractingexternal grant funds to facilitate their design andconstruction.Together with HWC, <strong>Council</strong> is also exploringopportunities in new development areas for dualreticulation schemes to use treated sewage andstormwater for non-potable domestic use.Maintenance, monitoring, and researchThe maintenance of stormwater assets, such asSQIDs, is important to ensure the effectiveness ofthese structures. Maintenance of these devices istypically carried out quarterly.<strong>Council</strong>’s SMP recommends ongoing monitoringof stormwater quality throughout the city, which isconducted via the Adopt-a-SQID and Waterwatchprograms (see Freshwater Ecosystem Health sectionfor further information). <strong>Council</strong> also undertakesmonitoring of recreational swimming areas.Given the relationship between stormwater qualityand water quality in <strong>Lake</strong> <strong>Macquarie</strong>, evaluating theeffectiveness of stormwater management responsescan be demonstrated by water quality in the lake,which is generally improving (see Coasts andEstuaries section for further information).Waterwatch and Adopt-a-SQID groups provide abasic but accurate measure of some key water qualityparameters. The data generated by these groupsgenerally indicate water quality and ecosystem healthin urban streams is poor to moderate. A programis currently underway to combine these data withoutputs of the <strong>Lake</strong> <strong>Macquarie</strong> Ecosystem ResponseModel to develop water quality scorecards for variouscatchments across the city.
80<strong>City</strong> of <strong>Lake</strong> <strong>Macquarie</strong>- <strong>Annual</strong> <strong>Report</strong> <strong>2010</strong>/<strong>2011</strong>biodiversity AT A GLANCETerrestrial and Freshwater EcosystemsSTATEDecliningPRESSUREIncreasingRESPONSEFairThe indicators used in this report suggest that biodiversity is still in a state of decline, both due to deterioration inquality caused by weeds and invasive pests, and through bushland clearing.Pressures on biodiversity are increasing because of population growth, road construction, rural and urbandevelopment, mining, quarrying, climate change, fragmentation of remnant vegetation, altered fire regimes, loss ofhabitat, and introduced species.<strong>Council</strong>:• continued to work on a new citywide strategy (a review of LS 2020), draft LMLEP <strong>2011</strong> and DCP;• worked with regional organisations to improve our understanding of biodiversity and encourage biodiversityretention on private land;• worked locally to manage weeds;• supported rehabilitation works both directly and indirectly through Landcare; and• commenced work on a biodiversity offsets policy.Marine/Estuarine EcosystemsSTATEUnknown/StablePRESSUREIncreasingRESPONSEGoodThe extent and condition of marine and estuarine biodiversity is unknown. However, indicators used in this reportsuggest that the condition of these ecosystems may be stable to improving, except for the extent of saltmarsh andsome species of seagrass. There are currently no marine reserves in the city.Pressures on biodiversity are increasing due to development, higher recreational pressure, and climate change.<strong>Council</strong>:• supported the <strong>Lake</strong> <strong>Macquarie</strong> Estuary and Coastal Management Committee;• improved the condition of the coast and estuary via an on ground works program and assessment of the impactsof climate change;• undertook the following studies, Managing the Ecological Resilience of the <strong>Lake</strong> <strong>Macquarie</strong> Coast (<strong>2010</strong>), <strong>Lake</strong><strong>Macquarie</strong> Wetlands Climate Change Assessment (<strong>2010</strong>), <strong>Lake</strong> <strong>Macquarie</strong> Adaptive Response of EstuarineShores to Sea Level Rise (<strong>2010</strong>) and eShorance: Estuarine Shoreline Response to Sea Level Rise (<strong>2010</strong>); and• is undertaking Ecological Response Modelling for the lake.Biodiversity
Our Performance 81ENVIRONMENTAL INDICATORSTerrestrial and Freshwater EcosystemsNumber of introduced speciesANNUAL LEVEL<strong>2010</strong>/<strong>2011</strong>CURRENTTRENDNoxious weeds*Environmental weedsFauna9015928(NSW) Threatened Species Conservation Act 1995 (TSC Act) (includes marine mammals and turtles that occur withinthe LGA boundary)Number of additional species listings, under the TSC Act 01 upgrade fromendangered to criticallyendangeredNumber of critically endangered species recorded 2Number of endangered species recorded 20Number of vulnerable species recorded 76Number of endangered populations recorded 1Number of endangered ecological communities recorded 13Number of state vulnerable ecological communities recorded 1Number of key threatening processes 31Total number of state threatened species recorded 98Number of state threatened species that could occur 117(Federal) Environment Protection and Biodiversity Conservation Act 1999 (EPBC Act)Number of additional listings under the EPBC Act 0Number of national threatened species recorded (excluding fish) 31Number of national threatened species that could occur (excluding fish) 39Number of nationally listed critically endangered vegetation communities 1Number of federal key threatening processes 13Number of nationally listed migratory species(includes marine and estuarine species)113Area of Native VegetationArea of native vegetation38,025haPercentage of land area covered by native vegetation 59.1%Rate of clearing native vegetation (bushland to cleared)56ha/yr* All noxious weeds are currently under State Government review – a list of noxious weeds and <strong>Lake</strong> <strong>Macquarie</strong> <strong>City</strong> <strong>Council</strong>’s noxiousweed control plans are available on www.lakemac.com.au.
82<strong>City</strong> of <strong>Lake</strong> <strong>Macquarie</strong>- <strong>Annual</strong> <strong>Report</strong> <strong>2010</strong>/<strong>2011</strong>ENVIRONMENTAL INDICATORSMarine/Estuarine Ecosystems(NSW) Fisheries Management Act 1994 (FM Act)ANNUAL LEVEL<strong>2010</strong>/<strong>2011</strong>CURRENTTRENDAdditional species listings under the FM Act 0Number of species presumed extinct (potentially occurring, one recorded) 1Number of critically endangered species recorded 1Number of endangered species recorded 0Number of vulnerable species recorded 1Number of endangered populations recorded 1Number of key threatening processes 8Area of seagrass coverage in <strong>Lake</strong> <strong>Macquarie</strong> - seven bays (no new data)12.65km²
Our Performance 83Terrestrial and Freshwater EcosystemsExtent of remnant vegetation<strong>Council</strong> completed mapping the area supporting native vegetation in the city from <strong>2010</strong> aerial photography. Thismap includes three categories: bushland, partially cleared (or bushland disturbed by other than natural means),and cleared land. The map is available on www.lakemac.com.au.Table 16 indicates the area of land in the city that is cleared, partially cleared, or covered in native vegetation. Mostimportantly, Table 16 shows there has been a decrease of 296ha of native vegetation cover over a period of 38months (between January 2007 and March <strong>2010</strong>).Table 16: Area of Land Cleared or Covered in Native Vegetation in 2007 and <strong>2010</strong>January 2007 March <strong>2010</strong>Area (ha) (%) of total land area Area (ha) (%) of total land areaCleared (including dams) 20,529 31.9 20,929 32.5Partially cleared (including pine forest) 5,454 8.5 5,350 8.3Remnant vegetation 38,321 59.6 38, 025 59.1Total 64,304 100 64,304 100*Total land area = LGA (75,782ha) - creeks and water (409ha) - <strong>Lake</strong> (11,069ha)Area reservedThe area reserved as National Park Estate in <strong>2010</strong>/<strong>2011</strong> is 7,999ha (Table 17). This figure includes the land handedover to OEH as a result of the Rosecorp development proposal at Catherine Hill Bay.Table 17: Area reserved (<strong>2010</strong>/<strong>2011</strong>)TenureArea (ha)% of landin the city *% of remainingbushland in the city **Belmont State Park # 525 0.8 1.4State Forest 5,072 7.9 13.3State Forest Reserves where timber removal is prohibited Figure unavailable Figure unavailable Figure unavailableNational Park Estate 7,999 12.4 21<strong>Council</strong> owned bushland 1,487 2.3 3.9<strong>Council</strong> owned partially cleared land 369 0.6 6.9 (% of remainingpartially cleared land)Crown owned bushland 4,888 7.6 12.9Crown owned partially cleared land 384 0.6 7.2 (% of remainingpartially cleared land)#All but around 200ha of the Belmont State Park is highly disturbed – this park contains both Crown and <strong>Council</strong> land.* Total area of land in the city is 64,304ha.** Total area of bushland in the city is 38,025ha, total area of partially cleared land in the city is 5,350ha.
84<strong>City</strong> of <strong>Lake</strong> <strong>Macquarie</strong>- <strong>Annual</strong> <strong>Report</strong> <strong>2010</strong>/<strong>2011</strong>During <strong>2010</strong>/<strong>2011</strong>, there was no substantial changein the area of Crown and <strong>Council</strong>-owned bushlandand partially cleared land.Bushland managed for biodiversity values include:National Park; State Forest Reserves that cannot belogged (figures unavailable this year); and <strong>Council</strong>owned bushland. National Park Estate and <strong>Council</strong>ownedbushland totals 9,486ha, or 25% of remainingcitywide bushland, in these land tenure categories.<strong>Council</strong> owned bushland makes up 3.9% of the city’sremaining bushland.The Crown owns a further 4,888ha or 12.9% ofbushland in the city. This tenure is less secure fora number of reasons such as mining leases, urbandevelopment, and Aboriginal land claims.A significant proportion, 48.9% of remnant bushlandis held in private tenure with biodiversity protectionlimited to landuse zones. In the main, landuse zonesdo not ensure management for biodiversity values.Regional significant vegetationThe list of regionally significant vegetationcommunities in the city has been adjusted inaccordance with the <strong>Lake</strong> <strong>Macquarie</strong> <strong>City</strong> <strong>Council</strong>Working Draft Composite Vegetation Community Map(Bell and Driscoll <strong>2010</strong>), the current list is available onwww.lakemac.com.au.Other significant vegetationThere has been no change in the species ofsignificance listed as Rare or Threatened AustralianPlants (ROTAP) (Briggs and Leigh 1995, or in Benson1986). There were no additional new or specialspecies recorded during the reporting period.Fauna recordsExtensive updating this year added many newrecords to <strong>Council</strong>’s fauna database. The databaseindicates that 559 different species of native fauna(excluding fish and insects) have been recorded in thecity. Of these, 528 are unique identified species and31 are species not fully identified (e.g. unidentifiedmacropod species).This consists of 348 (plus seven unidentified) speciesof birds, 80 (plus 19 unidentified) species of mammals(including bats), 60 (plus three unidentified) speciesof reptiles, and 40 (plus two unidentified) speciesof amphibians. In addition, 17 species of nativefreshwater fish have been recorded (LMCC 1999b),one exotic freshwater fish species, Mosquito Fish.Marine fish and mammals observed in <strong>Lake</strong> <strong>Macquarie</strong><strong>City</strong> include the threatened Grey Nurse Shark andHumpback Whale (off the coast of <strong>Lake</strong> <strong>Macquarie</strong>),the Manta Ray, and the Hammerhead Shark. TheHumpback Whale has been recorded in coastalwaters adjacent to the city but not within the LGAboundary.Species of national significanceA list of the marine and migratory species likely tooccur in the city or offshore of the city is available onwww.lakemac.com.au. These include nationallythreatened species, which are likely to occur or havebeen recorded in the city (Table 18).Table 18: Nationally Threatened Species recorded or likely to occurGroupsNumber of National ThreatenedSpecies RecordedNumber of National ThreatenedSpecies Likely to Occur2008/2009 2009/<strong>2010</strong> <strong>2010</strong>/<strong>2011</strong> 2008/2009 2009/<strong>2010</strong> <strong>2010</strong>/<strong>2011</strong>Fish 1 1 2 1 1 2Amphibians 5 5 5 5 5 5Reptiles 3 3 2 4 4 4Birds 4 4 7 8 8 10Mammals 3 3 3 3 3 3Plants 14 14 14 17 17 17Total 31 31 33 38 38 41Note: Figures do not include marine mammals or continental shelf species.
86<strong>City</strong> of <strong>Lake</strong> <strong>Macquarie</strong>- <strong>Annual</strong> <strong>Report</strong> <strong>2010</strong>/<strong>2011</strong>Rate of clearingTables 20 and 21 contain data on clearing of native vegetation.Table 20: Area cleared between landsat and air photographic periodsInterval covered (determined by date oflandsat/air photos)Interval (years)Bushland toClearedAmount cleared (ha)Bushland toPartially ClearedPartially Clearedto ClearedOct 2001 to Aug 2004 2.83 1,042 1,075 562Aug 2004 to Jan 2007 2.42 144 500 177Jan 2007 to Mar <strong>2010</strong> 3.17 176 74 302Table 21: Rate of clearing between landsat and air photographic periodsAmount cleared (ha)Interval covered (determined by dateof air photos)Interval (years)Bushland toClearedBushland toPartially ClearedPartially Clearedto ClearedOct 2001 to Aug 2004 2.83 368 380 199Aug 2004 to Jan 2007 2.42 60 207 73Jan 2007 to Mar <strong>2010</strong> 3.17 56 23 95Table 21 shows the average rate of clearing of bushland to cleared between 2001 and 2004 was 368ha/year. Thisslowed to 60ha between 2004 and 2007, and has remained stable, at 56ha/year between 2007 and <strong>2010</strong>. Figure6 illustrates changes in the rate of clearing in all three categories. The reason for the slow down in the clearing rateover the years 2004 to <strong>2010</strong> is most likely to be a reduction in urban development and lack of major infrastructureprojects.Bushland to clearedBushland to partially clearedPartially cleared to clearedFigure 6: Average rate of land clearing October 2001 to March <strong>2010</strong>(excluding photo interpretation)
Our Performance 87A decrease in forestry (within <strong>Lake</strong> <strong>Macquarie</strong> <strong>City</strong>) between 2007 and <strong>2010</strong> is the likely reason for the markeddecrease in clearing from bushland to partially cleared when compared to the 2004 to 2007 period.The following land uses (in descending order) were the major contributors to clearing (Table 22):Bushland to cleared land – urban development (44ha), power generation (32ha), mining (25ha), roads/tracks(25ha), rural (17ha), and powerline maintenance (14ha);Bushland to partially cleared land – rural (30ha) and mining (42ha); andPartially cleared to cleared – powerline maintenance (171ha), urban development (50ha), rural (32ha), mining(13ha), and industry (13ha).There was 69ha of regrowth and an additional 16ha of regrowth under powerlines. The 16ha of regrowth underpowerlines must be regarded as temporary regrowth as it is subject to regular maintenance.The main areas of regrowth/revegetation were at Rhondda and Newstan Collieries, on the sand dunes behindBlacksmiths Beach, and a revegetation project associated with urban development at Cameron Park. It shouldalso be noted that areas of regrowth move only from the cleared to the partially cleared category. Such areas arenot replacing bushland that has been cleared as this will take in the order of decades to occur.<strong>Council</strong>, HCRCMA, and the NSW Department of Planning approve the clearing of native vegetation. The total areaof clearing by all authorities over the reporting period is unknown.Table 22: Reasons for Clearing/Regrowth (2007-<strong>2010</strong>)Adjustments Loss (ha) Loss (ha) Loss (ha) Gain (ha) Gain (ha) Gain (ha) Loss (ha) Gain (ha)No changein statusBushland toclearedBushlandto partiallyclearedPartiallycleared toclearedClearedto partiallyclearedPartiallycleared tobushlandCleared tobushland Total losses Total gainsPowerline maintenance 14.21 6.85 171.24 192.3 0Urban clearing 44.13 22.64 50.84 117.61 0Rural clearing 16.5 30.19 31.62 78.31 0Mapping differences(photo interpretation)2.01 14.46 37.10 16.85 38.45 10.18 2.19 68.41 50.82Power generation 32.12 2.61 9.31 44.04 0Mining 25.12 0.84 13.12 39.08 0Roads/tracks 25.22 2.82 3.37 31.41 0Unknown 3.4 7.46 4.13 14.99 0Industry 1.52 0.30 12.90 14.72 0Colongra Gas Pipeline 8.13 0.23 8.36 0Eraring Ash Dam 3.97 0.62 4.59 0Harvest of Pine Forest 3.89 3.89 0Sand movement (coast) 1.43 0.40 1.83 0New dam 0.14 0.59 0.73 0Water level fluctuations 0.33 0.33 0Forestry 0 0Regrowth 68.58 0.29 0 68.87Regrowth underpowerlinesTotal (excluding photointerpretation)15.85 0.93 0 16.780 176.12 73.94 302.35 84.44 1.22 0 550.9 85.65% photo interpretation # 100 7.59 33.41 5.28 31.29 89.3 100 12.42 59.33# Photo interpretation refers to errors or differences in the data due to shadows, blurring and misalignment of aerial photography or different interpretationsby people undertaking the mapping.
88<strong>City</strong> of <strong>Lake</strong> <strong>Macquarie</strong>- <strong>Annual</strong> <strong>Report</strong> <strong>2010</strong>/<strong>2011</strong>Fragmentation and corridorsClearing of native vegetation continues to create new fragments, increase gaps between fragments, and reducethe size of existing fragments. Based on the latest Native Vegetation and Corridor mapping, the loss of nativevegetation corridors between 2007 and <strong>2010</strong> was mainly due to clearing for urban development, infrastructure,powerline easement maintenance, and mining.In 2009, to supply the Delta Electricity Gas Fired Power Station, a significant north-south corridor wascompromised by the construction of approximately 2km of gas pipeline along the southern boundary of <strong>Lake</strong><strong>Macquarie</strong> <strong>City</strong>.A significant patch of high quality bushland at Awaba was fragmented by the construction of the Centennial CoalHaul Road. In an attempt to mitigate this impact, fauna overpasses and underpasses were included as part of theroad construction.Loss of wetland vegetationIt is anticipated that the loss of wetland vegetation has continued incrementally over the reporting period. Whilstno new data have been collected, several instances of unauthorised clearing were previously reported and edgeeffects (filling and clearing small areas of wetlands) continue.Table 23 shows the results of a project (commissioned by <strong>Council</strong>) that investigated the likely loss of wetlandvegetation as a result of predicted sea level rise. A significant decline in area covered by many wetland vegetationcommunities is predicted. This project also identified possible retreat areas for some of these vegetationcommunities, however the ability of these ecosystems to migrate or colonise these new areas is unknown.Table 23: Area of Wetland Vegetation Communities Inundated by Future Sea Level RiseWetland TypeArea inundatedat 45cm SLR (ha)45cm inundatedarea (%)Area inundatedat 90cm (ha)Area inundatedat 90cm (%)Swamp Mahogany-Paperbark Forest 38 3% 142 16%Swamp Oak Rushland Forest 107 2% 223 71%Phagmities Rushland 3 16% 11 56%Swamp Oak Sedge Forest 1 2% 3 6%Riparian Melaleuca Swamp Woodland 11 4% 33 6%Riparian Melaleuca Swamp Woodland (Melaleuca Scrub) 0 34% 1 4%Wyong Paperbark Swamp Forest 5 6% 11 15%Wyong Paperbark Swamp Forest (Melaleuca Scrub) 2 8% 9 34%Coastal Wet Sand Cyperoid Heath 2 1% 5 4%Lepironia Swamps 0 25% 0 0%Freshwater Wetland Complex 28 0% 41 37%Mangrove-Estuarine Complex 114 71% 139 87%Saltmarsh 35 48% 66 90%Total all wetlands combined 346 14% 683 28%Source: Ecological (<strong>2010</strong>)
Our Performance 89Introduced speciesNoxious weedsNoxious weeds are now defined as either Class 1,2, 3, 4, or 5, and each class of weed has its ownset of control measures.<strong>Council</strong> has prepared local weed control plans asa tool to manage local (Class 4) noxious weeds -these plans outline how to control noxious weeds,should they exist on public or private land.Further detail for the above, local weed control plans,and a full list of noxious weeds are available onwww.lakemac.com.au.Environmental weedsIn addition to noxious weeds, there are many weedsknown as ‘bush enemies’ that colonise remnantnatural areas degrading natural ecosystems. A listof 159 environmental weeds that occur in the city isavailable on www.lakemac.com.au. There has beenno change to this list during <strong>2010</strong>/<strong>2011</strong>.Introduced faunaAt least 25 species of introduced fauna are known tooccur in the city. A detailed list of introduced fauna isavailable on www.lakemac.com.au.Due to an increase in community concern, <strong>Council</strong>has prepared a website article on the management ofIndian Myna birds, available on www.lakemac.com.au.Key Threatening Processes relating to feral specieslisted under the TSC Act cover feral rabbits, feralbees, feral pigs, Mosquito Fish, feral cats, EuropeanRed Fox, feral deer, feral dogs, and the Cane Toad.Other pressures on biodiversityOther pressures are documented in detail inthe 2008/2009 report and include: fire regimes;unsustainable use of resources; pollution; changes inhydrology; habitat destruction; and climate change.Bell Miner associated diebackA research grant project on the correlationbetween Bell Miners (a native honeyeater Manorinamelanophrys) and the die back of eucalypt trees wascompleted (Haythorpe 2008). The factsheet for thisproject is available on www.lakemac.com.au. Thisproject found evidence to support the assumptionthat Bell Miners only remove the lerp and leavebehind the psyllid nymph more frequently than otherlerp feeding birds such as Noisy Miners (Manorinamelanocephala). The psyllids left by Bell Miners werealso able to regrow their lerp casing with greaterfrequency and within as little as 20 hours, althoughthere was around a 30% loss of psyllids that werepreyed upon.This project has been an important step in themanagement of Bell Minor associated dieback,indicating that measures to address psyllidinfestations need to focus on the factors that renderthe trees susceptible to psyllids in the first instance.These include: fungal infections (phytophthora),logging, altered fire regimes, weed invasion, alteredhydrological regimes, drought, flooding, extremeweather, grazing, monoculture planting, and otherdisturbances.
90<strong>City</strong> of <strong>Lake</strong> <strong>Macquarie</strong>- <strong>Annual</strong> <strong>Report</strong> <strong>2010</strong>/<strong>2011</strong>Marine / Estuarine EcosystemsMacroalgaeSurveys of macroalgae at seven locations within the lake were conducted during three seasonal periods includingsummer <strong>2010</strong>/<strong>2011</strong>, and autumn and winter <strong>2011</strong> (Figure 7). Sampling carried out in <strong>2010</strong>/<strong>2011</strong> indicatedmacroalgae biomass for this period has the lowest average seasonal macroalgae biomass since autumn 2006.Macroalgae biomass (g/m)<strong>Annual</strong> sampling periodsand averagesSource: Clearwater Ecological (<strong>2011</strong>)Figure 7: Average seasonal (and annual) macroalgae biomass (g/m 2 ) recorded at sevensampling bays observed between autumn 2006 and winter <strong>2011</strong>Monitoring results indicate the greatest reduction in biomass has occurred at Chain Valley Bay and Edmunds Bay(Figure 8). The majority of macroalgae occurred in Edmunds and Chain Valley Bay comprising 34.6 and 33.2%respectively of the biomass sampled in all bays. Lower proportions occurred in Bonnells Bay (18%) and FennellBay (14.2%). Low or no macroalgae biomass was collected from Warners, Belmont, and Crangan bays.Macroalgae biomass (g/m)Source: Clearwater Ecological (<strong>2011</strong>)Figure 8: Average annual and seasonal macroalgae biomass (g/m 2 ) at each of the sevensampling bays during the <strong>2010</strong>/<strong>2011</strong> annual survey
92<strong>City</strong> of <strong>Lake</strong> <strong>Macquarie</strong>- <strong>Annual</strong> <strong>Report</strong> <strong>2010</strong>/<strong>2011</strong>Table 25 shows increases in the extent of all species between 2000 and 2004 but marked decrease in the area ofHalophila ovalis, Ruppia megacarpa, and Posidonia australis between 2004 and 2009. Table 25 shows also therewas a smaller decrease in the area of Halophila ovalis, Ruppia megacarpa between 2000 to 2009, and Posidoniaaustralis increased in area over this longer period of time.The significant natural variability of seagrass and the decline of the two rarer species (Ruppia megacarpa andPosidonia australis) warrants further investigation.Table 25: Area of seagrass for seven bays in <strong>Lake</strong> <strong>Macquarie</strong> (2000-2009)SpeciesArea (ha)Feb 2000Area (ha)Feb 2004Area (ha)Feb 2005Area (ha)Feb 2006Area (ha)Feb 2007Area (ha)Feb 2009Differencebetween 2000and 2009 (ha)Differencebetween 2000and 2009 (%)Zostera capricorni 636.1 736.2 814.0 897.7 957.6 871.9 235.8 37.1Halophila ovalis 281.8 419.1 275.2 401.8 385.4 253.6 -28.2 10.0Ruppia megacarpa 30.9 92.3 63.4 40.6 14.1 22.0 -8.9 28.7Posidonia australis 76.5 131.4 113.6 109.0 115.5 117.5 40.9 53.5Total area (ha) 1,025.3 1,379.0 1,266.2 1,449.1 1,472.6 1,265.0 239.7 23.4Source: LMCC (2009)Source: Clearwater Ecological (2009)Figure 9: Improvements in combinedspecies of seagrass coverage forseven bays in <strong>Lake</strong> <strong>Macquarie</strong>2000 - 2009Sea turtlesFour species of turtle have been recorded in <strong>Lake</strong> <strong>Macquarie</strong>: Green turtle; Loggerhead turtle; Hawksbillturtle (recorded at Glenrock); and Flatback turtle. All four turtle species in <strong>Lake</strong> <strong>Macquarie</strong> are listed on theCommonwealth threatened species lists. The Green and Loggerhead turtles are also listed under State legislation(Table 26). The Green turtle is the most commonly recorded species in the lake.The Leatherback turtle was reported as occurring in <strong>Lake</strong> <strong>Macquarie</strong> in the 2009 State of the Environment <strong>Report</strong>.This record was a reporting error. There are no confirmed records of the Leatherback Turtle in <strong>Lake</strong> <strong>Macquarie</strong>.No new data have been collated on sea turtles during the reporting period. However, <strong>Council</strong> has awarded a <strong>Lake</strong><strong>Macquarie</strong> Research Grant for a project to conduct satellite tracking of sea turtles.Table 26: Turtles listed under State and Federal LegislationSpecies TSC Act (State) EPBC Act (Commonwealth)Green turtle Vulnerable VulnerableLoggerhead turtle Endangered EndangeredHawksbill turtleFlatback turtleVulnerableVulnerable
Our Performance 93Endangered shorebirds - Little Tern andPied OystercatcherLittle Terns resumed breeding behaviour in the city in<strong>2010</strong>/<strong>2011</strong>. It is 40 years since they were reportedbreeding here. These birds nest just above the tideline on sandy beaches and are easily disturbed byhuman activities and dogs.<strong>Council</strong> in conjunction with OEH – National Parksand Wildlife Service, NSW Maritime, <strong>Lake</strong> <strong>Macquarie</strong>Landcare, HBOC, Land and Property ManagementAuthority, and the Bahtabah Land <strong>Council</strong> initiatedan education program and implemented measuresto protect the nesting habitat of the Little Tern andother endangered shorebirds. Fences and signs wereinstalled at the Marks Point sandspit (an island ofSwan Bay).Species of state and national significance– Threatened species and processesTables 18 and 19 show the number of threatenedfish species listed under Commonwealth and Statelegislation that have been recorded in the city.A full list of these species is available onwww.lakemac.com.au.A list of species covered by the EPBC Act is availableon www.lakemac.com.au. This includes marineand migratory species (covered by internationalagreements), as well as nationally threatened speciesand cetaceans (dolphins and whales), that are likelyto occur in the city or offshore of the city.LitterLitter in the marine and estuarine environment hasa significant adverse impact on fauna causing injuryand fatalities. Anthropogenic debris in marine andestuarine environments has been listed as a KeyThreatening Process under the TSC Act.Introduced marine speciesThe NSW Department of Primary Industries (DPI) hasan ongoing monitoring and research program forCaulerpa taxifolia (a seaweed) in NSW. Survey workby DPI indicates that Caulerpa taxifolia is still absent.Razor Fish/ClamsA research grant project on Razor Fish (Pinna bicolor)in <strong>Lake</strong> <strong>Macquarie</strong> was completed (Burns <strong>2010</strong>).The fact sheet for this project is available onwww.lakemac.com.au. This project found thatRazor Fish display high levels of growth reachinglengths of 200mm within one year. It is long-lived,up to 18 years, and relies on sporadic recruitment tomaintain population. Large filter feeding bivalves suchas Razor Fish often play an essential role in improvingwater clarity though filtration and provide essentialnutrients for flora through biodeposition. They play anintegral role in the food-web interactions of the lake.Pressure on biodiversity fromclimate changeThe impacts of climate change on biodiversity areunquantified and complex. They are interrelated andexacerbated by the other pressures on biodiversitye.g. the level of clearing of native vegetation within thecity and invasive species.Climate change, in particular sea level rise, coastalrecession, ocean warming, and increased freshwaterinflows and sediment delivery, will have a significantimpact on marine and estuarine ecosystems.Mangrove, saltmarsh, and other intertidal habitatsand ecosystems (such as rocky shores, sandybeaches, and mud flats) will be particularly affected.As with terrestrial and aquatic ecosystems, differingtemperatures and loss of habitat may affect migratorypatterns and lifecycles of certain species. Thelandward migration of intertidal habitats will occur,however in many areas where development is closeto the coast or foreshore, this will not be possible.Climate change is expected to increase thesouthward flow of the East Australian Current, raisingsea temperatures. This is likely to increase thefrequency of algal blooms and cause a southwardshift in the natural range of many species. Forexample, a southward shift of many subtropicalspecies, a decrease in zooplankton, and an increasein jellyfish is expected (Edwards 2008).
94<strong>City</strong> of <strong>Lake</strong> <strong>Macquarie</strong>- <strong>Annual</strong> <strong>Report</strong> <strong>2010</strong>/<strong>2011</strong>environmental healthAT A GLANCEAir PollutionSTATEInformationlimitedPRESSUREIncreasingRESPONSEFairNo public air quality monitoring occurs in <strong>Lake</strong> <strong>Macquarie</strong> <strong>City</strong>.The Lower Hunter Regional Air Quality Monitoring Network, operated by OEH, measures concentrations of particulatematter, oxides of nitrogen (NO X), sulfur dioxide (SO 2), carbon monoxide, lead, and ozone. OEH identifies particulatematter and ozone as air pollutants of major concern in the Lower Hunter. Wallsend is the OEH monitoring site closestto <strong>Lake</strong> <strong>Macquarie</strong> <strong>City</strong>. Particulate matter levels improved in the reporting period, due to fewer dust storms (Figure 10).Coal-fired electricity generation is the major source of air pollution in <strong>Lake</strong> <strong>Macquarie</strong> <strong>City</strong> (Table 28). Minor sourcesinclude coal mining, quarrying, motor vehicle emissions, and food manufacturing (Table 27).Changes in power station emissions, in reporting years 2009/<strong>2010</strong> to 2008/2009, most likely indicate variations inoperating capacity and emission control (Table 28). Upgrade to Eraring Power Station continues and will increasecapacity, improve efficiency, and reduce emissions per unit of output. Improved controls include low NO Xburners, dryash management, and fabric filters. However, overall SO 2emissions may increase.Population growth and associated increase in motor vehicle use may increase local levels of particulate matter andNO X. The increase in the total number of registered motor vehicles remains steady, at approximately 2% per year.Lack of adequate public transport directly contributes to increased congestion on public roads, and associatedemissions to the atmosphere.<strong>Council</strong> registers and investigates air pollution incidents. <strong>Council</strong> continues initiatives to minimise motor vehicle use.<strong>Council</strong> plans to model the dispersion of air pollution across the city and compare predicted concentrations withnational health goals, as well as predict air impacts associated with climate change.Air Pollution (odour specific)STATEGoodPRESSUREIncreasingRESPONSEFairOdour issues occur in a small number of local ‘hot spots’. Specific concerns include rubbish accumulation and thekeeping of animals.Odour-related issues increased slightly.<strong>Council</strong> responds to localised odour complaints.EnvironmentalHealth
Our Performance 95Noise PollutionSTATEGoodPRESSUREIncreasingRESPONSEFairNoise complaints increased slightly. Residential noise, particularly barking dogs, remains the main concern.Noise pressures are expected to increase with population and development.<strong>Council</strong> registers and investigates a range of noise complaints and considers noise issues as part of the developmentassessment process.ENVIRONMENTAL INDICATORSAir pollution (general)Complaints received by <strong>Council</strong> in relation to discharge of smoke, dust, andother fugitive emissionsOEH received:Information (ie. telephone calls) regarding air pollution in <strong>Lake</strong> <strong>Macquarie</strong> <strong>City</strong><strong>Report</strong>s of air pollution incidents in <strong>Lake</strong> <strong>Macquarie</strong> <strong>City</strong>Construction of shared pathways and cycle-safe shouldersRoad sealing (gravel roads sealed)Number of vehicles registered in <strong>Lake</strong> <strong>Macquarie</strong> <strong>City</strong>Air pollution (odour specific)Odour specific complaints received in relation to industrial and agriculturalactivities, sewage, or the keeping of animalsNoise pollution<strong>Council</strong>:Number of noise complaints received by <strong>Council</strong>Complaints relating to barking dogsOEH received:Requests for information about noise pollution<strong>Report</strong>s of noise pollution incidentsANNUAL LEVEL<strong>2010</strong>/<strong>2011</strong>5442*137**6km2.6km173,77112062048533*26CURRENTTREND* OEH Environment Line received 30,495 calls requiring information about the environment, including air, noise, waste, and water, during <strong>2010</strong>/<strong>2011</strong>, 43%of these calls were assigned to specific council areas, of which 42 originated from <strong>Lake</strong> <strong>Macquarie</strong> <strong>City</strong> (OEH <strong>2011</strong>d).** This figure remains unchanged from the previous financial year. Approximately 70% of reported air pollution incidents continued to come from twopremises: Australian Native Landscapes, Cooranbong – 56 reports, and Yates/Orica Fertiliser Plant, Wyee – 48 reports. Responsibility for regulating thesepremises lies with OEH, under the NSW PoEO Act.
96<strong>City</strong> of <strong>Lake</strong> <strong>Macquarie</strong>- <strong>Annual</strong> <strong>Report</strong> <strong>2010</strong>/<strong>2011</strong>Air QualityRegional air pollution monitoringImproved regional air quality resulted from fewer dust storms. Wallsend recorded 15 exceedences of the nationalhealth goal for particulate matter during <strong>2010</strong>/<strong>2011</strong> (Figure 10), compared with 48 exceedences recorded in2009/<strong>2010</strong>.Source: OEH (<strong>2011</strong>f)Note: PM 10refers to atmosphericparticulate matter with diameters lessthan 10 micrometres. The World HealthOrganisation acknowledges that, althoughthe concept of an effect thresholdunderlies current air quality standards, nosuch threshold is evident for particulatematter and ozone (WHO Europe 2004:9).Figure 10: Daily maximum concentrations of particulate matter, Wallsend, 2009/<strong>2010</strong>and <strong>2010</strong>/<strong>2011</strong>Sources and emission of air pollutantsFigure 11 shows emissions of major air pollutants in <strong>Lake</strong> <strong>Macquarie</strong> <strong>City</strong>, compared to selected local governmentareas. <strong>Lake</strong> <strong>Macquarie</strong> ranks fourth highest in NSW, after Wollongong, Lithgow, and Muswellbrook (OEH 2003).Page 52Source: OEH (2003)Note: OEH 2003 data, accessed <strong>2011</strong>.OEH 2008 data release expected early2012.Figure 11: Comparison of air emissions - local government areas
Our Performance 97Table 27 illustrates that electricity generation contributes the majority of air emissions in the city (OEH, 2003).Table 28 show recent variations in power station emissions.Table 27: Highest ranking air pollutant emission sources in <strong>Lake</strong> <strong>Macquarie</strong>Particulate Matter (PM 10) Emissions (kg/yr) % of TotalElectricity generation (coal-fired) 2,463,086 51%Industrial vehicles 696,263 14%Coal mining 515,073 11%All other PM 10sources 1,203,277 24%Total PM 104,877,699 100%Oxides of Nitrogen (NO X) Emissions (kg/yr) % of TotalElectricity generation (coal-fired) 55,517,408 92.6%On-road vehicles 3,589,927 6.0%Industrial vehicles 376,230 0.6%All other NO 2sources 483,933 0.8%Total NO X59,967,497 100%Sulfur Dioxide (SO 2) Emissions (kg/yr) % of TotalElectricity generation (coal-fired) 74,000,000 99.83%On-road vehicles 65,571 0.09%Food manufacturing 17,742 0.02All other SO 2sources 42,365 0.06Total SO 274,125,678 100%Source: OEH (2003)Table 28: Emissions of major pollutants from power stations2008/2009 2009/<strong>2010</strong>Power Station PM 10NO 2SO 2PM 10NO 2SO 2Eraring 1,1000,000 34,000,000 37,000,000 950,000 33,000,000 29,000,000Vales Point 450,000 24,000,000 20,000,000 110,000 21,000,000 20,000,000Munmorah 340,000 5,700,000 6,800,000 33,000 2,400,000 2,900,000Colongra (Munmorah) N/A N/A N/A 1,200 120,000 530Source: NPI (2008/2009, 2009/<strong>2010</strong>).
98<strong>City</strong> of <strong>Lake</strong> <strong>Macquarie</strong>- <strong>Annual</strong> <strong>Report</strong> <strong>2010</strong>/<strong>2011</strong>Power stations and environmental complianceThe OEH licence register for <strong>2010</strong>/<strong>2011</strong> listed no incidents of non-compliance for Eraring, Vales Point, andMunmorah power stations.Motor vehiclesThe total number of registered vehicles in <strong>Lake</strong> <strong>Macquarie</strong> <strong>City</strong> (Table 29) has increased by 2.2% (or 3,714 vehicles)since 2009/<strong>2010</strong>. Registered fuelled vehicles have increased by 2.3% (or an increase of 3,071 vehicles) withliquid petroleum and petrol hybrid vehicles decreasing by 1.06% (or a decrease of 40 vehicles). There are nowapproximately 173,771 vehicles registered in the city (RTA <strong>2011</strong>).Table 29: Registered vehicles (fuelled & total) in <strong>Lake</strong> <strong>Macquarie</strong> <strong>City</strong>* For reporting purposes, ‘unknown’ is deemed a non-fuelled vehicle.Source: RTA (<strong>2011</strong>) and previous LMCC SoE report.Number of VehiclesFuel Type 2008/2009 2009/<strong>2010</strong> <strong>2010</strong>/<strong>2011</strong>Unleaded petrol 110,772 113,309 115,192Leaded petrol 4,034 3,441 3,139Diesel 13,056 14,727 16,170Liquid petroleum Gas (LPG) & Petrol Hybrids 3,581 3,761 3,721Other fuel types 123 215 302Total fuelled vehicles: 131,566 135,453 138,524Trailers 33,263 34,072 34,769*Unknown 621 532 478Total registered vehicles: 165,450 170,057 173,771Public transportInadequate public transport is one cause of increased congestion on major roads. The last reported census fromthe Australian Bureau of Statistics (ABS 2006) showed that for single method travel to work, residents preferred:cars to be the principal mode of transport (91%); with public transport 2%; walking 2%; cycling 1%; and othermodes, including truck and motorbikes 4%. Full census data are available from the ABS websitewww.abs.gov.au.
Our Performance 99Energy at a glanceThe Enhanced Greenhouse EffectSTATEImproving<strong>City</strong>wide energy usage decreased by 1.0% (compared to 2009/<strong>2010</strong> reporting period), with a 2.2 % decrease in totalresidential electricity use and a 0.8% increase in total non-residential electricity usage.PRESSUREIncreasing Due to an increasing population, motor vehicle registration, land clearing, and continued pressure on electricityconsumption, the pressure on greenhouse gas emissions is increasing.RESPONSEGood <strong>Council</strong> is committed to reducing greenhouse gas emissions, and is implementing projects and targeted citywidecampaigns in the areas of energy, transport, waste, and consumption.ENVIRONMENTAL INDICATORSElectricity consumption <strong>Lake</strong> <strong>Macquarie</strong> <strong>City</strong>:Total consumptionResidential useBusiness useSolar generation exported to gridANNUAL LEVEL<strong>2010</strong>/<strong>2011</strong>932,367 megawatt hours (MWh) (1% decrease)575,851MWh (2.2% decrease)356,516MWh (0.8% increase)7,128MWh (1,197% increase)CURRENTTREND* Percentage decrease assessed on revised 2009/<strong>2010</strong> Ausgrid figures.Electricity consumptionDuring the reporting period 932,367MWh of electricitywas used in <strong>Lake</strong> <strong>Macquarie</strong> <strong>City</strong>. This is a 1%decrease in total electricity use in the city comparedto the 2009/<strong>2010</strong> reporting period. There has beena 2.2% decrease in total residential electricity useand a 0.8% increase in total non-residential electricityconsumption (Ausgrid <strong>2011</strong>).The decrease in residential electricity consumptionsuggests a continuation of high levels of energyconservation and energy efficiency by householdsincluding a high uptake of household measures suchas solar hot water and solar photovoltaics.Greenhouse Gas EmissionReduction <strong>Report</strong><strong>Council</strong> recognised the need to reduce greenhousegas emissions and adopted the Greenhouse GasEmission Reduction Targets Policy in 2008. Thispolicy outlined reduction targets of 3% pa/capita forthe city, and 3% pa for <strong>Council</strong> operations (based on2007/2008 baseline data). As resources to implementthe policy were not acquired until late 2008, the targetfor the first year (2008/2009) was amended to 1.5%per capita (for the six month period from 1 January2009 to 30 June 2009).<strong>City</strong> Carbon Footprint<strong>Council</strong> undertook to meet a reduction target, for thesecond year (2009/<strong>2010</strong>) of 3% or 4.5% against thebaseline year. Total carbon emissions for the city were4,891,375t CO 2-e, which was 0.44% (21,614t CO 2-e)more than the baseline year. The city population wasestimated to have increased by 2.55% to 199,962(December 2007 to December <strong>2010</strong>) with per capitaemissions decreasing by 2.1% (from 24.97t CO 2-e in2007/2008 to 24.46t CO 2-e per capita in 2009/<strong>2010</strong>).This reduction did not meet the target reduction of4.5% (1.5% for 2008/2009 and 3% for 2009/<strong>2010</strong>).The major contributors to reduced per capitaemissions were:decreased output from local power stations;residential demand management throughconversion from electric water heaters to solarwater heaters (<strong>Lake</strong> <strong>Macquarie</strong> <strong>City</strong> had thehighest uptake of rebates for solar hot watersystems in NSW);Energy
100<strong>City</strong> of <strong>Lake</strong> <strong>Macquarie</strong>- <strong>Annual</strong> <strong>Report</strong> <strong>2010</strong>/<strong>2011</strong>decrease in consumption from large businesses; anddecrease in waste to landfill (from 612kg per capita to 472kg per capita).The major contributors to upward pressure on per capita emissions were:increases in business related vehicle ownership potentially related to government incentives; andconsumption related impacts.<strong>Council</strong> Carbon Emission ReductionTotal estimated carbon emissions from <strong>Council</strong> operations for the same period were 18,933t CO 2-e.Major contributors to emissions reduction included:uptake of 15% GreenPower for <strong>Council</strong>’s largest 15 facilities;gas boiler upgrade at Charlestown Pool;a 10% decrease in fuel consumption by passenger vehicles powered by unleaded and other fuels; solarphotovoltaic panel installation at the Works Depot, Speers Point Pool, Toronto Multipurpose Centre, andLandcare Resource Centre; andreduction of energy consumption at holiday parks through the installation of solar hot water, individual sitemetering, and usage of shower timers.A summary of emissions from <strong>Council</strong> operations is provided below, with a full report of city and <strong>Council</strong> emissionoutcomes for the <strong>2010</strong>/<strong>2011</strong> reporting period to be submitted to <strong>Council</strong> in 2012.Note: the baseline year 2007/2008 results have been revised to reflect updated emission factors and new gas data.<strong>2010</strong>/<strong>2011</strong> Greenhouse Gas EmissionsCumulative <strong>Council</strong> greenhouse gas emission savings for specific actions for the <strong>2010</strong>/<strong>2011</strong> reporting periodwere 1,638t CO 2-e (Table 30). The savings for specific actions are offset by 99t CO 2-e primarily due to increases inenergy consumption at other facilities. The projected net reduction in <strong>2010</strong>/<strong>2011</strong> from the baseline year is*1,539t CO 2-e (Table 31).* Finalised <strong>2010</strong>/<strong>2011</strong> footprint not yet available.Table 30: <strong>Council</strong> Greenhouse Gas Emission Reduction Program results to <strong>2010</strong>/<strong>2011</strong>Cumulative Savings to<strong>2010</strong>/<strong>2011</strong> (t CO 2-e/year)GreenPower purchases for council facilities <strong>2010</strong>/<strong>2011</strong> 494PV Installations (Speers Point Pool and Toronto Multipurpose Centre) 17LED Floodlighting (Administration Building) 12Energy Management Swansea Holiday Park (versus baseline) 127Energy Management (Administration Building, Libraries, and Rural Fire Service Control Centre (versus baseline) 102<strong>Council</strong> fleet (smaller engine and hybrid vehicles) versus baseline 300Civi<strong>Lake</strong> concrete and asphalt reuse and recycling (based on recycled materials use) 586ESTIMATED SAVING (<strong>2010</strong>/<strong>2011</strong>): 1,638Note: Specific actions will not add up to total estimated footprint reduction due to changes in other areas.To meet the reduction target for the <strong>2010</strong>/<strong>2011</strong> reporting period, a reduction of 7.5% (1,535t CO 2-e) on the2007/2008 <strong>Council</strong> baseline is required. A reduction of 7.52% (1,539t CO 2-e) is projected versus the 2007/2008baseline (Table 31).Table 31: <strong>Council</strong> Greenhouse Gas Emission Reduction compared to 2007/2008 baseline year<strong>2010</strong>/<strong>2011</strong> emission savingscompared to 2007/2008baseline (t CO 2-e/year)ActionElectricity 590 Reduction in electricity consumption (top15 sites) and GreenPower purchasesGas 63 Decreased gas consumptionFleet 300 Decreased fuel burnResource consumption 586 Civi<strong>Lake</strong> Operations RecyclingEstimated Total change <strong>2010</strong>/<strong>2011</strong> to 2007/2008baseline (2007/2008 baseline: * 20,472 t CO 2-e)1,539Note: Complete footprint data not yet available * Baseline Revised
Our Performance 101<strong>Council</strong>’s plant and fleet emission reduction outcomes include:the continued use of an in-line diesel fuel filtration system to improve fuel quality and fuel consumption;hybrid vehicles representing 10% of the passenger vehicle fleet (17 petrol/electric vehicles);four-cylinder vehicles now make up 74% of the passenger vehicle fleet (compared to 60% of the fleet in June <strong>2010</strong>);the continued phasing out of six-cylinder petrol ute category in preference to four cylinder diesel variants.This project is ongoing and expected to take three years to completely phase out all six-cylinder utes; andagreement for electric vehicle trial.<strong>Council</strong> continues its commitment to reducing the organisation and city carbon footprints by targeting the areas ofenergy, transport, waste, water, and consumption.Climate Change Fund Rebates and other cumulative savingsThe OEH Climate Change Fund, established in July 2007 to help people make their homes more water and energyefficient, provides rebates for rainwater tanks, climate-friendly hot water systems, ceiling insulation, water-efficientwashing machines, dual flush toilets, and most recently hot water circulators (units installed to recover wasted waterwithin instantaneous gas hot water systems).<strong>Lake</strong> <strong>Macquarie</strong> <strong>City</strong> is again rated first in the state for total uptake of Climate Change Fund rebates, with 13,350rebates paid to 30 June <strong>2011</strong>. Our city ranked first for uptake of both hot water systems and dual flush toilets, andranked second for uptake of insulation (OEH <strong>2011</strong>e). Savings from photovoltaic installations have also bolsteredestimated annual savings for the city (Table 32).Table 32: Uptake of Rebates in <strong>Lake</strong> <strong>Macquarie</strong> <strong>City</strong> to 30 June <strong>2011</strong>Number of rebates/connectionsEstimated savingsper year (<strong>2010</strong>/<strong>2011</strong>)t CO 2-ekLEstimated annualsavings ($)Climate Change Fund RebatesRainwater Tanks 1 737 - 47,905 95,810Solar Hot Water Systems 2 8,713 21,783 - #2,442,897Ceiling Insulation 3 929 465 - 91,164Washing Machine 4 1,828 - °43,872 87,744Dual Flush toilets 5 1,143 - 28,575 57,150Hot Water Circulator 6 NIL NIL NIL NILTotal Climate Change Fund rebates 13,350 22,248 120,352 2,774,765Showerhead exchange 1,344 367 17,820 72,683Sub Total 14,694 22,615 138,172 2,847,448Photovoltaic installations5,084 kW installed 2,651 7,518 - *3,271,935Total estimate per annum savings for aboveactivities initiated and supported by <strong>Council</strong>30,133 138,172 6,119,383Source: OEH (<strong>2010</strong>), OEH (<strong>2011</strong>e), Ausgrid (<strong>2011</strong>)1Sydney Water and OEH figures from start of Rainwater Tank Rebate Program – 1/7/20072Hot water system rebates calculated from start of program – 1/10/20073Ceiling insulation rebates calculated from start of program – 1/10/2007 (finished 30/6/2009).4Sydney Water and OEH figures from start of washing machine rebates - 1/8/2008 (finished 30/06/<strong>2010</strong>)5Sydney Water and OEH figures from start of dual flush toilet rebate program – 15/1/<strong>2010</strong>6Sydney Water and OEH figures from start of hot water circulator rebate program – 15/1/<strong>2010</strong>#Savings based on Off Peak 2 rates including 300 <strong>Council</strong> Solar Hot Water rebates° Assume water efficiency only* Assume 2/3 receiving 60 cents/kWh gross feed in tariff and 1/3 net metered average saving of 20 cents/kW, capital cost not taken into account
102<strong>City</strong> of <strong>Lake</strong> <strong>Macquarie</strong>- <strong>Annual</strong> <strong>Report</strong> <strong>2010</strong>/<strong>2011</strong>heritage AT A GLANCEAboriginal HeritageSTATEUnknown Over 500 Aboriginal sites are registered.PRESSUREIncreasing Land clearing, urban development, mining, tourism, natural erosion in coastal areas, vandalism, and a lack ofunderstanding regarding cultural significance can result in loss of Aboriginal heritage.RESPONSELimitedOEH is the lead agency responsible for the protection of Aboriginal artefacts. The draft <strong>Lake</strong> <strong>Macquarie</strong> AboriginalHeritage Management Strategy has been exhibited.Aboriginal sites and cultural heritage are to be taken into consideration in the assessment of development applicationsand amendments to LMLEP 2004.Non-Aboriginal HeritageSTATEIncreasingPRESSUREIncreasingRESPONSEIncreasingHeritage sites listed in <strong>Lake</strong> <strong>Macquarie</strong> <strong>City</strong>:• Hunter Regional Environmental Plan – three Conservation Areas;• National Trust Register – 39 sites and areas;• Register of the National Estate: 21 ‘Indicative Places’; 10 ‘Registered’; and one ‘Rejected’;• State Heritage Register - six items listed;• One Local Conservation Area, with two additional Local Conservation Areas proposed in draft LMLEP <strong>2011</strong>.Pressure is increasing due to inappropriate infill development, a lack of understanding about cultural significance, thedecreased protection for provisional items and a lack of full investigation for adaptive reuse, and the inability to find alternativeuses for items where original uses have ceased (i.e. outmoded residences, commercial, and industrial buildings).Heritage provisions of DCP No. 1 and its attachment (<strong>Lake</strong> <strong>Macquarie</strong> Heritage Guidelines) came into effect in March2004. DCP No. 1 is currently under review, with a new version likely to be adopted within draft LEP <strong>2011</strong>.Review of heritage item listings for inclusion in LMLEP 2004 is ongoing, nine additional items have been listed, withanother 11 items in the process of being listed. An additional 20 items are being assessed for listing.A new Thematic History for the city was completed in January <strong>2010</strong>. The Thematic History is the first stage of acomprehensive review of the 1993 Heritage Study.ENVIRONMENTAL INDICATORSAboriginal HeritageANNUAL LEVEL<strong>2010</strong>/<strong>2011</strong>CURRENTTRENDNumber of Aboriginal sites in <strong>Lake</strong> <strong>Macquarie</strong> <strong>City</strong> Over 500Non-Aboriginal HeritageNon Aboriginal heritage sites registered in <strong>Lake</strong> <strong>Macquarie</strong> <strong>City</strong> 266Heritage
Our Performance 103<strong>Council</strong> is responsible for the identification andassessment of European, Aboriginal, and naturalheritage items within the city under the EP&A Act.The value of these sites and items is increasinglygaining importance in providing links to the history ofthe area.<strong>Council</strong>’s Heritage Guidelines greatly assist inproviding consistency in advising the communityon heritage requirements, and in the assessment ofdevelopment applications by <strong>Council</strong>.Future requirements for information will call fordirection to specific investigations to uncover thecultural significance of individual properties forinclusion in LEPs or to determine the best course ofaction for conservation of heritage items.Ongoing changes to the urban and rural areas withinthe city inevitably result in the loss of some traces ofpast land use. However, indiscriminate damage toexisting heritage places is increasingly contributing tothe loss. Current solutions deal with legislative ratherthan physical conservation methods. In the future,the community will increasingly be required to provideresources for physical conservation and protection.Aboriginal HeritageThere are currently over 500 registered sites. Therehas been increasing pressure on Aboriginal heritagein the city during the reporting period.Aboriginal HeritageManagement StrategyIn 2000, <strong>Council</strong> commissioned a strategy for theindigenous cultural heritage of <strong>Lake</strong> <strong>Macquarie</strong> <strong>City</strong>.The aim of the strategy was to identify areas ofknown or potential archaeological and/or Aboriginalsignificance and to provide information to <strong>Council</strong>to guide planning and management decisions, witha goal of protecting and respecting the known andpotential Aboriginal resources in the area.Stages 1A, 1B, and 2A of the strategy are nowcomplete. The draft strategy is being carried outin close consultation and participation with localAboriginal stakeholders, including local Aboriginalland councils and traditional owner families.Increased awareness and appreciation of Aboriginalheritage in the city is critical to the successfulimplementation of the Aboriginal HeritageManagement Strategy. This will continue to bemonitored during Stage 2 of the strategy, includingthe exhibition of general outcomes and communityconsultation. This will also include provision ofinformation, which outlines community responsibilitiesin relation to Aboriginal heritage.Community views on Aboriginal heritage has beenmonitored during Stage 2 of the strategy. Otherpossible areas to be monitored include changes inthe number and level of Aboriginal archaeologicalassessments undertaken as part of the developmentapplication process. The number of additionalplaces and potential places of Aboriginal heritagesignificance, identified over time, will also bemonitored.Non-Aboriginal HeritageThe <strong>City</strong> of <strong>Lake</strong> <strong>Macquarie</strong> Heritage Study,undertaken during 1992/1993, identified 513individual and group items of heritage significance.In addition, several large conservation areas wereidentified to bring the total heritage resource toseveral thousand objects.There has been increasing pressure on non-Aboriginal heritage due to development. This includesfurther impact on heritage precincts and provisionalheritage items from the newly introduced Exemptand Complying Development Code (SEPP 2008),commencing 27 February 2009.A new Thematic History for the city was completed inJanuary <strong>2010</strong>. The Thematic History is the first stageof a comprehensive review of the 1993 HeritageStudy (LMCC 1993).Following the completion of the Thematic History, anadditional nine items have been listed in LEP 2004,with another 11 items in the process of being listed. Afurther 20 items are in the process of being assessedfor heritage listing.OEH has statutory responsibility for protectingAboriginal sites (objects) in NSW and maintains aregister of known Aboriginal sites. After consultationwith OEH and NSW Department of Planning andInfrastructure, the Strategy was recently updatedin compliance with <strong>Council</strong>’s move towards draftLMLEP <strong>2011</strong>. The draft Strategy has now beenpublicly exhibited.
104<strong>City</strong> of <strong>Lake</strong> <strong>Macquarie</strong>- <strong>Annual</strong> <strong>Report</strong> <strong>2010</strong>/<strong>2011</strong>ReferencesABS (2006) 2006 Census of Population and Housing, <strong>Lake</strong> <strong>Macquarie</strong> LGA, NSW: Method of travel to work,Australian Bureau of Statistics, http://www.abs.gov/websitedbs/d3310114.nsf/home/census+data, accessedOctober 2009.ABS (<strong>2011</strong>) 3218.0 - Regional Population Growth Australia 2009-<strong>2010</strong>: Population Estimates by GovernmentArea 2001-<strong>2010</strong>, Table 1 Estimated Resident Population, Local Government Areas, New South Wales,Australian Bureau of Statistics, http://www.abs.gov.au/AUSSTATS/abs@.nsf/DetailsPage/3218.02009-10,accessed August <strong>2011</strong>.Ausgrid (<strong>2011</strong>) Community Electricity <strong>Report</strong>, <strong>Council</strong> Area: <strong>Lake</strong> <strong>Macquarie</strong> and Ausgrid Network Area,Ausgrid, October <strong>2011</strong>.Bell S. and Driscoll C. (<strong>2010</strong>) Vegetation Mapping of <strong>Lake</strong> <strong>Macquarie</strong> LGA: Stages 1 & 2. <strong>Report</strong> to <strong>Lake</strong><strong>Macquarie</strong> <strong>City</strong> <strong>Council</strong>.Benson D.H. (1986) Vegetation of the Gosford and <strong>Lake</strong> <strong>Macquarie</strong> 1:100,000 vegetation map sheet,Cunninghamia 1(4): 467-490.Briggs J.D. and Leigh J.H. (1995) Rare or Threatened Australian Plants, Revised Edition, SpecialPublication No 14, Australian National Parks and Wildlife Service, Canberra.Burns J. (<strong>2010</strong>) A study of Razor Clams in <strong>Lake</strong> <strong>Macquarie</strong>. B. Sc.(Hons) Thesis. University of New England.Clearwater Ecological (2009) Macroalgae surveys in <strong>Lake</strong> <strong>Macquarie</strong>: <strong>Annual</strong> <strong>Report</strong> – Winter 2008 to Autumn2009, prepared by Clearwater Ecological for the Office of the <strong>Lake</strong> <strong>Macquarie</strong> and Catchment Coordinator.Clearwater Ecological (<strong>2011</strong>) Macroalgae surveys in <strong>Lake</strong> <strong>Macquarie</strong>: <strong>Annual</strong> <strong>Report</strong> – Summer <strong>2011</strong> toWinter <strong>2011</strong>, prepared by Clearwater Ecological for <strong>Lake</strong> <strong>Macquarie</strong> <strong>City</strong> <strong>Council</strong>.DCC (2009) Tracking to Kyoto and 2020: Australia’s Greenhouse Emissions Trends 1990 to 2008-2012 and2020, Department of Climate Change, Canberra, ACT.DCC&EE (<strong>2011</strong>) National Greenhouse Accounts (NGA) Factors, published Department of Climate Changeand Energy Efficiency, Barton, ACT, http://www.climatechange.gov.au/publications/greenhouse-acctg/nationalgreenhouse-factors.aspx,accessed August <strong>2011</strong>.DoP (2006) Lower Hunter Regional Strategy 2006-31, State of New South Wales through the NSWGovernment Department of Planning, October 2006.Ecological (<strong>2010</strong>) <strong>Lake</strong> <strong>Macquarie</strong> Wetlands Climate Change Assessment, prepared by Ecological Australiafor <strong>Lake</strong> <strong>Macquarie</strong> <strong>City</strong> <strong>Council</strong>, July <strong>2010</strong>.Edwards T. (2008) Marine Protected Areas Briefing Paper No 8/08, NSW Library Research Service,September 2008.Gladstone W., Loisier A. and Herbert C. (2007) Central Coast Rocky Shore Biodiversity Assessment,study funded by the Hunter Central Rivers Catchment Management Authority, December 2007.Gray R. (2006) Aquatic Vegetation Survey of <strong>Lake</strong> <strong>Macquarie</strong> February 2006. <strong>Report</strong> to Connell Wagner forDelta Electricity and the Office of the <strong>Lake</strong> <strong>Macquarie</strong> and Catchment Coordinator, compiled by Rod Gray forSustainable Futures Australia.Gray R. (2007) Aquatic Vegetation Survey of <strong>Lake</strong> <strong>Macquarie</strong> February 2007. <strong>Report</strong> to Connell Wagner forDelta Electricity and the Office of the <strong>Lake</strong> <strong>Macquarie</strong> and Catchment Coordinator, compiled by Rod Gray forSouthern Cross University.Haythorpe K. (2008) Bell Miner Associated Dieback; Are bell miners Manorina melanophrys really to blame?B.Env. Sc. Mgt. (Hons) Thesis University of Newcastle.HCRCMA (<strong>2011</strong>) email from Hunter-Central Rivers Catchment Management Authority for <strong>2010</strong>/<strong>2011</strong> State ofthe Environment <strong>Report</strong> prepared by Jane Lloyd-Jones (HCRCMA), P Week <strong>2010</strong> Map and Waterwatch Activity,August <strong>2011</strong>.HWC (<strong>2011</strong>a) email from Hunter Water Corporation for <strong>2010</strong>/<strong>2011</strong> State of the Environment report prepared byCarol Richardson, Hunter Water Corporation, August <strong>2011</strong>.HWC (<strong>2011</strong>b) email from Hunter Water Corporation for <strong>2010</strong>/<strong>2011</strong> State of the Environment report prepared byTony McClymont (HWC), August <strong>2011</strong>.
Our Performance 105LHCCREMS (2003a) Lower Hunter & Central Coast Regional Environmental Management Strategy, May 2003.LMCC (1993) <strong>Lake</strong> <strong>Macquarie</strong> Heritage Study, <strong>Lake</strong> <strong>Macquarie</strong> <strong>City</strong> <strong>Council</strong>, 1993.LMCC (1997) <strong>Lake</strong> <strong>Macquarie</strong> Estuary Management Plan, prepared by WBM Oceanics Australia for <strong>Lake</strong><strong>Macquarie</strong> <strong>City</strong> <strong>Council</strong>, 1997.LMCC (1999a) <strong>Lake</strong> <strong>Macquarie</strong> Coastline Management Plan, prepared by Umwelt (Australia) Pty Ltd inassociation with Gardner Browne Planning Consultants for <strong>Lake</strong> <strong>Macquarie</strong> <strong>City</strong> <strong>Council</strong>, 1999.LMCC (1999b) State of the Environment <strong>Report</strong> 1998/1999, <strong>Lake</strong> <strong>Macquarie</strong> <strong>City</strong> <strong>Council</strong>, November 1999.LMCC (2004) State of the Environment <strong>Report</strong> 2003/2004, <strong>Lake</strong> <strong>Macquarie</strong> <strong>City</strong> <strong>Council</strong>, November 2004.LMCC (<strong>2010</strong>) State of the Environment <strong>Report</strong> 2009/<strong>2010</strong> – Part of <strong>Annual</strong> <strong>Report</strong> 2009/<strong>2010</strong>, <strong>Lake</strong><strong>Macquarie</strong> <strong>City</strong> <strong>Council</strong>, November <strong>2010</strong>.MPA (2005) Broadscale Biodiversity Assessment of the Hawkesbury Shelf Marine Bioregion 2005, MarineParks Authority, 2005.Morton J. and Gladstone W. (<strong>2010</strong>) Fish Assemblages Associated with Rocky Reef Habitat in the <strong>Lake</strong><strong>Macquarie</strong> Estuary, <strong>Lake</strong> <strong>Macquarie</strong> Research Grant 07/08-3, January <strong>2010</strong>.NHMRC (2008) Guidelines for Managing Risks in Recreational Water, Australian Government, National Health andMedical Research <strong>Council</strong>, http://www.nhmrc.gov.au/publications/synopses/eh38.htm , accessed August <strong>2011</strong>.NPI (2008/2009, 2009/<strong>2010</strong>) National Pollution Inventory, www.npi.gov.au, accessed September <strong>2011</strong>.OEH (2003) Air Emissions Inventory for the Greater Metropolitan Region in NSW, NSW Government Office ofEnvironment and Heritage, http://www.environment.nsw.gov.au/air/airinventory.htm, accessed August <strong>2011</strong>.OEH (<strong>2010</strong>) Conceptual Model of Basic Foodweb for Estuaries, NSW Government Office of Environment andHeritage, Coast and Estuaries Unit, <strong>2010</strong>.OEH (<strong>2011</strong>a) email from the Office of Environment and Heritage to <strong>Lake</strong> <strong>Macquarie</strong> <strong>City</strong> <strong>Council</strong> for the<strong>2010</strong>/<strong>2011</strong> State of the Environment <strong>Report</strong> prepared by Jeff Johnston (OEH), Community Involvement andLand Management, July <strong>2011</strong>.OEH (<strong>2011</strong>b) email from the NSW Government Office of Environment and Heritage to <strong>Lake</strong> <strong>Macquarie</strong> <strong>City</strong><strong>Council</strong> for <strong>2010</strong>/<strong>2011</strong> State of the Environment <strong>Report</strong> prepared by Meredith Campey and taken from theState of the Beaches <strong>2010</strong>-<strong>2011</strong> report (release date October <strong>2011</strong>), July <strong>2011</strong>.OEH (<strong>2011</strong>c) Weekly star ratings: What is a star rating? NSW Government Office of Environment and Heritage,http://www.environment.nsw.gov.au/beach/reportstar.htm, accessed August <strong>2011</strong>.OEH (<strong>2011</strong>d) email from NSW Government Office of Environment and Heritage to <strong>Lake</strong> <strong>Macquarie</strong> <strong>City</strong> <strong>Council</strong>for <strong>2010</strong>/<strong>2011</strong> State of the Environment <strong>Report</strong> prepared by Linda Roy (OEH), Information on calls taken byOEH Information Line for <strong>Lake</strong> <strong>Macquarie</strong> LGA, August <strong>2011</strong>.OEH (<strong>2011</strong>e) Exceedences of National Health Goal for Particulate Matter, Wallsend <strong>2010</strong> <strong>2011</strong>, NSWGovernment Office of Environment and Heritage, http://www.environment.nsw.gov.au/AQMS/search.htm,accessed August <strong>2011</strong>.OEH (<strong>2011</strong>f) Daily Maximum Concentrations of Particulate Matter Wallsend 2009/<strong>2010</strong> and <strong>2010</strong>/<strong>2011</strong>, NSWGovernment Office of Environment and Heritage, http://www.environment.nsw.gov.au/AQMS/search.htm,accessed August <strong>2011</strong>.OEH (<strong>2011</strong>g) NSW Home Saver Rebates Uptake by Local Government Area to 30 June <strong>2011</strong>, NSWGovernment Office of Environment and Heritage, New South Wales Climate Change Fund,http://www.environment.nsw.gov.au/resources/rebates/110620LGARebatesStats.pdf, accessed August <strong>2011</strong>.RTA (<strong>2011</strong>) Table 1.1.13 Vehicle type by Motive Power Code by LGA as at 31 March <strong>2011</strong>: <strong>Lake</strong> <strong>Macquarie</strong>,NSW Roads and Traffic Authority, http://www.rta.nsw.gov.au/publicationsstatisticsforms/statistics/registrationandlicensing/tables/table1113_<strong>2011</strong>q1.html, accessed August <strong>2011</strong> (at compiling of this reportstatistics were not available ‘for 30 June <strong>2011</strong>’).Sydney Water (2007) Streamwatch/Waterwatch Quality Assurance 2007 Summary <strong>Report</strong>. Sydney Water.WHO Europe (2004) Health Aspects of Air Pollution - Results From The WHO Project “Systematic ReviewOf Health Aspects Of Air Pollution In Europe”, Regional Office for Europe of the World Health Organization,Copenhagen, Denmark, http://www.euro.who.int/document/E83080.pdf, accessed August <strong>2011</strong>.
106<strong>City</strong> of <strong>Lake</strong> <strong>Macquarie</strong>- <strong>Annual</strong> <strong>Report</strong> <strong>2010</strong>/<strong>2011</strong>Acronyms / AbbreviationsABSAustralian Bureau of StatisticsBASIXBuilding Sustainability Index (NSW)CEMPCommunity Ecosystem Monitoring ProgramCO 2-eCarbon dioxide equivalentDCC&EE Department of Climate Change and Energy Efficiency (Federal)DCPDevelopment Control PlanDPIDepartment of Primary Industries (NSW)EP&A Act Environmental Planning & Assessment Act 1979 (NSW)EPBC Act Environment Protection and Biodiversity Conservation Act 1999 (Commonwealth)FM Act Fisheries Management Act 1994 (NSW)ggramhahectareHBOCHunter Bird Observers ClubHCRCMA Hunter-Central Rivers Catchment Management AuthorityHWCHunter Water CorporationkgkilogramkLkilolitrekmkilometrekm²square kilometrekWhkilowatt hourLlitreLandsat satellites used to gather and transmit data for constructing images of the Earth’s surface using remote sensing techniquesLGAlocal government areaLEPLocal Environmental PlanLMCC<strong>Lake</strong> <strong>Macquarie</strong> <strong>City</strong> <strong>Council</strong>LMLEP <strong>Lake</strong> <strong>Macquarie</strong> Local Environmental PlanLS 2020 Lifestyle 2020LS 2030 Lifestyle 2030mmetrem 2m 3m³/hourMLMWhNABERSNATANHMRCNSWNSW FisheriesOEHp.a.PoEO ActQARTASCASEPPSoESMPSPISQIDtTSC Actsquare metremetres cubedmetres cubed per hourmegalitremegawatt hourNational Australian Built Environment Rating System – a national initiative managed by OEH (NSW)National Association of Testing AuthoritiesNational Health and Medical Research <strong>Council</strong>New South WalesDepartment of Primary Industries | Fisheries (NSW)Office of Environment and Heritage (NSW) (formerly Department of Environment Climate Change and Water)per annumProtection of the Environment Operations Act 1997 (NSW)Quality AssuranceRoads and Traffic Authority (NSW)State Conservation AreaState Environmental Planning PolicyState of the EnvironmentStormwater Management PlanStream Pollution IndexStormwater Quality Improvement DevicetonneThreatened Species Conservation Act 1995 (NSW)
108<strong>City</strong> of <strong>Lake</strong> <strong>Macquarie</strong>- <strong>Annual</strong> <strong>Report</strong> <strong>2010</strong>/<strong>2011</strong>human resourceactivitiesWorkplace of Health andWellbeing Initiatives<strong>Council</strong> is committed to providing employees with asafe and healthy working environment that recognisesthe importance of personal wellbeing and a balancedlifestyle. Some of the initiatives undertaken to achievethis included:providing subsidised flu vaccinations to over350 staffrebranding and actively promoting <strong>Council</strong>’sEmployee Assistance Program (EAP)targeting manual handling training and riskassessments for high risk teams and activitiesdeveloping and implementing an OccupationalHealth and Safety (OHS) training programacross the organisation. The training met<strong>Council</strong>’s obligation as a self-insurer for workerscompensation, and helped further embed a cultureof health and safety at workRecruitment StrategyGetting the right person to do the right job is essentialin building a sustainable quality workforce.In recognition of this and the competitive employmentmarket <strong>Council</strong> reviewed the methods used to attractskilled workers. This included:reviewing print advertising and redesigning theadvertisement to target suitable applicants;increasing use of online advertising job boards tokeep up with current trends;refining interview techniques; andintroducing competency based assessments.Critical PositionSuccession PlanningApproximately 17% of <strong>Council</strong>’s workforce is agedover 55 and moving into retirement. Some of theseemployees hold key positions, are highly skilled, andpossess a wealth of knowledge. <strong>Council</strong> recognisesthe need to impart their skills and knowledge toyounger employees.As part of the HR Strategy and WorkforceManagement Strategy, <strong>Council</strong> identified these keypositions and commenced considering potentialinternal applicants and the training required.This exercise is now complete with successionplans implemented for many key positions toensure <strong>Council</strong>’s critical functions and services aremaintained.Our Organisation
Our Organisation 109Training andDevelopment Activities<strong>Council</strong> has continued to provide a wide varietyof training and development opportunities for itsemployees. The Human Resource Managementdepartment designed and delivered a range oflearning and development initiatives to address thegrowing needs of the organisation.Induction - OnlineSupervisor Development ProgramOHS Online ModulesEmergency CareTargeted Process Control Documents TrainingMandatory Supervisor TrainingRisk Assessment/Evacuation Training for FamilyDay Care ProvidersTargeted Occupational Health and SafetyManagement System (OHSMS) TrainingBrief Preparation/Court TrainingTargeted Safe Driving TrainingBicycle Safety Targeted TrainingCorporate Risk Management TrainingDue Diligence TrainingThe team conducted and recorded all other externaland compliance training across the organisation.Consultative CommitteeThe Consultative Committee is comprised ofelected staff and management representatives.It is coordinated by the Human ResourceManagement department and meets once a month.The committee aims to facilitate workplace reformand enhance the efficiency and productivityof <strong>Council</strong>.
110<strong>City</strong> of <strong>Lake</strong> <strong>Macquarie</strong>- <strong>Annual</strong> <strong>Report</strong> <strong>2010</strong>/<strong>2011</strong>Equal EmploymentOpportunities<strong>Council</strong>’s Equal Employment opportunity (EEO) Management Plan seeks to create a positive work culture withinthe organisation. It ensures all employees adopt fair practices, make unbiased decisions, and recognise andrespect the social, personal, and cultural attributes of staff. The plan encompasses five broad areas designed toassist <strong>Council</strong> to develop a culture that is supportive of equity and diversity. These are:Planning diversity - ensuring the collection of comprehensive and accurate data to assist in the development ofappropriate diversity strategies;Policies and planning - ensuring the integration of equity and diversity into <strong>Council</strong>’s planning, policy andmanagement framework;Communication and awareness - implementing effective workplace communication and training to ensureawareness of EEO principles, practices, rights and responsibilities;Diverse culture - implementation of strategies to ensure EEO and diversity are valued and the work environmentis free from discrimination and harassment;Recruitment and selection - ensuring recruitment and selection practices are fair for all applicants andconsistent with the principles of Equity and Diversity; andImplementation, evaluation and review - ensuring objectives are effectively implemented, regularly reviewed andevaluated.To enhance the strategies contained within the EEO Management Plan a number of other actions have occurred.These include the implementation of <strong>Council</strong>’s Equity and Diversity Policy and Procedure and the Bullying andHarassment Policy and Procedure.
Our Organisation 111OccupationalHealth &Safety (OHS)Through its OHS Policy, <strong>Council</strong> commits to thewellbeing of employees, volunteers, contractors,suppliers, visitors, and the community.<strong>Council</strong> has developed strategies aimed at continuallyimproving OHS performance. Milestones we haveachieved in <strong>2010</strong>/<strong>2011</strong> are as follows:OHS Management SystemAs a condition of <strong>Council</strong>’s Self Insurer Licence,WorkCover successfully audited our OHSManagement System against the National SelfInsurer OHS Audit ToolOHS Management PlanIn <strong>2010</strong>, <strong>Council</strong> implemented a two year OHSManagement Plan. Over this financial year, <strong>Council</strong>achieved the following:• Reduced the Lost Time Injury Rate (LTIR) andLost Time Injury Frequency (LTIF) by 10% overa two-year period, a reduction of approx 30% in2009/<strong>2010</strong> then a further 15% in <strong>2010</strong>/<strong>2011</strong>.• Staff at high risk for manual handling injuriesparticipated in a manual handling project.• Staff in supervisory roles completed SafetyLeadership training.• A significant reduction in plant and motor vehicleaccidents.• Increased Personal Protective Equipment (PPE)compliance through robust training of staff andauditing processes.Safe Work Australia Week<strong>Council</strong> staff participated in a series of events forsafe work week including:• safety culture surveys• safe team and safety initiative awards• messages of inspiration from a WorkCoverparalympian• a children’s drawing competition where theimages were published in the <strong>2011</strong> SafetyCalendar.
112<strong>City</strong> of <strong>Lake</strong> <strong>Macquarie</strong>- <strong>Annual</strong> <strong>Report</strong> <strong>2010</strong>/<strong>2011</strong>OHS PERFORMANCE<strong>Council</strong> saw significant reductions in all injury types during <strong>2010</strong>/<strong>2011</strong>. Compared to theprevious financial year, lost time injuries decreased by 29% and the severity of injury reduced.The following graph shows the 12-month average of Lost Time Injuries Frequency Rate(LTIFR) and Medical Treatment Injuries Frequency Rate (MTIFR) per 1 million hours worked,over the past two years:
Our Organisation 113External Bodies Exercising<strong>Council</strong> FunctionsHunter Resource Recovery Pty Ltd (HRR) is the provider of <strong>Council</strong>’s kerbside recycling service. It is jointly ownedand operated by <strong>Lake</strong> <strong>Macquarie</strong>, Cessnock, and Maitland councils. HRR manages the kerbside recyclingcollection services contract with Solo Resource Recovery and the subsequent recyclables processing byVisy Recycling.Hunter Integrated Resources Pty Ltd (HIR), was established to administer the Hunter Region Waste Projecton behalf of the member councils - <strong>Lake</strong> <strong>Macquarie</strong>, Cessnock, Maitland, and Newcastle. The Waste Projectterminated in 2009, however the HIR company structure is being retained should a regional waste managementapproach become desirable in the future.<strong>Council</strong> delegated the authority to external parties for the following functions:1. The care, control, and management of community halls and centresFACILITYCardiff Senior Citizens CentreDudley Senior Citizens CentreHolmesville Community HallJohn Young Community HallMarks Point Community HallRathmines Community HallUlinga Park Community HallWindale Community HallWyee Community HallEXTERNAL BODYCardiff Senior Citizens IncDudley Combined Pensioners and Senior Citizens IncHolmesville Community Hall Operating CommitteeJohn Young Community Hall Operating CommitteeMarks Point Community Hall Operating CommitteeRathmines Community Hall Operating CommitteeUlinga Youth Centre IncWindale Community Hall Operating CommitteeWyee Community Hall Operating Committee
114<strong>City</strong> of <strong>Lake</strong> <strong>Macquarie</strong>- <strong>Annual</strong> <strong>Report</strong> <strong>2010</strong>/<strong>2011</strong>2. The care, control, and management of sporting and recreational facilitiesFACILITYAitchison ReserveAlan Davis FieldAndy Bird FieldAuston Oval and Bernie Goodwin ReserveAwaba OvalBahloo ReserveBalcomb FieldBarton FieldBaxter FieldBelmont <strong>Macquarie</strong> Tennis CourtsBill Bower OvalBlacksmiths OvalBlacksmiths Tennis ClubBolton Point Tennis CourtsCahill OvalCarbeen Street FieldCardiff No.1 OvalCardiff No. 2 OvalCardiff No. 3 OvalCardiff Park Tennis CourtsCaves Beach Netball CourtsCaves Beach Tennis CourtsChapman OvalCharlestown OvalCooranbong Recreation and Equestrian ReserveCroft OvalCroudace Bay Sports ComplexDora Creek OvalsEdgeworth OvalsEleebana OvalEleebana Tennis CourtsErnie Calland FieldsEvans ParkFassifern OvalEXTERNAL BODYBelmont Swansea Junior Soccer Club IncGateshead Ovals Community Operating CommitteeKahibah Ovals Community Operating CommitteeMorisset United Football Club IncAwaba Oval Community Operating CommitteeBahloo Reserve Community Operating CommitteeJohn Balcomb Field Community Operating CommitteeBelmont Ovals Community Operating CommitteeBaxter Field Community Operating CommitteeBelmont <strong>Macquarie</strong> Tennis Club IncGlendale Ovals Community Operating CommitteeBelmont Swansea United Football Club IncBlacksmiths Tennis Club IncBolton Point Tennis Club IncBelmont Ovals Community Operating CommitteeSkiffy Athletics Baseball Club IncCardiff Ovals Community Operating CommitteeCardiff Ovals Community Operating CommitteeCardiff Ovals Community Operating CommitteeCardiff Park Tennis Club IncCaves Beach Netball IncCaves Beach Tennis Club IncSwansea Soccer Club IncCharlestown <strong>City</strong> Blues IncCooranbong Recreation and Equestrian Reserve Community Operating CommitteeBlackalls Park Ovals Community Operating CommitteeValentine Eleebana Netball Inc; Valentine Eleebana JRLFC Inc; Valentine EleebanaSoccer Club Inc; Valentine Tennis Club IncDora Creek Ovals Community Operating CommitteeEdgeworth Ovals Community Operating CommitteeValentine Eleebana Soccer Club IncEleebana Tennis Club IncGateshead Ovals Community Operating CommitteeCardiff Junior Football Club IncWestlakes Archers Inc.
Our Organisation 1152. The care, control, and management of sporting and recreational facilitiesFACILITYFeighan OvalFinnan Oval/Water Board OvalFred Wright OvalGibson FieldGregory Park/Les Wakeman FieldHarold Knight OvalHillsborough OvalHillsborough Tennis CourtsHolford OvalHolmesville OvalHolmesville Tennis CourtsHunter Barnett FieldsJack Neave Fields (Ulinga Sporting Complex)Jack Stewart Netball CourtsJohn Street FieldJohnston ParkKeith Barry OvalKindyerra Reserve/Jack Edwards Fields<strong>Lake</strong> <strong>Macquarie</strong> <strong>City</strong> Petanque<strong>Lake</strong>lands Oval<strong>Lake</strong>lands Tennis CourtsLance York FieldLenaghan OvalLiles OvalLisle Carr FieldLumston FieldLydon Field<strong>Macquarie</strong> FieldMarks OvalMarks Oval Tennis CourtsMartinsville OvalMichael Bird FieldMick Middleton FieldMiller FieldEXTERNAL BODYFeighan Oval Community Operating CommitteeBlackalls Park Ovals Community Operating CommitteeMick Middleton and Fred Wright Ovals Community Operating CommitteeSouthern <strong>Lake</strong>s Rugby Union Club IncGregory Park Community Operating CommitteeHighfields Azzuri Football Club Inc, Charlestown <strong>City</strong> Blues Football Club IncCardiff Junior Australian Football Club IncHillsborough Tennis Club IncSouthern Beaches Rugby Union Club Inc, Central Charlestown JuniorRugby League Football Club IncHunter Christian Churches Football IncHolmesville Tennis Community Operating CommitteeWindale Ovals Community Operating CommitteeSouth Cardiff Senior Football Club IncCharlestown Netball Association IncWarners Bay Soccer Club IncWest Wallsend Senior Soccer Club LtdKeith Barry Ovals Community Operating CommitteeArgenton United Junior Soccer Club Inc<strong>Lake</strong> <strong>Macquarie</strong> <strong>City</strong> Petanque Club IncWarners Bay Soccer Club IncNewcastle and <strong>Lake</strong> <strong>Macquarie</strong> Wheelchair Tennis Club Inc.Garden Suburb Soccer Club IncBelmont North Rugby League Football Club Inc, Belmont North Netball Club Inc.Charlestown <strong>City</strong> Blues Football Club IncHighfields Azzuri Football Club IncBelmont Ovals Community Operating CommitteeDudley Redhead United Soccer Club Inc<strong>Lake</strong> <strong>Macquarie</strong> <strong>City</strong> Football Club IncBelmont Football Club LtdMarks Oval Tennis Community Operating CommitteeMartinsville Oval Community Operating CommitteeWindale Ovals Community Operating CommitteeMick Middleton and Fred Wright Ovals Community Operating CommitteeBelmont Ovals Community Operating Committee
116<strong>City</strong> of <strong>Lake</strong> <strong>Macquarie</strong>- <strong>Annual</strong> <strong>Report</strong> <strong>2010</strong>/<strong>2011</strong>2. The care, control, and management of sporting and recreational facilitiesFACILITYMolly Smith Netball CourtsMount Hutton Tennis CourtsNancy Dwyer and Ken Booth Netball CourtsNeegulbah ParkNew Tredinnick FieldsOld Tredinnick/NorthlakesParbury ParkPeacock FieldPendlebury OvalPickering OvalRathmines OvalRathmines Tennis CourtsReay ParkRedhead Tennis CourtsRiawenna ParkRon Hill OvalSt John OvalSwansea Equestrian GroundSwansea South Tennis CourtsTaylor ParkTodd Street OvalTulkaba ParkUlinga Park - Tennis and Netball CourtsWalters ParkWangi Netball CourtsWangi OvalWarners Bay Netball CourtsWest Wallsend Tennis CourtsWhitebridge Tennis CourtsWindale Tennis CourtsWoodrising Netball CourtsWyee Community Tennis CourtsEXTERNAL BODY<strong>Lake</strong>side Netball Association IncMount Hutton Tennis Club IncCardiff Netball Club IncCardiff and District Little Athletics Centre Inc<strong>Lake</strong> <strong>Macquarie</strong> Junior Soccer Club Inc<strong>Macquarie</strong> Football LimitedParbury Park Community Operating CommitteeToronto Ovals Community Operating CommitteePendlebury Ovals Community Operating CommitteePickering Oval Community Operating CommitteeWestlakes Junior Soccer Club IncRathmines Tennis Club IncReay Park Community Operating CommitteeRedhead Tennis Club IncCharlestown Junior Cricket Club IncRon Hill Oval Community Operating CommitteeSt John Oval Community Operating CommitteeSwansea Horse and Riders Club IncSwansea South Tennis Club IncTaylor Park Community Operating CommitteeBlackalls Park Ovals Community Operating Committee<strong>Lake</strong> <strong>Macquarie</strong> Australian Football Club IncUlinga Youth Centre IncWalters Park Community Operating CommitteeWestlakes District Netball Association IncWangi Oval Community Operating CommitteeWarners Bay Netball IncWest Wallsend Tennis Club IncWhitebridge Tennis Club IncWindale Tennis Community Operating CommitteeBolton Point, Fennell Bay Netball Club IncWyee Community Hall Community Operating Committee
Our Organisation 117Controlling Interestin Companies<strong>Council</strong> holds no controlling interest in companies.Overseas Visitsposition destination purpose notes dateactualcostBusiness Analyst,DevelopmentAssessment andComplianceQueenstown,New ZealandAttendance of the <strong>2011</strong>Infor User Forum –Reviewing new directions/functionality within thePathway system as wellas participate in generalworkshops to discussbest practice processes/uses of the system’sexisting functionality20 – 23September<strong>2010</strong>$480.00General ManagerGoroka, Papua NewGuineaTo assist Hunter <strong>Council</strong>sscope a potential bestpractice developmentproject for Goroka District<strong>Council</strong>Funded by theCommonwealth LocalGovernment GoodPractice Scheme- Pacific Project16-18February<strong>2011</strong>$0.00Director <strong>City</strong>StrategyGoroka, Papua NewGuineaTo assist Hunter <strong>Council</strong>sscope a potential bestpractice developmentproject for Goroka District<strong>Council</strong>Funded by theCommonwealth LocalGovernment GoodPractice Scheme- Pacific Project16-18February<strong>2011</strong>$0.00Manager IntegratedPlanningUniversity of SingaporeAttendance at the 5thInternational Forum onUrbanism – investigationof opportunities and risksfrom sustainable urbandevelopment24 – 27February<strong>2011</strong>$2,100.00Director CommunityDevelopmentWellington, Aucklandand Tauranga,New ZealandScoping visit for AssetManagement Plans/Maturity Audits28 March-1 April<strong>2011</strong>$1,560.40CoordinatorDrainage andNatural Areas, AssetManagementWellington, Aucklandand Tauranga,New ZealandScoping visit for AssetManagement Plans/Maturity Audits29 March-1 April<strong>2011</strong>$1,560.40Coordinator Parksand Reserves, AssetManagementWellington, Aucklandand Tauranga,New ZealandScoping visit for AssetManagement Plans/Maturity Audits30 March-1 April<strong>2011</strong>$1,560.40
118<strong>City</strong> of <strong>Lake</strong> <strong>Macquarie</strong>- <strong>Annual</strong> <strong>Report</strong> <strong>2010</strong>/<strong>2011</strong>ComplaintsHandling Policy<strong>Council</strong> acknowledges it cannot meet customerneeds without first listening to what they have to say.<strong>Council</strong> has implemented a feedback managementframework after adopting a Complaints and FeedbackManagement Policy in 2006.<strong>Council</strong> welcomes customer feedback about theservices we provide, the decisions we make, ourpolicies and procedures, our facilities, the items wesell, our employees, agents, and contractors. Monthlyreports on community feedback help us to identify areasrequiring improvement.The following graph shows a comparison of thenumber of complaints and compliments received forthe years 2009/<strong>2010</strong> and <strong>2010</strong>/<strong>2011</strong>.Feedback Received Comparison09/10 and 10/11 YearsComplaints10/11 Yr 09/10 Yr372409Documentation that supports the feedbackmanagement framework includes the following:Complaints and Feedback Management PolicyCompliments311396Staff Handling and Training GuidelinesInformation brochure available at <strong>Council</strong>’sAdministration Building, libraries, swimming centres,art gallery, and community centresOnline form for making a complaint, reporting issues,offering a compliment, or providing general feedback0 100200 300 400 500Privacy andPersonal InformationProtection ActTo ensure compliance with the Privacy and Personal Information Act 1998, <strong>Council</strong>:deals with personal information collected in accordance with the Act;maintains and adheres to a Privacy Management Plan;has modified individual records on application for suspension of personal information.<strong>Council</strong> has received two formal applications from customers regarding an alleged breach to their privacy. Afterconducting internal privacy reviews for each application, <strong>Council</strong> determined that breaches of the privacy principlesdid occur. In each occurrence, <strong>Council</strong> notified the NSW Privacy Commissioner, sent a formal apology to theapplicants, and provided feedback and training to staff.
Our Organisation 119GOVERNMENTINFORMATION (PUBLICACCESS) ACT 2009The Government Information (Public Access) Act 2009 (GIPA Act) gives the public a general right to accessinformation held by <strong>Lake</strong> <strong>Macquarie</strong> <strong>City</strong> <strong>Council</strong>, limited only by legitimate public interest considerations againstdisclosure.<strong>Lake</strong> <strong>Macquarie</strong> <strong>City</strong> <strong>Council</strong> makes a great deal of information available to the public through the website, a rangeof publications, and the many exhibitions at the Customer Service Centre and our city libraries.Examples of information available on <strong>Council</strong>’s website include:agendas, business papers and minutes of <strong>Council</strong> meetings;policy documents;information about development applications;operational plan; andresults of community surveys.The following tables provide statistical Information about Formal Access Applications under the GIPA Act.Table A: Number of applications by type of applicant and outcome*Accessgrantedin fullAccessgrantedin partAccessrefusedin fullInformationnot heldInformationalreadyavailableRefuse todeal withapplicationRefuse toconfirm/denywhether informationis heldApplicationwithdrawnMedia 0 0 0 0 0 0 0 0Members ofParliamentPrivate sectorbusinessNot for profitorganisations orcommunity groupsMembers of thepublic (application bylegal representative)Members of thepublic (other)0 0 0 0 0 0 0 06 8 0 1 0 0 0 00 1 0 0 0 0 0 02 1 0 0 0 0 0 021 13 1 2 0 1 0 1* More than one decision can be made in respect of a particular access application. If so, a record must be madein relation to each decision. This also applies to Table B.
120<strong>City</strong> of <strong>Lake</strong> <strong>Macquarie</strong>- <strong>Annual</strong> <strong>Report</strong> <strong>2010</strong>/<strong>2011</strong>Table B: Number of applications by type of application and outcomeAccessgrantedin fullAccessgrantedin partAccessrefusedin fullInformationnot heldInformationalreadyavailableRefuse todeal withapplicationRefuse toconfirm/denywhether informationis heldApplicationwithdrawnPersonal informationapplications*Access applications(other than personalinformationapplications)Access applicationsthat are partlypersonal informationapplications andpartly other0 0 0 0 0 0 0 013 10 0 3 0 1 0 016 13 1 0 0 0 0 1* A personal information application is an access application for personal information (as defined in clause 4 ofSchedule 4 to the GIPA Act) about the applicant (the applicant being an individual).Table C: Invalid applicationsReason for invalidityNumber of applicationsApplication does not comply with formal requirements (section 41 of the Act) 2Application is for excluded information of the agency (section 43 of the Act) 0Application contravenes restraint order (section 110 of the Act) 0Total number of invalid applications received 2Invalid applications that subsequently became valid applications 2Table D: Conclusive presumption of overriding public interest againstdisclosure: matters listed in Schedule 1 to ActNumber of timesconsideration used*Overriding secrecy laws 0Cabinet information 0Executive <strong>Council</strong> information 0Contempt 0Legal professional privilege 1Excluded information 0Documents affecting law enforcement and public safety 0Transport safety 0Adoption 0Care and protection of children 0Ministerial code of conduct 0Aboriginal and environmental heritage 0* More than one public interest consideration may apply in relation to a particular access application and, if so,each consideration is to be recorded (but only once per application). This also applies to Table E.
Our Organisation 121Table E: Other public interest considerations against disclosure:matters listed in table to section 14 of ActNumber of occasions whenapplication unsuccessfulResponsible and effective government 0Law enforcement and security 18Individual rights, judicial processes, and natural justice 8Business interests of agencies and other persons 3Environment, culture, economy, and general matters 0Secrecy provisions 0Exempt documents under interstate Freedom of Information legislation 0Table F: TimelinessNumber of applicationsDecided within the statutory timeframe (20 days plus any extensions) 56Decided after 35 days (by agreement with applicant) 0Not decided within time (deemed refusal) 1Total 57Table G: Number of applications reviewed under Part 5 of the Act(by type of review and outcome)Decision varied Decision upheld TotalInternal review 1 1 2Review by Information Commissioner* 0 1 1Internal review following recommendation under section 93 of Act 0 0 0Review by Administrative Decisions Tribunal 0 0 0Total 1 2 3* The Information Commissioner does not have the authority to vary decisions, but can make recommendations tothe original decision-maker. The data in this case indicates that a recommendation to vary or uphold the originaldecision has been made by the Information Commissioner.Table H: Applications for review under Part 5 of the Act(by type of applicant)Number of applications for reviewApplications by access applicants 1Applications by persons to whom information the subject of access application relates(see section 54 of the Act)1
122<strong>City</strong> of <strong>Lake</strong> <strong>Macquarie</strong>- <strong>Annual</strong> <strong>Report</strong> <strong>2010</strong>/<strong>2011</strong>Partnerships, Cooperativesand Joint VenturesJoining forces with other organisations and groups is an efficient way for us to offer services and deliver programs.It also brings economic and social benefits to all parties involved. Below is a list of programs we have in place inpartnership with other groups and organisations.ProgramNameSharps CollectionServiceParticipants with<strong>Lake</strong> <strong>Macquarie</strong><strong>City</strong> <strong>Council</strong>Various pharmaciesdescription<strong>Council</strong> installed and services three public sharps disposal bins (initiallyprovided by NSW Hunter New England Health), and participating localpharmacies collect sharps, which <strong>Council</strong> disposes of safely.ChemicalCleanOutNSW Office of Environment andHeritageResidents are encouraged to drop off their household chemical waste to<strong>Council</strong>’s Teralba Worm Farm on a designated weekend in May each year.MobileMusterShowerheadExchange ProgramHunter WasteEducation Group(HWEG)Second HandSaturdays andeWaste collectionAustralian MobileTelecommunications AssociationHunter Water CorporationInitiative involving local councils:Cessnock, <strong>Lake</strong> <strong>Macquarie</strong>,Maitland, Newcastle, PortStephens, and Singleton.Hunter Resource Recovery (HRR)Recycling of unused mobile phones and accessories is available to residentsat <strong>Council</strong>’s Administration Building and Swansea Library.Hunter Water and <strong>Council</strong> invited residents and staff to exchange theirexisting showerheads for water efficient versions. Residents were given twooptions: a standard showerhead (free of charge) or a premium showerhead(an additional charge applied).HWEG members work together to identify, develop, and foster regionalpartnership opportunities for member organisations. Recent projectsorganised by HWEG include Waste as Art and the 7 Wicked Wastescampaign.HRR provides a permanent eWaste drop off location as well as collectionson specified Second Hand Saturdays. All electrical items, with the exceptionof white goods, are accepted and household items are recycled through theLife Cycle program included in the Second Hand Saturday events.Clean Up AustraliaDaySmart Grid Smart<strong>City</strong> ConsortiumVirtual PowerStation (VPS) TrialSustainabilityAdvantage ClusterSupportHome PowerSaving ProgramClean UpAusgridCSIROOffice of Environment and Heritage(OEH)Office of Environment and Heritage(OEH)10:10 Challenge Energy Australia (now Ausgrid),<strong>Lake</strong> <strong>Macquarie</strong> Youth <strong>Council</strong><strong>Council</strong> participates in Clean Up Australia Day and works with communitiesto clean up, fix up, and conserve our environment.The Smart Grid, Smart <strong>City</strong> Program, initiated and sponsored by theAustralian Government, will test innovations in digital telecommunications,sensing and metering infrastructure, and their interaction with the existingelectricity network and the community.The VPS trial involves interconnecting 20 solar photovoltaic (PV) systems,in <strong>Lake</strong> <strong>Macquarie</strong> households and <strong>Council</strong> facilities to work together toprovide a single, large, stable amount of electricity in the same way as aconventional power station. The aim of the trial is to improve the economics,effectiveness, and uptake of small renewable generators like solar PV andwind turbines.On behalf of OEH, <strong>Council</strong> coordinated the <strong>Lake</strong> <strong>Macquarie</strong> SustainabilityAdvantage (SA) cluster, holding regular cluster meetings and assistingbusinesses progress though the SA modules and thereby reach bronze andsilver recognition levels.<strong>Council</strong> promoted this State Government program, which provides a freeservice to low income residents to assess their energy use and provide themwith power saving recommendations and an energy and water saving kit.Energy Australia trained <strong>Lake</strong> <strong>Macquarie</strong> <strong>City</strong> <strong>Council</strong> librarians in homeenergy efficiency measures to enable them to advise library customers. Alsopromoted the “One million women” campaign, which encourage womento make sustainability commitments over a 12 month period. <strong>Council</strong> alsoassisted the <strong>Lake</strong> <strong>Macquarie</strong> Youth <strong>Council</strong> to promote the 10:10 Challengeand mobile phone recycling to high schools.
Our Organisation 123ProgramNameParticipants with<strong>Lake</strong> <strong>Macquarie</strong><strong>City</strong> <strong>Council</strong>descriptionPlace Making andUrban RenewalForumBrighter FuturesEarly InterventionProgramGlendale TAFE-Play sessionpartnership with<strong>Lake</strong> <strong>Macquarie</strong>Family Day CareEmployerSponsoredAgreementpriorityof access<strong>Lake</strong> <strong>Macquarie</strong><strong>Annual</strong> SeniorsProgramInternational Dayfor People with aDisabilityThe Place:CharlestownCommunity CentreOperation BounceBackGraffiti HotspotProgramGraffiti Action DayNewcastle <strong>City</strong> <strong>Council</strong>, PortStephens <strong>Council</strong>, Maitland<strong>Council</strong>, L!vesitesSamaritans, <strong>Lake</strong> <strong>Macquarie</strong>Family Day Care, MercyCommunity Services, EastlakeFamily Support, Newcastle FamilyDay Care, CentaCare, NewcastleSettlement ServicesHunter TAFE – Glendale –Children’s Services and <strong>Lake</strong><strong>Macquarie</strong> Family Day CareHunter New England Area Healthand <strong>Lake</strong> <strong>Macquarie</strong> Family DayCareUnitingCare Ageing HunterDisability Network HunterNewcastle <strong>City</strong> <strong>Council</strong>The GPT GroupNational Motor Vehicle TheftReduction <strong>Council</strong>NSW Department of AttorneyGeneral and Justice, Departmentof Juvenile Justice, <strong>Lake</strong><strong>Macquarie</strong> Local Area PoliceCommandKeep Australia Beautiful NSWand <strong>Lake</strong> <strong>Macquarie</strong> businesschambersThis is a joint initiative to present an Arts Forum focussed on place makingand urban renewal in the Hunter region with multiple speakers andparticipants.<strong>Lake</strong> <strong>Macquarie</strong> Family Day Care provides child care for families in theBrighter Futures program. An early intervention support service led bySamaritans in partnership with agencies provides support for families to buildstrength and resilience for optimal long-term benefits.Hunter TAFE - Glendale provides best practice play session opportunities for<strong>Lake</strong> <strong>Macquarie</strong> Family Day Care educators and their children in a purposebuilt training facility.<strong>Lake</strong> <strong>Macquarie</strong> Family Day Care provides employer sponsored placementfor Hunter New England Area Health employees under a priority of accessprogram.This is a free program (sponsored by UnitingCare Ageing Hunter) forresidents aged 55 years and over. It focuses on health, safety, and wellbeing.<strong>Council</strong> is a partner in the coordination of a regional program for InternationalDay for People with a Disability (IDPWD). The program included a fun day inthe park, and an exhibition of work by artists with a disability.Charlestown’s new community centre is a positive investment in thecommunity’s future, particularly for Charlestown and surrounding areas. Thegoverning committee and management model for the facility consists of apartnership between <strong>Lake</strong> <strong>Macquarie</strong> <strong>City</strong> <strong>Council</strong>, The GPT Group, and thecommunity. This model is a new initiative for <strong>Lake</strong> <strong>Macquarie</strong> <strong>City</strong> <strong>Council</strong>.A motor vehicle theft reduction program was implemented from April toJune <strong>2011</strong>. This program involved raising public knowledge about motorvehicle theft in <strong>Lake</strong> <strong>Macquarie</strong> through media campaigns, public educationworkshops, and the distribution of 100 engine immobilizers aimed at vehicleslisted as high risk of theft (pre-2000 models).With funds being provided by the NSW Attorney General’s department, <strong>Lake</strong><strong>Macquarie</strong> <strong>City</strong> <strong>Council</strong> (LMCC) established a positive partnership with theNSW Department of Juvenile Justice (DJJ) to complete graffiti clean up andvegetation plantings in identified graffiti hotspots. Utilising their CommunityService Orders program, LMCC and DJJ have already cleaned up manyprivate properties and public places in graffiti hotspots locations, identified by<strong>Lake</strong> <strong>Macquarie</strong> Local Area Police Command.<strong>Council</strong> took the lead in the annual Graffiti Action Day in <strong>Lake</strong> <strong>Macquarie</strong>on Sunday 15 May <strong>2011</strong> by coordinating the supply of cleaning equipmentand chemicals from Keep Australia Beautiful NSW. With the support of localbusiness chambers and community members who enlisted volunteers, manygraffiti tags were removed from several localities.<strong>Council</strong>s Online Wyong and Hornsby council’s The participating councils share a common platform of corporate informationsystems, which includes the supply of computer software and hardware.These systems are hosted at an external data centre and are fully managedby Capgemini.Sports facility Hunter Sports Centre The Hunter Sports Centre is owned by <strong>Council</strong> but controlled bya community-based committee involving <strong>Council</strong> representatives,representatives of regional state athletics and gymnastic bodies, as well as anumber of community representatives.
124<strong>City</strong> of <strong>Lake</strong> <strong>Macquarie</strong>- <strong>Annual</strong> <strong>Report</strong> <strong>2010</strong>/<strong>2011</strong>Environmental Planning& Assessment Act 1979As an alternative way of collecting and using developer contributions (Section 94 Contributions), <strong>Council</strong> can enterinto a planning agreement with a developer. A planning agreement may prescribe for the developer to contributefunds for public infrastructure, land, or the provision of other public facilities and infrastructure.Planning Agreements in Force During the <strong>2010</strong>/<strong>2011</strong> Financial YearDateAgreementMadeRelatedDevelopment29 May 2008 DA/2744/2005 andamendments - bulkygoods showrooms,restaurant, HillsboroughRd Warners Bay (BB RetailCapital Pty Limited)Agreement DetailsThe planning agreement provides for the developer to undertake the installation oftraffic signals and associated road works in accordance with the <strong>Lake</strong> <strong>Macquarie</strong>Section 94 Contributions Plan No 6 2007- Hillsborough Rd. Estimated cost ofworks included in this agreement is $2,021,058.29 May 2008 DA/231/2007 -Charlestown Squareredevelopment (GPT RELimited)The planning agreement prescribes that a range of public benefits be providedrather than a monetary contribution towards centralised car parking provisionsand vehicular access facilities. Public benefits include: 3,200m 2 public car parkat Charlestown; 46 place child care centre at Highfields; playing field at St John'sOval, Charlestown; landscaping and new amenities at Charlestown Oval as wellas $500,000 towards landscape design; community room, youth facility, north andsouth piazza, bus shelters etc at Charlestown Square; $80,000 towards publicdomain improvements; $50,000 toward public art; $10,000 toward conservation ofthe Pickering Collection; new roads, bus and pedestrian facilities near CharlestownSquare and remediation of Winding Creek, Charlestown. A further $500,000 isprovided for Charlestown Open Space Endowment Fund.3 June 2008 Rezoning of land atNorthlakes Drive, CameronPark - Residential landsubdivision (North <strong>Lake</strong>sPty Limited)The planning agreement prescribes that the developer transfer to <strong>Council</strong>102.44ha of land for conservation purposes.26 November 2008 Rezoning of land at NorthCooranbong - Residentialland subdivision (JohnsonProperty Group PtyLimited)5 February <strong>2010</strong> DA/1313/2007Supermarket and specialtyshops at Swansea (FabcotPty Limited)3 March 2009 Rezoning of land at 270Fishery Point Rd, BonnellsBay - Residential landsubdivision (StannicSecurities Pty Limited)17 May <strong>2010</strong> DA/1604/2008-7Storey commercial andretail building (TemplarCharlestown Pty Limited)The planning agreement prescribes a range of public benefits in the form of landdedication, capital works and cash contributions that include the following: openspace land with an indicative value of $6.8m, recreation facilities with an indicativevalue of $23.4m, community facilities land and capital works with an indicativevalue of $6.9m, road works with an indicative value of $14.4m. It also prescribesthe dedication of 119.24ha of conservation land and payment of endowment fundmonies approximately $1m relating to this environmental corridor. The developerwill be required to prepare a rehabilitation and maintenance plan for the area.The developer will be required to provide a maintenance schedule for five yearsfor the following facilities once completed: on site neighbourhood park, on sitesports facility and dog exercise park, north and south local parks, town commonneighbourhood park and sports facility area, and a multipurpose centre.The amended planning agreement relates only to minor changes, and still providesfor a land exchange resulting in the transfer of an additional 1,330m 2 of land to<strong>Council</strong>: construction of car parking spaces including kerb and guttering, paving,landscaping, lighting and car park stormwater works and the provision of two busshelters.The planning agreement prescribes that the developer dedicates to <strong>Council</strong> anarea of conservation land and provides a management plan for that area. Thedeveloper shall be responsible for the rehabilitation and maintenance of that areafor a period of three years.The planning agreement provides for the developer to pay to <strong>Council</strong> a monetarycontribution of approximately $455,482.45 in lieu of providing some of the carparking spaces required as a result of the development on the site. The developeris also required to pay approximately $6,832.24 for administration costs.
Our Organisation 125Contributions andDonationsOrganisation event/activity DonationCash $ <strong>Council</strong> Services $Aboriginal Association - Koorana Community Cultural and Sporting Assistance Program 690.00 206.00Aged and Disability Subsidised rent for community leases 76,802.00Alzheimers Australia NSW Heart to Art classes 1,552.00Belmont Chamber of Commerce -<strong>Lake</strong>festCommunity Cultural and Sporting Assistance Program 2,000.00Belmont Ovals Board Ovals Board Support 16,970.00Bill Turner CupFinancial assistance for the hire of Jack McLaughlanFootball Ground Edgeworth for the School BoardSoccer competition Bill Turner Cup and Bill TurnerTrophy389.00Boatfest Association Community Cultural and Sporting Assistance Program 2,000.00 5,000.00Catalina Festival Community Cultural and Sporting Assistance Program 308.00 1,692.00Catherine Hill Bay Bowling ClubFinancial assistance for the annual Dick Hooey SurfLifesaving Charity Day. Money raised from the daygoes to surf rescue equipment for the four local <strong>Lake</strong><strong>Macquarie</strong> branch surf clubs1,000.00Catherine Hill Bay Surf Life SavingClub IncCatherine Hill Bay Surf Life SavingClub IncContribution to Surf Club maintenance costs 12,000.00Contribution to Surf Club rescue equipment 6,500.00Caves Beach Surf Life Saving Club Contribution to Surf Club maintenance costs 12,000.00Caves Beach Surf Life Saving Club Contribution to Surf Club rescue equipment 6,500.00Child Care Centres Subsidised rent 346,120.00Clubs Subsidised rent for various leases 221,309.00Community Drug Action Team Free room hire 417.60Community Groups Subsidised rent 489,641.00Community Safety PrecinctCommitteeFree room hire 278.40Coon Island Management BoardAssistance for the ongoing maintenance ofCoon Island Reserve1,000.00Cooranbong Chamber ofCommerce - CarolsCommunity Cultural and Sporting Assistance Program 1,525.00 475.00Crime Prevention Partnership Free room hire 626.40Dobell House Festival Community Cultural and Sporting Assistance Program 1,152.00 848.00Dora Creek Public School Environmental Education Grant 3,000.00Eastlakes Youth Centre - Yellfest Community Cultural and Sporting Assistance Program 1,000.00 420.00
126<strong>City</strong> of <strong>Lake</strong> <strong>Macquarie</strong>- <strong>Annual</strong> <strong>Report</strong> <strong>2010</strong>/<strong>2011</strong>Organisation event/activity DonationCash $ <strong>Council</strong> Services $Filipino-Australian Society of theHunter Valley Inc.Friends of Belmont CemeteryReimbursement of DA and CC fees for constructionwork undertaken at their hall at BoolarooAssistance for ongoing care to Belmont Southcemetery grounds1,000.001,000.00GG Management Pty Ltd <strong>Lake</strong> <strong>Macquarie</strong> Running Festival 1,000.00Hunter Academy of Sport Donations/contributions to local regional bodies 7,500.00Hunter Academy of SportFinancial assistance for Hunter Region Sporting Hallof Fame. The Hunter Region Sporting Hall of Famerecognises past sporting champions from all parts ofthe Hunter Region. The donation went towards thecost ofongoing inductions held annually during May1,000.00Hunter Institute of TAFE Donations/contributions to Local Regional Bodies 4,000.00Hunter Sports Centre Community Cultural and Sporting Assistance Program 4,100.00Hunter Valley ResearchFoundation<strong>Lake</strong> <strong>Macquarie</strong> Band LiaisonCommittee<strong>Lake</strong> <strong>Macquarie</strong>Family History BookDonations/contributions to local regional bodies 18,000.00<strong>2010</strong> Band Liaison Committee contribution 8,000.00Publication of Journal and Local History Book 1,000.00Landcare Nursery, School, and Contractor support 63,000.00Landcare Dune management 70,000.00Landcare Weed management 135,000.00Marine Rescue NSWFinancial assistance to cover park hire and rubbishremoval fees for their annual Gala Open Day at Pelican435.00Morisset and District AgriculturalSociety - Morisset Ag ShowMorisset Chamber of Commerce -Southlakes XmasCommunity Cultural and Sporting Assistance Program 2,000.00Community Cultural and Sporting Assistance Program 2,000.00Morisset Swim Centre Rebate on water and sewer charges 4,083.00Newcastle/<strong>Lake</strong> <strong>Macquarie</strong>Dementia Advisory Service(Hunter New England Health)Newcastle/<strong>Lake</strong> <strong>Macquarie</strong>Dementia Advisory Service(Hunter New England Health)Newcastle/<strong>Lake</strong> <strong>Macquarie</strong>Dementia Advisory Service(Hunter New England Health)Charlestown Carer's Support Group - cost of hiringmeeting room at Charlestown Multipurpose Centre for11 months at $28 per monthBelmont Carer's Support Group - cost of hiringmeeting room at Belmont Library for 11 months at $30per monthBelmont Living with Memory Loss Support Group- cost of hiring meeting room at Belmont DistrictMasonic Centre for 11 months at $30 per month308.00330.00330.00NSW Dept of Education andTraining - StarstruckDonations/contributions to local regional bodies 5,000.00Opera Hunter Community Cultural and Sporting Assistance Program 5,000.00Redhead Community Library Assistance for Redhead Community Library 1,000.00Redhead Surf Life Saving Club Contribution to Surf Club maintenance costs 12,000.00
Our Organisation 127Organisation event/activity DonationRedhead Surf Life Saving Club Contribution to Surf Club rescue equipment 2,500.00Cash $ <strong>Council</strong> Services $Resident assistanceAdditional recycling and garbage service fordialysis patient320.85Resident assistance Additional recycling service for dialysis patient 65.00Resident assistanceAdditional garbage service for person with adisability320.85Scouts and Guides Subsidised rent 44,640.00St Patricks and St BrigidCemetary TrustLocal Heritage Assistance Fund Grant Payment- Cooranbong Catholic Cemetary2,500.00Suicide Prevention Network Free room hire 835.20Swansea Belmont Surf Lifesaving Club Contribution to Surf Club maintenance costs 12,000.00Swansea Belmont Surf Lifesaving Club Contribution to Surf Club rescue equipment 6,500.00Swansea Chamber of Commerce -CarolsSwansea Chamber of Commerce -NYESwansea Chamber of CommerceCommunity Cultural and Sporting AssistanceProgramCommunity Cultural and Sporting AssistanceProgramCommunity Cultural and Sporting AssistanceProgram1,596.00 1,427.14939.00 2,251.001,354.00Toronto Baptist Church Reimbursement of site shed fees 1,000UNISS Scholarships University fees 30,000.00UNISS Scholarships University fees 16,000.00Valentine Eleebana Cricket ClubFinancial assistance for the construction of anew cricket pitch at the western end of theCroudace Bay Sporting Complex500.00Valentine Hydrotherapy Pool Donations/contributions to local regional bodies 10,000.00Various not for profit organisations Donations/contributions to local regional bodies 15,423.70Various schools School Environment Awards 2,050.00Various not for profit communitygroups and schoolsEnvironmental Sustainability Grant 30,271.61Various not for profit organisations Local Heritage Assistance Fund Grant payment 11,996.00Various not for profit organisations Parks Board support 1,400.00Wangi Ridge Preservation BoardWarners Bay Chamber of Commerce- NYEAssistance for the ongoing preservation ofWangi RidgeCommunity Cultural and Sporting AssistanceProgram1,000.005,000.00 5,000.00WaterAid in Australia Showerhead Exchange 1,000.00West Wallsend Cemetery CommitteeAssistance for the ongoing maintenance ofWest Wallsend cemetery grounds1,000.001,465,384.01 304,013.74
128<strong>City</strong> of <strong>Lake</strong> <strong>Macquarie</strong>- <strong>Annual</strong> <strong>Report</strong> <strong>2010</strong>/<strong>2011</strong>legal proceedingsMatter Court Costs PaidCostsReceivedStatusAmar Local Court Court found in favour of <strong>Council</strong>. Penalty imposedand legal costs awarded.BeacherAdministrativeDecisions TribunalLegal fees $11,250Tribunal found in favour of <strong>Council</strong>. No furtheraction ordered by the Tribunal.Dilley Local Court Agreement reached with defendant on works to bedone or comply with order. Matter discontinued.Doyle Local Court Legal fees $6,000 Matter ongoing and listed for hearing in October<strong>2011</strong>.GoninanLand andEnvironment CourtConsultant’s fees $240Court fees $779Legal fees $8,547Matter ongoing and listed for hearing in September<strong>2011</strong>.MillgateLocal Court andDistrict Court ofNSW, Newcastle(Appeal)Court fees $296Legal fees $20,450Local Court found in favour of <strong>Council</strong>. Penaltyimposed and legal costs awarded. Appeal bydefendant lodged and is listed for hearing inDistrict Court in September <strong>2011</strong>.Nemeth Local Court Court found in favour of <strong>Council</strong>. (Dangerous DogDeclaration upheld) Legal Costs awarded.Rofiza PtyLtdLocal Court $600 Defendant pleaded guilty. Legal costs awarded to<strong>Council</strong>.TappourasLand andEnvironment CourtConsultant’s fees$56,312Legal fees $28,641Court approved development application afteramendments by the applicant. <strong>Council</strong> has anorder in its favour for costs apprising from theamendments.Wallace Local Court Ongoing matter listed for hearing in November<strong>2011</strong>.
130<strong>City</strong> of <strong>Lake</strong> <strong>Macquarie</strong>- <strong>Annual</strong> <strong>Report</strong> <strong>2010</strong>/<strong>2011</strong>Special Rate VariationOrdinary Rates - infrastructure, construction, and maintenanceIn June 2007, <strong>Council</strong> received approval of a special variation to increase its general income for the costsassociated with infrastructure, construction, and maintenance, as defined by <strong>Council</strong>.Through this special variation, <strong>Council</strong> raised $4,295,211 in <strong>2010</strong>/<strong>2011</strong>. The table below gives an overview of theprojects completed or commenced during <strong>2010</strong>/<strong>2011</strong> using these funds.Project Funding ActivitiesFootpaving andcycleway$500,000 • Croudace Bay Park• <strong>Lake</strong>side Drive, SwanseaBus stops and shelters $250,000 • Provision of shelters and reconstruction of bus stops to ensure compliance withDisability Discrimination Act (30% Compliance achieved 30 June <strong>2011</strong> – target 40%by 2013)Community projects $1,510,000 • <strong>City</strong> entry signage - $200,000• Construction of Fernleigh Track Stage 5 - $500,000• Chapman Oval - $510,000• Morisset PCYC - $300,000Road maintenance(mowing)Road maintenance(city appearance)Parks maintenance(mowing)$250,000 • Mowing progressively increased from four to five services per annum$325,000 • Road maintenance works progressively increased from four to five services per annum$275,000 • Mowing progressively increased from four to five services per annum with additionallocations addedPark maintenance $325,000 • Landscape area maintenance progressively increased to five servicesImprove standard of keyfacilities$305,000 • Maintenance standard progressively increased/ improved for major playgrounds andcommunity facilitiesOur Finances
Our Finances 131Project Funding ActivitiesTown CentreProgram$536,000 In <strong>2010</strong>/<strong>2011</strong>, the Town Centre Program provided funding to the seven town centres ofBelmont, Toronto, Warners Bay, Cardiff, Charlestown, Swansea, and Morisset totalling$536,000 (pre GST). This funding was disbursed to the chambers of commerce representingthe town centres, via a funding deed. Within the funding deed the individual chambers ofcommerce:1) Contracted the services of a town centre coordinator to develop and implement a businessplan. In <strong>2010</strong>/<strong>2011</strong> each centre contracted the services of a part-time town centrecoordinator.2) Formulated a business plan based on the priorities identified in the Town Centre <strong>Report</strong>, “AGuide to Town Centre 3-Year Strategic Plans”. In <strong>2010</strong>/<strong>2011</strong> each chamber formulated atown centre program business plan.3) Provided six monthly performance reports to <strong>Council</strong>. All reports for <strong>2010</strong>/<strong>2011</strong> are due to<strong>Council</strong> by February and August <strong>2011</strong>.4) Completed the town centre analysis (Commercial Centre Study) for <strong>2010</strong>. In <strong>2010</strong>/<strong>2011</strong>each centre completed the analysis.5) President of the chamber attended the <strong>Lake</strong> <strong>Macquarie</strong> Combined Chamber of Commercemeeting held bi-monthly at <strong>Council</strong>. In <strong>2010</strong>/<strong>2011</strong>, most meetings were attended by thechamber president or their representative (generally the town centre coordinator) for eachtown centre.6) Town centres completed a range of programs including centre market days, FaçadeImprovement program, web page updates, social marketing and merchandising courses.7) One village assisted with funding for strategic planning purposes.<strong>City</strong> BrandingStrategy$28,000 Phase II of the <strong>City</strong> Branding Strategy “Town Centre Personality Program” started in <strong>2010</strong>/<strong>2011</strong>in conjunction with town centres and Department of Trade and Investment.
132<strong>City</strong> of <strong>Lake</strong> <strong>Macquarie</strong>- <strong>Annual</strong> <strong>Report</strong> <strong>2010</strong>/<strong>2011</strong>Sustainability andEnvironment LevyIn 2009, the Minister for Local Government approved a special variation to increase general rates income. For the<strong>2010</strong>/<strong>2011</strong> financial year, this generated $2,103,708 for sustainability and environmental projects.This funding helped <strong>Council</strong> to:carry out on-ground work to protect and improve the health of <strong>Lake</strong> <strong>Macquarie</strong> and its catchment;raise community awareness about the importance of improving the environment; andimprove environmental sustainability of the city, focusing on water, energy, transport, waste, ecosystemenhancement, climate change adaptation, natural disaster risk minimisation, monitoring and reporting ofenvironmental performance and community engagement.The table below gives an overview of the work fully or partly funded by the special variation in <strong>2010</strong>/<strong>2011</strong>.Some of the allocated funds were not spent as delays in staff appointments in the previous financial year resultedin late commencement of some projects. These funds were held over for expenditure in the following financial year.ProjectFundsReceived$FundsSpent$ ActivitiesEcosystemenhancement works879,310 749,149 • Construction of stormwater treatment devices• Creek stabilisation and riparian vegetation works• Foreshore stabilisation and littoral vegetation• Ecosystem monitoring• Education and reporting• Saltmarsh and wetland improvement• Terrestrial and aquatic ecosystem enhancement• Terrestrial ecosystem rehabilitation• Coastal and estuary managementSustainable living 484,355 354,190 • Facilitate energy efficiency and renewable energy in <strong>Council</strong> operationsand across the city• Decrease energy, waste, and other consumption footprints in <strong>Council</strong>operations and across the city• Implement strategies to reduce water consumption in <strong>Council</strong>operations and across the city• Reduce emission and consumption footprint from transport in <strong>Council</strong>operations and across the city• Waste reduction strategies in <strong>Council</strong> operations and across the cityEnvironmental security 271,648 186,125 • Climate change planning and adaptation measures• Flood studies and risk management planning• Natural disaster risk minimisation• Environmental health exposure reductionSustainabilityengagement andenvironmentalmonitoring andreporting468,395 277,053 • Involve the community in local sustainability projects and ecosystemmonitoring• Facilitate the establishment of Sustainable Neighbourhood groups• Sustainable Schools program• Measurement of local consumption impact on the global environmentTotals 2,103,708 1,566,517
Our Finances 133ASSET MANAGEMENT<strong>Council</strong> has a $2 billion asset base, which is acquiredby ‘purchase’, contract, construction by <strong>Council</strong> staff,and by donation of assets constructed by developersand others to meet increased levels of service.<strong>Council</strong> endorsed a resourcing strategy in June <strong>2010</strong>,containing our Asset Management Policy, Strategyand Asset Management Plans, as required by theIntegrated Planning and <strong>Report</strong>ing (IP&R) Framework.The Asset Management Plans document the levelsof service we currently provide, any future demandson our assets, a lifecycle management plan foreach class of asset, as well as an improvement andmonitoring plan.Infrastructure maintenanceRoads and bridges $4,616,297Drainage and natural areas $5,027,565Buildings $1,873,335Parks and reserves $6,298,329Asset replacementTotal asset replacementcapital expenditure $23,094,333Condition of our assetsPlease find the condition of public works by referringto Special Schedule 7 of the Financial Statements(under separate cover). Special Schedule 7 includesthe condition of the works, estimates of the amountof money required to bring them up to a satisfactorystandard, and an estimate of annual expenses formaintaining the works at that standard.Private works<strong>Council</strong> has business units that carry out variousprivate works on a cost recovery or commercialbasis, both within and outside of <strong>Lake</strong> <strong>Macquarie</strong><strong>City</strong>. Some of this work is carried out on private land.The prices for this work are based on unit rates set by<strong>Council</strong> and incorporated in <strong>Council</strong>’s Pricing Policy.The Pricing Policy is available onwww.lakemac.com.au.
134<strong>City</strong> of <strong>Lake</strong> <strong>Macquarie</strong>- <strong>Annual</strong> <strong>Report</strong> <strong>2010</strong>/<strong>2011</strong>Elected Members andMayoral ExpensesMayoral allowance $53,980<strong>Council</strong>lors’ allowance $262,887Provision of dedicated office equipment (leased laptop computers, faxes, mobile phones, and accessories) $15,180Telephone calls $31,738<strong>Council</strong>lors’ attendance at conferences / seminars $21,847Overseas visits (including transport and accommodation) -Interstate visits (including transport and accommodation) -Meeting expenses $41,264Motor vehicle for Mayor $20,256Motor vehicle for <strong>Council</strong>lors $17,380Mayoral secretarial services $76,997<strong>Council</strong>lor support service (1 day per week) $15,578Mayoral office expenses $5,689<strong>Council</strong>lors’ vehicle allowance (for use of their own private vehicles / taxis) $4,556TOTAL $567,352
Our Finances 135seniorstaff<strong>Council</strong> employed five senior staff during the<strong>2010</strong>/<strong>2011</strong> financial year. The total amount ofmoney payable in respect to the employmentof those senior staff, including money payablefor salary, the provision of fringe benefits,and for all other costs associated with theiremployment was $1,198,626.Contract employment conditions for senior staffare in accordance with the Local GovernmentAct 1993 Section 338.The total remuneration packages for each of<strong>Council</strong>’s senior staff for the period 1 July <strong>2010</strong>to 30 June <strong>2011</strong> are:General Manager $323,440Director <strong>City</strong> Strategy $219,596Director Corporate Services $216,398Director Operations $219,596Director Community Development $219,596TOTAL $1,198,626
136<strong>City</strong> of <strong>Lake</strong> <strong>Macquarie</strong>- <strong>Annual</strong> <strong>Report</strong> <strong>2010</strong>/<strong>2011</strong>CONTRACTS AWARDEDcontractor $ amount goods and servicesTropic Asphalts 5,122,233.31 Asphaltic concrete services plant and truck hireHunter Resource Recovery 4,756,213.02 Joint council recycling serviceThe Glascott Group Pty Ltd 3,473,807.15 Redevelopment of Charlestown OvalNorth Construction and Building Pty Ltd 3,471,283.28 Cameron Park Community CentreCapgemini Australia Pty Ltd 2,822,538.18 Computer system software and supportBP Australia 2,394,919.37 Bulk diesel and unleaded fuel suppliesKingston Building (Australia) Pty Ltd 2,236,587.87 Fernleigh Track Stage 5EnergyAustralia 2,104,076.26 Street lighting and other electricity chargesCardiff Car <strong>City</strong> Pty Ltd 1,852,905.98 Motor cars and light commercial vehiclesLabour Co-Operative Ltd 1,728,794.83 Labour hire servicesSRS Roads Pty Ltd 1,626,214.31 Bituminous surfacing servicesKelly Trotter Motor Group Pty Ltd 1,502,187.46 Motor cars and light commercial vehiclesQMC Group 1,422,256.77 Fernleigh Track Stage 4Downer Edi Works 1,347,459.66 Asphaltic concrete services, bituminous surfacing services, emulsionservicesHunter Water Corporation 1,334,080.64 Water supplyBilas Knight Pty Ltd 1,189,186.67 Stage 3 multi-use pavilion - Speers Point ParkFurnass Landscaping Enterprises Pty Ltd 1,053,818.73 Stage 2 All Abilities Playground - Speers Point ParkTRUenergy Pty Ltd 976,498.21 Street lighting and other electricity chargesTruway Property Management Pty Ltd 960,712.12 Amenities building and carpark Myall Rd, CardiffBabic Construction Pty Ltd 945,920.90 Extension and refurbishment of Chapman Oval, SwanseaSCE Resources t/a Steelstone Services 893,260.17 Pavement material supplyLaser Electrical <strong>Lake</strong> <strong>Macquarie</strong> 733,877.52 Electrical contractor servicesGHD Pty Limited 725,895.00 Community waste campaign, site assessments, and feasibility studiesThiess Services Pty Ltd 692,172.39 Effluent disposal servicesLand and Property Management Authority 690,894.65 Land acquisition servicesR H Taylor Trucks 681,451.50 Acco Garbage F2350G TruckConvic Skate Parks Pty Ltd 677,646.69 Chapman Oval Skate Park Stage 2Coates Hire 663,294.17 Small plant hireNovocastrian Traffic Services Pty Ltd 640,800.12 Traffic control management servicesFreedom Fuels Australia Limited 600,228.93 Bulk unleaded fuelMetromix Quarries 535,035.56 Aggregate supply service, pavement material supplyD & P Fencing Contractors 514,538.20 Guardrail installation serviceBoral Construction Materials 509,389.26 Ready Mix Concrete Service and Bulk Cementitious Supply ServicesBoral Cement Limited 474,094.40 Triblend supply for pugmillAdtrans Hino 453,061.91 Hino 616 truck with factory fitted tipping bodyLiebherr Australia Pty Ltd 448,098.54 Liebherr LR634 track loaderGlenn Anderson Earthmoving 437,878.10 Plant and truck hireNovaskill 436,630.40 Traineeship schemesFairfax Media Publications Pty Ltd 414,511.03 Advertising and publications
Our Finances 137contractor $ amount goods and servicesOrigin Energy Electricity Limited 409,685.66 Street lighting and other electricity chargesAustralia Post 400,155.55 Postal servicesTelstra Corporation Ltd 382,264.92 Telephone servicesNoraville Earthmovers 376,069.86 Plant and truck hireBt Equipment Pty Ltd 360,092.08 Kawasaki 85ZV-2 wheel loaderRMA Construction Group P/L t/a RossMitchell & Assoc354,058.00 New recreation building and camp kitchen - Swansea GardensGMJ Equipment Pty Ltd 339,896.54 GMJ LLF16-350 Elevated Work Platform (EWP) fitted to Hino 1527cab chassisBenjen Pty Ltd 330,711.81 Lease payment for Toronto Swim CentreValley Road Markings 315,003.35 Line marking removal, line marking, and pavement marker servicesTCM Civil Pty Ltd 312,861.19 Water main relocation servicesAECOM Australia Pty Ltd 305,855.56 Environmental consultancy servicesOptus 304,863.87 Telephone servicesAdmac Plumbing Services Pty Ltd 297,387.30 Plumbing contractor servicesHanson Construction Materials Pty Ltd 295,344.00 Ready Mix Concrete ServicesTerry Keelan Plumbing 293,273.14 Plumbing contractor servicesT A T S Downunder Pty Ltd 288,966.70 Plant and truck hireMarathon Tyres 285,135.20 Tyre, tubing, and retread supplyChubb Fire & Security Ltd 283,362.20 Security servicesRoads & Traffic Authority NSW 278,762.00 Bulk registration renewalsStan Davies Excavations 274,960.11 Plant and truck hireHumes 273,240.53 Stormwater drainage productsRPS Australia East Pty Ltd 271,750.32 Consultancy servicesDowco Pty Ltd t/a Kevin Heslop 267,405.55 Building contractor servicesTimberline Cabins 264,540.00 Manufacture and deliver cabins to holiday parksUecomm Operations Pty Ltd 255,565.31 Ethernet service feeVeolia Environmental Services (Australia)Pty Ltd252,928.05 Waste collection and removalTanbasha Pty Ltd 251,343.10 Plant and truck hireGellray Pty Ltd 251,199.53 Management fee for Swansea Gardens <strong>Lake</strong>side Holiday ParkEC Sustainable Environment Consultants 249,198.40 Audit of municipal solid waste residual waste binCoffey 248,839.82 Excavated natural material testing servicesCorporate Express Australia Ltd 247,542.33 Stationery, office furniture, and computer software licencesSNK Group Pty Ltd 235,105.47 Plumbing contractor servicesJames Bennett Group 234,413.01 Library book purchasesLLoyd Consulting Environmental ProjectManagement230,395.00 Consultancy servicesViatek/Xerox Business Centre Pty Ltd 227,078.26 Leasing of multi-function devices and copy chargesSystems Construction Pty Ltd t/a Syscon 221,520.42 Electrical contract for subdivision - Grattoir Place, TorontoGW Building Pty Ltd 221,332.10 Construction of camp kitchen - Belmont Pines Holiday ParkKerry Holding 219,577.30 Fencing supply and installation services
138<strong>City</strong> of <strong>Lake</strong> <strong>Macquarie</strong>- <strong>Annual</strong> <strong>Report</strong> <strong>2010</strong>/<strong>2011</strong>contractor $ amount goods and servicesPickers Asphalting 216,356.25 Plant and truck hireSuperior Jetties 212,857.93 Design and construction of Blacksmiths and Speers Point pontoonsSafetyBuild Pty Ltd 211,909.25 Building contractor servicesO'Donnell Griffin Pty Ltd 209,155.55 Electrical contractor servicesAquatech 888 Pty Ltd 207,902.09 Supply and installation of Aquabrite units, water treatment, andbalancing for swim centresJ Blackwood & Sons Pty Ltd 207,047.04 Hardware, engineering, and safety suppliesJohn Herbert Earthmoving 204,904.15 Plant and truck hireAccurate Road Repairs Pty Ltd 203,519.63 Asphaltic concrete services and plant and truck hireCardno (NSW) Pty Ltd 202,451.43 Consultancy servicesSEMA Group Pty Ltd 196,293.31 Printing and document management servicesKentan Machinery Pty Ltd 195,195.94 Ride-on mowers and partsDigga Loaders Pty Ltd 192,585.84 Kanga DA725 track loaders and Kanga DA525 mini skid steer loadersWild Quarries & Civil 192,500.00 Concrete crushingScott Hoadley’s Earthmoving Pty Ltd 184,936.66 Plant and truck hireSharpes Tractor Centre Pty Ltd 184,071.15 John Deere 6534 tractor and partsAK & A Birse 182,218.86 Management services for Belmont Pines Holiday ParkCAM Management Solutions 173,941.24 Interplan and risk management systemConplant Pty Ltd 169,795.53 Plant and truck hireAir Conditioning Industries 168,564.84 Air conditioning servicesSwimoz 165,832.69 Management services for Morisset Swim CentreDell Australia Pty Ltd 164,372.00 Computer hardware purchasesPPT Investments Pty Ltd 161,201.70 Motor vehicles purchases and partsAustralian Hammer Supplies Pty Ltd 159,018.45 Kubota F3680 front decked mowersThe <strong>Lake</strong> (NSW) Pty Ltd 157,465.62 Management services for Wangi Point Holiday ParkDon Fox Planning Pty Ltd 156,382.99 Charlestown and Morisset contributions plansAGL Retail Energy Limited 155,713.71 Street lighting and other electricity chargesRubicof Pty Ltd 154,876.66 Location of underground servicesBuilden Industries 154,154.00 Wyee Community Hall extensionNewcastle Locksmiths 152,508.13 Security Services and SuppliesSantana Line Marking Services 144,291.22 Line marking removal, line marking, and pavement marker servicesA M & M R McGregor Pty Ltd 142,291.05 Plant and truck hireBoyz Toyz Excavations Pty Ltd 135,036.00 Plant and truck hireComputer Systems Australia 134,200.17 Computer hardware and software licencesRCA Australia 133,394.36 Geotechnical consultantsHymix Australia Pty Ltd 133,240.99 Ready Mix Concrete ServicesPolyfabrics Australia Pty Ltd (NSW) 132,946.65 Terrastop, Tensar silt suppliesMacdonald Johnston Pty Ltd 127,098.21 Garbage truck partsPeoplefusion Pty Ltd 124,941.23 Casual administration staffPlayrope Pty Ltd 121,703.45 Play ground equipment for Speers Point ParkHunter Contracts 120,600.00 Cleaning of Boolaroo depot offices
Our Finances 139contractor $ amount goods and servicesBruce’s Water Cartage 120,471.18 Plant and truck hireComplete Office Supplies Pty Ltd 119,535.14 Stationery and office furnitureHunter Ready Mixed Concrete Pty Ltd 118,945.87 Concrete servicesLeonard Holt Robb 116,253.90 Advertising and publicationsKennards Hire Pty Ltd 116,247.71 Small plant hireAnderson Sharp Constructions Pty Ltd 115,503.00 Belmont Neighbourhood Kitchen refurbishmentThe Hills Bark Blower 115,500.00 Supply and install hardwood chipInternational Quadratics Pty Ltd 115,463.64 Chlorine for swimming centresBaker & Taylor International 115,402.40 Library booksAustorque Pty Ltd 115,244.72 Management fee for Blacksmiths Beachside Holiday ParkSports Technology International 115,220.23 Upgrade of existing Hunter Sports Centre athletic track with newtop coat and other associated worksGreg Tapp Printing Pty Ltd 113,343.00 Printing servicesNigel Helyer t/a Sonic Objects 112,695.00 Consultancy - Sonic Objects - RadiolariansRed Rock Consulting Pty Ltd 111,633.73 Oracle licence and reviewB & N Excavations Pty Ltd 111,594.31 Plant and truck hireDavis Earthmoving & Quarrying Pty Ltd 111,066.86 Removal of organic garden wasteEco Water Tanks Pty Ltd 110,850.00 Concrete water tanksAndrew Hughes Earthmoving 110,093.50 Plant and truck hireMinerva Consulting Group Pty Ltd 107,518.73 OHS audit and preparationJ R Richards & Sons Pty Ltd 106,018.43 Waste collection and removalFluren Pty Ltd 105,669.85 Plant and truck hireDean Trailers Pty Ltd 103,397.00 Galvanised plant and tradesman trailerKaebel Leisure Pty Ltd 102,746.89 Supply of proprietary net structures and cableway partsHornby Project Signage 102,353.90 Town entry signage Belmont, Swansea, and TorontoThe GPT Group 102,018.68 Charlestown Community Centre and design of playspaceDreamsafe Recycling Central Coast 100,356.85 Mattress collection from Awaba Tip
140<strong>City</strong> of <strong>Lake</strong> <strong>Macquarie</strong>- <strong>Annual</strong> <strong>Report</strong> <strong>2010</strong>/<strong>2011</strong>Comparison BetweenBudgeted Results of Category 1 Business Units andActual ResultsCategory 1Business UnitBudgetedRevenuesActualRevenues Variance NoteBudgetedExpenditureActualExpenditure Variance NoteCivi<strong>Lake</strong> 5,929 7,159 20.75% 1 4,707 5,793 23.07% 2Non-DomesticWastePropertyManagement4,537 4,677 3.09% 3 3,204 2,869 -10.46% 49,046 10,064 11.25% 5 5,762 8,410 45.96% 6Notes:1. Actual revenues for Civilake exceeded budget by $1.2m, due largely to a higher than budgeted level of works required to becompleted under the RTA’s Road Maintenance <strong>Council</strong> Contract (RMCC). This is budgeted for based on an estimate of theRTA’s work program but may increase or decrease depending on the RTA’s level of funding and level of work required.2. Actual expenses for Civilake exceeded budget by $1.1m, which was mainly due to the impact of a higher level of works asnoted above.3. The variance between actual and budgeted revenues for non-domestic waste was negligible.4. Actual expenses for non-domestic waste were $0.3m lower than budget, due largely to less than anticipated green wasteprocessing.5. Actual revenues for property management exceeded budget by $1.0m, mainly due to profit on sale of assets which was notbudgeted for.6. Actual expenses for property management exceeded budget by $2.6m, due largely to a decrease in the fair value of <strong>Council</strong>’sinvestment property portfolio.COMPANION ANIMALS REVENUERevenue for Companion Animals is $183,492 this year (corresponding figure last year was $127,576)CATEGORY 2 BUSINESS UNITSPrintingHunter <strong>Council</strong>s Ltdsummary of progressof <strong>Council</strong> in Implementing Principles ofCompetitive Neutrality<strong>Council</strong> has adopted the principle of ‘competitive neutrality’ to its business activities as part of the nationalcompetition policy, which is being applied throughout Australia at all levels of government. The framework for itsapplication is set out in the June 1996 Government Policy statement on the “Application of National CompetitionPolicy to Local Government”. The “Pricing & Costing for <strong>Council</strong> Businesses A Guide to Competitive Neutrality”issued by the Division of Local Government in July 1997 has also been adopted.The pricing and costing guidelines outline the process for identifying and allocating costs to activities and providea standard of disclosure requirements. These disclosures are reflected in <strong>Council</strong>’s pricing and/or financialreporting systems and include taxation equivalents; <strong>Council</strong> subsidies; return on investments (rate of return); anddividends paid.Competitive neutrality pricing requirements have been applied to all Category 1 business activities.
Our Finances 141our financial posItionFor the first time, <strong>Council</strong> has reported an Operating Deficit before Capital Revenueof $2.783m. This means that our operating costs are now exceeding our operatingrevenue.For the first time, For <strong>Council</strong> the first Thishas time, situationreported <strong>Council</strong> is notan has sustainableoperating reported deficit an and Operating pressurebefore capital Deficit on ourrevenue before operating Capital resultof $2.783m. Revenue willThis means that ourintensifyoperating costsofare$2.783m. as thenow exceedingThis full means impactourthat of theoperatingour revaluation operatingrevenue.costs of ourThisare infrastructuresituationnow exceeding assetsis not sustainableour is operating realised byway and pressure on ourrevenue. of future This increases situation is in not the sustainable depreciation and charge. pressure on our operating result willoperating resultintensifywill intensifyas theasfulltheimpactfull impactof theofrevaluationthe revaluationof ourofinfrastructureour infrastructureassetsassetsis realisedis realisedbyby way offuture increases<strong>Council</strong>way in the of future depreciationwill need to increaseincreases charge.operating revenue (mainly through rate increases),reduce operating expenditurein theordepreciationmost likelycharge.a combination of both to ensure<strong>Council</strong> will needcontinued <strong>Council</strong> to increase will financial need operating to sustainability increase revenue operating of(mainlythe organisation.revenue through (mainly rate increases), through rate reduce increases), operating expenditure, ormost likely a combination reduce operating of both expenditure to ensure continued or most likely financial a combination sustainability of both of the to ensure organisation.continued financial sustainability of the organisation.Grossoutstanding debtOperating resultbefore capitalAlthough the trend is up, the amount of gross outstanding debt remains manageableAlthough the trend with is total up, outstanding the amount debt of gross currently outstanding just under debt $54m. remains manageable with total outstanding debtcurrently just under $54m.TheAlthoughlevel ofthenewtrendborrowingsis up, theinamount<strong>2011</strong> wasof gross$4.0moutstandingwhich wasdebtlowerremainsthan themanageable$8.7mborrowedwith total outstandingin <strong>2010</strong>, $8.3mdebtincurrently2009 andjust$16.5munderin$54m.2008. However, as a result of theThe level of new borrowings in <strong>2011</strong> was $4m, which was lower than the $8.7m borrowed in <strong>2010</strong>, $8.3m inrestrictions The level of placed new borrowings on us by rate in <strong>2011</strong> pegging was and $4.0m cost which shifting, was we lower are than still experiencingthe $8.7m2009, and $16.5m increasing 2008. However, as a result of the restrictions placed on us by rate pegging and cost shifting,borrowed in pressure <strong>2010</strong>, $8.3m to fund in the 2009 majority and $16.5m of capital in 2008. works However, from loan as borrowings. a result of thewe are still experiencing restrictions increasing placed on pressure us by rate to pegging fund the and majority cost shifting, of capital we works are still from experiencing loan borrowings.In an attempt to reduce the short term financial impact of our borrowings, we haveincreasing pressure to fund the majority of capital works from loan borrowings.In an attempt to increased reduce the the short term term of our financial loans over impact recent of years our borrowings, so that they we more have readily increased match the the term of our loanslifecycleover recent years In so an that attempt of thethey to assetsmore reduce thereadily the funds short arematch term usedthe financial to acquirelifecycle impact or build.of the of assets our This borrowings, action alsothe funds are we used have to acquire or build.This action also increased supports the term principle of our of loans inter-generational over recent years equity so which that they attempts more readily to ensure match that the future ratepayerslifecycle of the assets the funds are used to acquire or build. This action alsopay for the use of capital initiatives by way of future loan payments.
142<strong>City</strong> of <strong>Lake</strong> <strong>Macquarie</strong>- <strong>Annual</strong> <strong>Report</strong> <strong>2010</strong>/<strong>2011</strong>Debt serviceratioThe debt service ratio compares the net debt service cost (including principalrepayments and interest) to operating revenue and is a relevant indicator of theaffordability of an organisation’s debt position.As can be seen from above graph, overall the debt service ratio has been decreasingThe debt service ratio over compares recent years, the net with debt only service a slight cost (including increase principal the current repayments year. and This interest) indicates to thatoperating revenue current and is a relevant levels of indicator debt remain of the affordability manageable. of an organisation’s debt position.The debt service ratio compares the net debt service cost (including principalAs can be seen from Increasing the graph demands above, overall placed the debt on <strong>Council</strong> service ratio to borrow has been additional decreasing funds over to recent providerepayments and interest) to operating revenue and is a relevant indicator years, variousof the withonly a slight increase levelsaffordabilityin the of current worksof anyear. demandedorganisation’sThis indicates by our that communitydebtcurrentposition.levels may of well debt see remain this manageable. ratio increase furtherover coming years.Increasing demands As placed can be on seen <strong>Council</strong> from to borrow above additional graph, overall funds to the provide debt service various levels ratio of has works been demanded decreasing byour community may over well recent see this years, ratio increase with only further a slight over increase coming years. in the current year. This indicates thatcurrent levels of debt remain manageable.Unrestrictedcurrent ratioIncreasing demands placed on <strong>Council</strong> to borrow additional funds to provide variouslevels of works demanded by our community may well see this ratio increase furtherover coming years.The unrestricted current The unrestricted ratio is a measure current of the ratio ability is a to measure satisfy financial of the obligations ability to satisfy in the short financial term and obligations is aratio of current assets, in the less short externally term restricted and is a ratio assets, of divided current by assets, current less liabilities, externally less specific restricted purpose assets, liabilities.divided by current liabilities, less specific purpose liabilities.The unrestricted current ratio for <strong>2010</strong>/11 was 2.46:1, which although slightly lower than the previous year, is stillconsidered satisfactory. The unrestricted current ratio for <strong>2010</strong>/11 was 2.46:1, which although slightly lowerthan the previous year, is still considered satisfactory.The unrestricted current ratio is a measure of the ability to satisfy financial obligationsin the short term and is a ratio of current assets, less externally restricted assets,divided by current liabilities, less specific purpose liabilities.The unrestricted current ratio for <strong>2010</strong>/11 was 2.46:1, which although slightly lowerthan the previous year, is still considered satisfactory.
Our Finances 143(Data only available (Data for last 6 years)for only LMCC available only available for last 6 for years) last 6 years)The building and infrastructure The building renewal and infrastructure ratio is determinedrenewal renewal by dividingratio ratio istotal is determined determined asset renewalsby by dividing(building dividing totaland total asset assetinfrastructure) by the renewals depreciation charge. A ratio of one or greater indicates that we are replacing our assets at a(building and infrastructure) by by the the depreciation charge. charge. A ratio A ratio of 1 of or 1 orrate equal to or greater greater than the consumption of these assets.indicates that we we are are replacing our our assets assets at a at rate a rate equal equal to or to greater or greater than thanWe are currently implementing the consumption sophisticated of of these asset assets. management plans to ensure we get an optimum return onevery dollar we spendWe onare asset currentlymaintenance implementingand renewal. sophisticatedOver time, thisasset assetstrategy managementshould seeplanstheplanstrendto ensureoftotheensure we wegraph above improve.get an optimum return on on each and and every dollar dollar we we expend on on asset asset maintenanceand renewal. Over time, this this strategy should see see the the trend trend of the of the above above graph graphimprove.Internallyrestricted cashBuilding andinfrastructurerenewals ratioThe graph above shows the amounts of ‘internally restricted’ cash held by <strong>Council</strong> over the last 10 years.The above graph shows the amounts of ‘internally restricted’ cash held by councilInternally restricted over cash the is funds last held 10 years. by <strong>Council</strong> for specific future purposes as determined by the <strong>Council</strong>.Each balance of internally restricted cash supports a number of different projects which have been approved bythe <strong>Council</strong> and are, “Internally for various Restricted” reasons, awaiting cash commencement is funds held at by some council time for in the specific future. future purposes asdetermined by the council. Each balance of internally restricted cash supports anumber of different projects which have been approved by the council which are, forvarious reasons, awaiting commencement at some time in the future.
144<strong>City</strong> of <strong>Lake</strong> <strong>Macquarie</strong>- <strong>Annual</strong> <strong>Report</strong> <strong>2010</strong>/<strong>2011</strong>INcome statementfor the year ended 30 June <strong>2011</strong>OriginalBudget (1)<strong>2011</strong>$’000101,64614,3518,12312,01723,19611,466--170,799INCOME FROM CONTINUING OPERATIONSActual Actual<strong>2011</strong> <strong>2010</strong>Notes $’000 $’000Revenue:Rates and annual charges 3a 102,066 97,819User charges and fees 3b 13,679 14,037Interest and investment revenue 3c 10,110 5,819Other revenues 3d 14,639 19,507Grants and contributions provided for operating purposes 3e,f 25,541 25,391Grants and contributions provided for capital purposes 3e,f 38,243 18,920Other Income:Net gain from the disposal of assets 5 1,125 2,574Net share of interests in joint ventures andassociates using the equity method 19 27 -Total income from continuing operations 205,430 184,06765,4644,03626,28640,675-20,723157,18413,615-13,61513,615-2,149EXPENSES FROM CONTINUING OPERATIONSEmployee benefits and on-costs 4a 70,152 70,129Borrowing costs 4b 4,283 3,644Materials and contracts 4c 27,819 30,748Depreciation and amortisation 4d 45,956 40,464Impairment 4d - -Other expenses 4e 21,760 17,569Total expenses from continuing operations 169,970 162,554Operating result from continuing operations 35,460 21,513Operating result from discontinued operations - -NET OPERATING RESULT FOR THE YEAR35,460 21,513Attributable to:- <strong>Council</strong> 35,460 21,513- Minority interests - -Net operating result for the year before grants andcontributions provided for capital purposes 2,783 2,593Note:(1) Original budget as approved by <strong>Council</strong> - refer to Note 16.The Income Statement should be read in conjunction with the accompanying notes.
Our Finances 145balance sheetAS AT 30 June <strong>2011</strong>ASSETSActual Actual<strong>2011</strong> <strong>2010</strong>Notes $’000 $’000Current assetsCash and cash equivalents 6a 24,661 39,847Investments 6b 56,360 30,197Receivables 7 9,965 8,819Inventories 8 1,680 1,910Other 8 1,066 1,063Non-current assets classified as held for sale 22 720 590Total current assets 94,452 82,426Non-current assetsInvestments 6b 58,235 65,107Receivables 7 713 645Inventories 8 1,710 -Infrastructure, property, plant, and equipment 9 1,920,378 2,114,798Investments accounted for using equity method 19 137 -Investment property 14 54,186 56,950Intangible assets 23 2,622 3,851Other 8 - -Total non-current assets 2,037,981 2,241,351Total assets 2,132,433 2,323,777LIABILITIESCurrent liabilitiesPayables 10 15,128 12,469Borrowings 10 4,257 4,470Provisions 10 38,035 37,559Total current liabilities 57,420 54,498Non-current liabilitiesPayables 10 - -Borrowings 10 49,452 49,710Provisions 10 14,396 12,788Total non-current liabilities 63,848 62,498Total liabilities 121,268 116,996Net assets 2,011,165 2,206,781EquityRetained earnings 20 1,013,489 1,218,863Revaluation reserves 20 997,676 987,918<strong>Council</strong> equity interest 2,011,165 2,206,781Minority equity interest - -Total equity 2,011,165 2,206,781The Balance Sheet should be read in conjunction with the accompanying notes.
146<strong>City</strong> of <strong>Lake</strong> <strong>Macquarie</strong>- <strong>Annual</strong> <strong>Report</strong> <strong>2010</strong>/<strong>2011</strong>statement ofcomprehensive incomeFOR THE YEAR ended 30 June <strong>2011</strong>Actual Actual<strong>2011</strong> <strong>2010</strong>Notes $’000 $’000Net operating result for the year - from income statement 35,460 21,513Other comprehensive incomeGain (loss) on revaluation of infrastructure, property, 20b 9,473 185,866plant and equipmentNet share gain (loss) on revaluation reserve of jointly controlled entity 20b 285 -Gain (loss) on revaluation of available-for-sale investments 20b - -Realised available-for-sale investment gains recognised in revenue 20b - -Net share of retained earnings of jointly controlled entity 20a (175) -Adjustment to reflect changes in accounting policies 20e (352,572) -Adjustment to correct prior period errors 20d 111,913 (56,771)Total other comprehensive income for the year (231,076) 129,095Total comprehensive income for the year (195,616) 150,608Attributable to:- <strong>Council</strong> 195,616 150,608- Minority interests - -The Statement of Comprehensive Income should be read in conjunction with the accompanying notes.
Our Finances 147statement of changes in equityFOR THE YEAR ENDED 30 June <strong>2011</strong>ACTUAL<strong>2011</strong>$’000ACTUAL<strong>2010</strong>$’000contractorNotesrefretainedearningsAssetrevaluationreserveotherreservescouncilequityinterestminorityinteresttotalequityretainedearningsAssetrevaluationreserveotherreservescouncilequityInterestminorityinteresttotalequityOpening balance 20 1,218,863 987,918 - 2,206,781 - 2,206,781 1,254,121 802,052 - 2,056,173 - 2,056,173Correction of errorsChanges in accounting policies--------------Restated opening balance 20 1,218,863 987,918 - 2,206,781 - 2,206,781 1,254,121 802,052 - 2,056,173 - 2,056,173------------Net operating result for the year 20 35,460 - - 35,460 - 35,460 21,513 - - 21,513 - 21,513Other comprehensive income 20 (240,834) 9,758 - (231,076) - (231,076) (56,771) 185,866 - 129,095 - 129,095Total comprehensive income 20 (205,374) 9,758 - (195,616) - (195,616) (35,258) 185,866 - 150,608 - 150,608Closing balance 20 1,013,489 997,676 - 2,011,165 - 2,011,165 1,218,863 987,918 - 2,206,781 - 2,206,781The Statement of Changes in Equity should be read in conjunction with the accompanying notes.
148<strong>City</strong> of <strong>Lake</strong> <strong>Macquarie</strong>- <strong>Annual</strong> <strong>Report</strong> <strong>2010</strong>/<strong>2011</strong>statement of cash flowSFOR THE YEAR ended 30 June <strong>2011</strong>OriginalBudget (1)<strong>2011</strong>$’000101,64614,3518,12334,66212,017Cash Flows from Operating ActivitiesActual Actual<strong>2010</strong> 2009Notes $’000 $’000Receipts:Rates and annual charges 102,221 97,452User charges and fees 15,239 15,597Investment revenue and interest 7,618 5,697Grants and contributions 44,755 38,761Other 18,335 26,324(65,464)(26,286)(4,036)(20,723)54,290Payments:Employee benefits and on-costs (69,019) (67,578)Materials and contracts (25,554) (28,221)Borrowing costs (3,803) (2,999)Other (26,412) (25,318)Net cash provided (or used) in operating activities 11(b) 63,380 59,715--7502,471-(51,761)(56,008)(48,540)Cash Flows from Investing ActivitiesReceipts:Sale of investments 68,779 78,918Sale of investment properties - -Sale of real estate assets 1,133 1,347Sale of infrastructure, property, plant, and equipment 4,349 7,346Payments:Purchase of investments (86,120) (82,895)Purchase of infrastructure, property, plant, and equipment (66,236) (71,342)Net cash provided by (or used in) investing activities (78,095) (66,626)5,000Cash Flows from Financing ActivitiesReceipts:Borrowings and advances 4,000 8,700(5,223)(223)5,52789,36294,889Payments:Borrowings and advances (4,471) (4,632)Net cash provided by (or used in) financing activities (471) 4,068Net increase/(decrease) in cash and cash equivalents (15,186) (2,843)Cash and cash equivalents at beginningof reporting period 11(a) 39,847 42,690Cash and cash equivalents at end of reporting period 11(a) 24,661 39,847Note: (1) The budget as approved by <strong>Council</strong> combines cash and investments together however in the actualsabove investments are excluded.
Our Finances 149Schedule of Rates andCharges Written Offrates2009/<strong>2010</strong>$<strong>2010</strong>/<strong>2011</strong>$Pensioner rebates 3,285,270.76 3,234,540.00Postponed rates 25,259.05 25,161.39Other 18,617.55 17,912.10TOTAL 3,329,147.36 3,277,613.49charges 2009/<strong>2010</strong>Pensioner rebates 1,167,021.56 1,200,484.57Postponed rates 12,738.69 12,638.18Other 385.67 0.00TOTAL 1,180,145.92 1,213,122.75Financial Statementsfor the Year EndED 30 June <strong>2011</strong>You can find the complete version of <strong>Council</strong>’s <strong>Annual</strong> Financial Statements for the year ending 30 June <strong>2011</strong>:online at www.lakemac.com.au;at <strong>Council</strong>’s Customer Service Centre; andat any <strong>Lake</strong> <strong>Macquarie</strong> <strong>City</strong> Library.
<strong>City</strong> of <strong>Lake</strong> <strong>Macquarie</strong><strong>Annual</strong> <strong>Report</strong> <strong>2010</strong>-<strong>2011</strong>Financial Statements for the YearEnding 30 June <strong>2011</strong>– Appendix 1<strong>Lake</strong> <strong>Macquarie</strong> <strong>City</strong> <strong>Council</strong>126-138 Main Road, SPEERS POINT NSW 2284Box 1906 Hunter Region Mail Centre NSW 2310Tel: (02) 4921 0333 Fax: (02) 4921 0351Email: council@lakemac.nsw.gov.auWebsite: www.lakemac.com.auDesigned by Karlee Cain, Graphic DesignerPrinted December <strong>2011</strong> on recycled paperby <strong>Lake</strong>mac Print (02) 4921 0510© <strong>Lake</strong> <strong>Macquarie</strong> <strong>City</strong> <strong>Council</strong>M&C 9016