Winsph User's Guide - Steve Turley
Winsph User's Guide - Steve Turley
Winsph User's Guide - Steve Turley
- No tags were found...

Create successful ePaper yourself
Turn your PDF publications into a flip-book with our unique Google optimized e-Paper software.
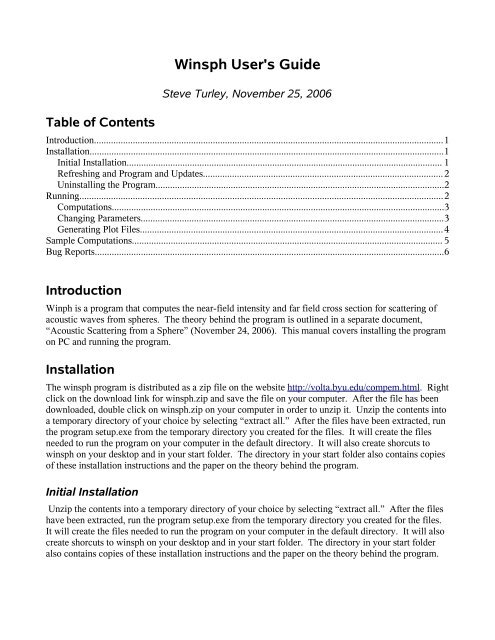
I will explain each of the parameters in this box below.●●●●●●●radius: used for all five calculations. This is the radius of the sphere from which the planewave scatters.k_d/k: used in the penetrable sphere calculations. This is the ratio of the wave number insidethe sphere to the wave number in the material outside the sphere. This ratio is also the ratio ofthe speed of sound inside the sphere to the speed of sound outside of the sphere. The wavenumber is 2π/λ, where λ is the wavelength of the wave in each material.rho_d/rho: used in the penetrable sphere calculations. This is the ratio of the density inside ofthe sphere to the density outside the sphere.xmin: used in the near field calculations. It is the minimum value of x for which the near fieldis computed.xmax: used in the far field calculations. It is the maximum value of x for which the near field iscomputed.ymin: used in the near field calculations. It is the minimum value of y for which the near fieldis computed.ymax: used in the far field calculations. It is the maximum value of y for which the near field iscomputed.You can change any of these values by typing new values into the boxes and selecting OK. If youselect cancel, the previous values for these parameters are used. The new parameters are used for allfuture calculations until you exit the program and change them again. After you change the paramters,you need to press the Compute button again in the Define Problem dialog box to complete thecalculation using the new values.Generating Plot FilesYou can generate graphics files with the results of the last calculation you made by pressing the PlotFile button in the Define Problem dialog box. After doing so, it will display the following dialog box.With this box, you can select the file name and the format of the data file created in the program. Bydefault, the files are created in the plots directory of where the application resides. If you installed theprogram with the default selections, they will be in C:\Program Files\BYU\Winph\plots. To create aplot file, type in the name of the file (without an extension) into the file name box. Select one of the
Illustration 2: Near field intensity for a hard sphere is radius 1.3 wavelengthsradio buttons to choose your preferred file format. Vector formats (EPS, PDF, PS, WMF) are generallybetter for displaying the far field calculations. Bit-mapped formats (BMP,GIF,PNG,TIFF) aregenerally better for displaying the near field graphs.If you specify a file name which already exists in the plots directory, the program will not overwrite it.Instead, it will create a file with a name life _5.EPS, where the number is the next consecutive numberavailable and the extension depends on the file format you chose.Sample ComputationsThis section has a few examples of computations made by winsph.Soft Sphere, a= 8.010 4dsigma/domega10 310 20 20 40 60 80 100 120 140 160 180theta, degreesIllustration 1: Scattering cross section for a soft sphere with a 8 wavelength radius.
Illustration 3: Near field intensity for a penetrable sphere of raidus 2.5 wavlengths with k_d/k=1.2 andrho_d/rho=1.2Bug ReportsThis program has not been extensively tested and there are probably errors in the documentation aswell. I'll be happy to fix what I can if you send me email with details about the problem toturley@byu.edu .