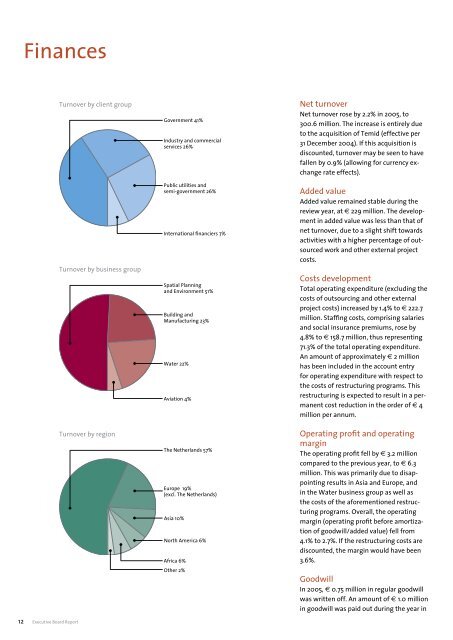
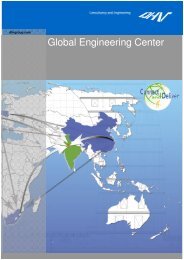
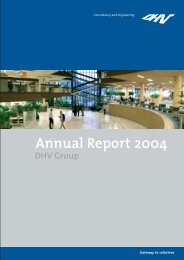
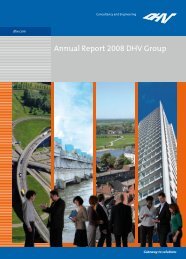
Finances12 Executive Board ReportTurnover by client groupTurnover by business groupTurnover by regionGovernment 41%Industry and commercialservices 26%Public utilities andsemi-government 26%International financiers 7%Spatial Planningand Environment 51%Building andManufacturing 23%Water 22%Aviation 4%The Netherlands 57%Europe 19%(excl. The Netherlands)Asia 10%North America 6%Africa 6%Other 2%Net turnoverNet turnover rose by 2.2% in 20<strong>05</strong>, to 300.6 million. The increase is entirely dueto the acquisition of Temid (effective per31 December 2004). If this acquisition isdiscounted, turnover may be seen to havefallen by 0.9% (allowing for currency exchangerate effects).Added valueAdded value remained stable during thereview year, at € 229 million. The developmentin added value was less than that ofnet turnover, due to a slight shift towardsactivities with a higher percentage of outsourcedwork and other external projectcosts.Costs developmentTotal operating expenditure (excluding thecosts of outsourcing and other externalproject costs) increased by 1.4% to € 222.7million. Staffing costs, comprising salariesand social insurance premiums, rose by4.8% to € 158.7 million, thus representing71.3% of the total operating expenditure.An amount of approximately € 2 millionhas been included in the account entryfor operating expenditure with respect tothe costs of restructuring programs. Thisrestructuring is expected to result in a permanentcost reduction in the order of € 4million per annum.Operating profit and operatingmarginThe operating profit fell by € 3.2 millioncompared to the previous year, to € 6.3million. This was primarily due to disappointingresults in Asia and Europe, andin the Water business group as well asthe costs of the aforementioned restructuringprograms. Overall, the operatingmargin (operating profit before amortizationof goodwill/added value) fell from4.1% to 2.7%. If the restructuring costs arediscounted, the margin would have been3.6%.GoodwillIn 20<strong>05</strong>, € 0.75 million in regular goodwillwas written off. An amount of € 1.0 millionin goodwill was paid out during the year in
espect of the various acquisitions and theincreased holding in Stewart Scott International.DHV makes its acquisitions for the longterm. An amortization period of twentyyears is applied to goodwill, in accordancewith the expected economic life expectancyof the company or activities concerned.Financing costsInterest paid in 20<strong>05</strong> totalled € 1.7 million.This represents a slight increase comparedto the previous year, largely due to a higheraverage working capital financing requirement.TaxationThe tax burden for the year was 10.0% ofprofit. The overall tax burden was reducedby tax compensation relating to the liquidationof overseas participations, andincreased by non-valuation of loss compensationrelating to overseas subsidiaries, andby non-deductible amortization of goodwill.Net profitNet profit fell by € 0.4 million compared tothe previous accounting year, to € 3.7 million.The net profit margin on turnover wastherefore 1.2%.Balance sheet ratiosThe balance sheet total fell to € 137.4 million,a decrease of 4.6% compared to the2004 level. This was primarily due to a6543210Net profit(€ million)5.2nettoresultaat (in miljoenen €)5.91.04.13.72001 2002 2003 2004 20<strong>05</strong>1210 121086864420200,6bedrijfsresultaat(voor afschrijving goodwill) (in €)0,411.7bedrijfsresultaat11.1 (voor afschrijving goodwill) (in €)11.10,211.70,0decrease in the gross working capital (accountsreceivable (voor afschrijving plus goodwill) work 6.3 (in €) in hand, minusbedrijfsresultaat12advances and pre-invoiced work) of €2.911.75.5 million11.1and a decrease in the value offixed 10assets in the amount of € 2.5 million.Working capital was outstanding 9.5 for an average2.98of 80 days in 20<strong>05</strong>, compared to 862001 2002 2003 2004 20<strong>05</strong>days in 2004.Equity rose by € 1.4 million in 20<strong>05</strong>. This66.32001increase2002is due2003to the2004addition 20<strong>05</strong>of the netprofit of € 3.7 million, offset by provisions4for pension liabilities further to the newreporting requirements in the amount of 2.94.2 million 2 and an active tax deferral in theamount of € 1.3 million.Net interest-bearing0liabilities (long-termliabilities 2001 plus 2002 liabilities 2003 2004 to credit 20<strong>05</strong> institutions,less cash at bank and cash inwinst per aandeel (in €)hand) decreased due to a reduction in the1,2 winst per aandeel (in €)working capital requirement. The total1,2credit facility available 1.11 for current accountoverdraft 1,0 and 1.11 guarantees, plus long-termliabilities, 1,0 0.97amounted to € 99 million at0.9731 December 0,8 20<strong>05</strong>. The ratio of interestbearing0,8 liabilities to equity 0.76 was 0.51 at 31December 20<strong>05</strong>, compared 0.76 to 0.53 0.68 at the0,6end of 2004.0.680,60,4Cash flow0,4The total cash flow (net profit plus depreciation0,2of fixed assets and amortizationof goodwill) 0,2 was € 10.6 0.14 million (2004:€ 12.20,0million). The 0.14 cash flow from operational0,0 activities 2001 2002 was 2003 € 5.1 million 2004 20<strong>05</strong> (2004:€ 7.5 million). 2001 2002 2003 2004 20<strong>05</strong>of goodwill) bedrijfsresultaat(€ million)(voor afschrijving goodwill) (in €)12 bedrijfsresultaat(voor afschrijving goodwill) (in €)11.71211.111.71011.110864202001 2002 2003 9.5 2004 20<strong>05</strong>Operating profit (before amortization864209.50.142.92.96.39.59.56.32001 2002 2003 2004 20<strong>05</strong>2001 2002 2003 2004 20<strong>05</strong>6.330netto-omzet en toegevoegde waarde(in miljoenen €)35020netto-omzet en toegevoegde waarde321.3 (in miljoenen €)300311.2350 300.2300.610294.1250321.3300311.20300.2300.6230.9 234.7 294.1223.4229.1 229.02001 Net 2002 turnover 2003 2004 20<strong>05</strong>200250 Added value230.9 234.7223.4229.1 229.0150200 Net turnover and Addedvaluenetto-omzet (€ million) en toegevoegde waarde(in miljoenen €)10035015<strong>05</strong>0300100 300.2025<strong>05</strong>02001 2002 230.9 2003 234.7223.42004 229.1 20<strong>05</strong> 229.020001502001 2002 2003 2004 20<strong>05</strong>10<strong>05</strong>0060 eigen vermogen (in miljoenen €)(€ million)6<strong>05</strong>04030201001500,41001000,25<strong>05</strong>0<strong>05</strong>040302010042.342.3eigen vermogen (in miljoenen €)46.646.645.949.345.949.350.82001 2002 2003 2004 20<strong>05</strong>2001 2002 2003 2004 20<strong>05</strong>(€ netto-omzet million) winst perenaandeeltoegevoegde waarde(in €)(in miljoenen €)1,2350netto-omzet en toegevoegde waarde(in miljoenen €)3501.11 321.3300311.21,0 300.2300.6321.3294.1300 0.97311.2300.2300.6294.12500,8250230.9 234.7223.4229.1 229.00.76200230.9 234.7223.4229.10.68 229.0200 0,60,0Shareholders’ equityProfit per share1500321.3311.22001 2002 2003 2004 20<strong>05</strong>0.14294.1300.650.82001 20012002 20022003 20032004 200420<strong>05</strong>20<strong>05</strong>2001 2002 2003 2004 20<strong>05</strong>Executive Board Report13