2005 Annual Report - Brookfield Properties
2005 Annual Report - Brookfield Properties
2005 Annual Report - Brookfield Properties

Create successful ePaper yourself
Turn your PDF publications into a flip-book with our unique Google optimized e-Paper software.
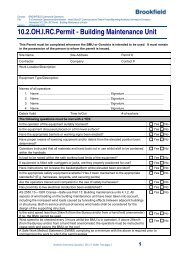
Dear Shareholders,We are pleased to report that <strong>2005</strong> was another year of solidfinancial performance for <strong>Brookfield</strong> <strong>Properties</strong>. Consistentwith past years, we saw our revenue and commercial propertiesnet operating income grow, and our funds fromoperations excluding lease termination income and gainsincrease by 9%. The contribution coming from our residentialland development business rose to $106 million in <strong>2005</strong>.<strong>2005</strong> was also another year of strong operational performancefor <strong>Brookfield</strong> <strong>Properties</strong>. We made progress inachieving our goals for the year, increasing our overalloccupancy rate to 94.6%, strengthening our balance sheet andpositioning the company for further growth going forward.Last year in our letter to shareholders, we outlined ourstrategic plan for <strong>2005</strong>, focusing on four principle objectives:lowering vacancies and near term rollover exposure;investing our liquidity with joint venture partners who arelooking to team up with experienced operating partners inorder to enhance our returns on new acquisitions; acquiringour common shares for value; and capitalizing on our developmentinventory and expanding our development platform.During <strong>2005</strong> we made meaningful progress in all four areas.LeasingWith an improving economy where demand for office spaceis increasing in virtually all of our markets, we are enjoyinghigher occupancies and rising rents. In Midtown Manhattan,we are seeing rental rates back to where they were in 2000.With single digit vacancy and very few blocks of availablespace, Midtown Manhattan is tightening noticibly. As LowerManhattan has historically risen and fallen with theMidtown market, we are beginning to see an increase intenant activity downtown with the substantial improvementin the Midtown Manhattan office market. Washington, D.C.remains steady with an ever-expanding government tenantbase. Boston is still suffering the aftershocks of corporateconsolidations and is seeing modest improvements only innarrow segments of the market.Our Canadian markets have been our strongest recentlyowing to general economic improvement, steady job growthand modest new office development during the last cycle.With single digit vacancy, we believe these markets are poisedfor a near-term run of healthy growth.We were successful with our three biggest leasing challengesduring <strong>2005</strong>: Three World Financial Center in LowerManhattan; 1625 Eye Street, N.W. in Washington, D.C.; and 33South Sixth Street in Minneapolis, all of which began the yearwith substantial vacancy. We improved the occupancy atThree World Financial Center to 82% from 35% at thebeginning of the year; 1625 Eye Street improved to 96% from83%; and thanks to the expansion of Target Corporation, 33South Sixth Street ended the year at 86% leased.Overall, we leased 3.8 million square feet of spaceportfolio-wide, approximately three times the amount contractuallyexpiring. In the process, we increased our overalloccupancy by 190 basis points to 94.6% and reduced 2006rollover exposure by 90 basis points to 3.6%.InvestingTo stay competitive, last year we set out to invest side by sidewith joint venture partners, enhancing our returns throughfees earned operating the venture. We successfully accomplishedthis through our Canadian office fund which wasestablished and fully invested in one transaction. With theacquisition of the O&Y portfolio, our fifth major portfolioacquisition in 15 years, we expanded our platform in Torontoand Calgary and entered Ottawa, a new market for us. Thisacquisition, completed with institutional partners, increasedour operating properties in Canada by 27 and added anotherkey development site in Ottawa.We are working to accomplish similar results with ourU.S. office fund. With approximately $4 billion of capacity, wewill have significant buying power for office properties andportfolios in the United States. We are contributing approximately30% of the equity to this fund.Top: <strong>Brookfield</strong> <strong>Properties</strong>’ premier properties frame the Calgaryskyline. Bankers Hall (left) and Petro Canada Centre (right) are atfull occupancy owing to the booming Alberta economy.Bottom: 75 State Street (center) and 53 State Street (right), Boston,comprise two million square feet of premier office space in theheart of New England’s historic financial district.4
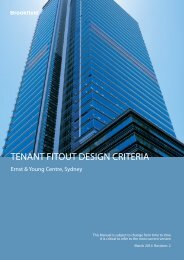
Share BuybacksWe continue to believe that there is value to be found in ourcommon shares and during <strong>2005</strong> repurchased 2.7 millioncommon shares of the company at an average price of $27.50.This brings the total number of shares repurchased since theinception of our normal course issuer bid in 1999 to 21million at an average price of just under $15 per share.DevelopmentFortifying Lower Manhattan as North America's financialcapital and enhancing the value of the World Financial Center,Goldman Sachs commenced construction on a 2.1 millionsquare foot headquarters building at Site 26 in Battery ParkCity, adjacent to Three World Financial Center, during <strong>2005</strong>.Through a cooperation agreement, we monetized our rightsaffecting this site, earning a $30 million fee.Looking forward, we have several major developmentprojects on the horizon and during <strong>2005</strong> worked to positionthem for near-term activation. Given the rapidly decreasingvacancy rates in our major markets, we are working to secureanchor tenants for these sites while advancing design,planning and entitlements.During <strong>2005</strong>, we acquired our 50% partner's interest inthe three-phase 2.5 million square foot mixed-use BayAdelaide Centre project in Toronto, giving us the full flexibilityand control to proceed unencumbered. Although smaller inscale, our 500,000 square foot Bankers Court sites inCalgary are exciting project prospects in this boomingenergy-based market.In Midtown Manhattan, we are planning a mixed-useproject at our 2.5 million square foot site at 401 West 31stStreet. In Downtown New York, we are studying ways toexpand the retail areas at the World Financial Center in orderto establish a destination shopping center, possibly timed tocoincide with the reconnection of the Center with the WorldTrade Center transit station.We also have development sites in Ottawa and Denverwhich we are actively planning in order to monetize theirvalue in the near-term.development operations by capitalizing on a robustwestern Canadian economy;• Increased our dividend 70%, reflecting our belief in thestrength of our underlying business.OutlookTurning our sights to 2006 and the continued growth of ourcompany, we have been active with a number of strategicinitiatives that will drive growth in funds from operationsgoing forward.Our goals for 2006 are similar to those we set forth for<strong>2005</strong>. In 2006, we are focused on commencing new officedevelopments; expanding our office development platformby adding additional projects to our inventory; investing oursubstantial liquidity alongside institutional partners in orderto enhance our returns; and supporting and expanding ourresidential operations in order to continue to capitalize onthe strong Western Canadian economy.We plan on accomplishing these goals while keepingour core portfolio healthy and stable and our balance sheetstrong. Our most important priority continues to be increasingoccupancy by pro-actively managing our assets. Ouraverage lease maturity at nine years is considerably longerthan our peer average, ensuring stable cash flow. With fewerleases coming up for renewal each year, <strong>Brookfield</strong> <strong>Properties</strong>spends a fraction of the industry norm on tenant improvementsand leasing commissions.During 2006 we will work to continue to redeploycapital from secondary markets and non-strategic assets intoprimary markets and strategic assets. In Calgary we plan towork to reposition some of the assets that we acquired withthe O&Y portfolio and dispose of those which don't fit withour long-term goals.We expect to remain active with our share buybackprogram as an efficient means of investing in high-qualityoffice properties in the marketplace. We continue to beexcited about the prospects in the future for <strong>Brookfield</strong><strong>Properties</strong> and, on behalf of the management and Board ofDirectors, we thank you for your continued support.Additional Highlights of <strong>2005</strong>• Earned net income of $164 million or $0.69 per share;• Generated funds from operations of $435 million or $1.85per share;• Enhanced the contributions coming from our residentialRichard B. ClarkPresident & Chief Executive OfficerFebruary 8, 2006Top: TD Canada Trust Tower (left) and Bay Wellington Tower (right)comprise BCE Place, Toronto’s premier business address, also hometo the Allen Lambert Galleria and the Hockey Hall of Fame.Bottom: The four copper-crowned granite and glass office towersof the World Financial Center surround the North Cove YachtHarbor on the Hudson River, at the forefront of Lower Manhattan.6
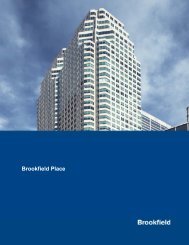
DevelopmentOver the past decade, we have worked to amass eight millionsquare feet of high-quality, centrally-located developmentproperties in major North American cities. As the economyrebounds and vacancy declines, continued supply constraintsshould create opportunities for us through thedevelopment of these projects. With a limited amount ofnew office product having been built during the past realestate cycle, we believe that development will play a key rolein this next cycle. We are currently pursuing tenants toanchor these developments, all in various stages of designand planning, with construction expected to commence ona number of these sites during the next two years: BayAdelaide Centre (Toronto), Bankers Court (Calgary), 401 West31st Street (New York) and Place de Ville III (Ottawa). Inaddition to monetizeing these assets, we are seeking to buildout and expand our development platform for future growth.Top: TorontoSituated in the heart of the downtown financial district andproximate to many of our premier office properties, the BayAdelaide Centre is poised for development in 2006:• 2.5 million square foot capacity• Three-phase mixed-use project• Connected to underground pedestrian PATH retail center• Below-grade infrastructure already in placeBCE Place III is the final phase of the BCE Place complex.Designed for 35 stories of office space, this project wouldhave clear views of Lake Ontario. It is located adjacent toUnion Station, the key transportation hub in the city core.Middle: Midtown ManhattanOur 401 West 31 Street development site is located directlyacross from the Farley Post Office on Ninth Avenue, which iscurrently being redeveloped as the Moynihan Train Station,New York’s most highly-trafficked commuter rail hub.Significant redevelopment is taking place in this neighborhood,including the expansion of the convention center.• 2.5 million square foot capacity• Pedestrian underground connection to the transit center• Mixed-use phased retail/residential/office development• Located in West Side redevelopment zone.Bottom: CalgaryBankers Court East and West development sites straddleWestern Canada's top office complex, Bankers Hall, in theheart of downtown Calgary. Currently utilized as parkades,the sites can accommodate a 300,000 square foot building(east) and 200,000 square foot building (west).• Connected by pedestrian skyway to Bankers Hall• 15 story buildings• Development to include parking• 30-month construction schedule8
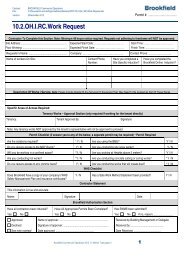
105 Adelaide Street WestExchange TowerFirst Canadian PlaceHSBC Building2 Queen Street E.Yonge/Richmond CentreBay Adelaide Centre Development SiteBay Wellington TowerBCE III Development SiteTD Canada Trust Tower245 Park Avenue401 West 31st Street Development Site300 Madison AvenueToronto Midtown ManhattanCalgaryFifth Avenue PlacePetro-Canada CentreBankers Court West Development SiteBankers HallBankers Court East Development SiteGulf Canada Square
Acquisitions through Property FundsInvesting our liquidity with joint venture partners in a fundformat enables us to enhance our returns. The propertiesacquired through the O&Y acquisition have been included ina Canadian office fund. We own a 25% interest in the fund andmanage its operations. We are also establishing an acquisitionfund to acquire central business district office assets in UnitedStates gateway markets. The fund size is $1 billion of equity towhich we have committed $300 million. Leverage is not anticipatedto exceed 75% on an overall basis, bringing the amountavailable for acquisitions to roughly $4 billion.Funds and their associated asset management feesrepresent an important area of growth for <strong>Brookfield</strong><strong>Properties</strong> as we expand our assets under management. Ourreturns are enhanced through these fees which typicallyinclude a stable base fee for providing regular on-goingservices as well as performance fees that are earned whencertain pre-determined benchmarks are exceeded. We alsoearn transaction fees for investment and leasing activitiesconducted on behalf of these funds.Core <strong>Properties</strong> of theO&Y AcquisitionSquare Feet (000’s)1. First Canadian Place, Toronto 2,7812. Gulf Canada Square, Calgary 1,1453. Place de Ville I, Ottawa 1,0894. Place de Ville II, Ottawa 1,0435. Jean Edmonds Towers, Ottawa 6456. 2 Queen Street E., Toronto 54512436510
Residential Development:Record Results, Bright OutlookWith lot and home sales setting new record levels, <strong>2005</strong> wasthe most profitable year ever for our residential developmentoperations. Largely based in Western Canada, our marketshare stands at 24% in Calgary and 10% in Edmonton.Our strategy is simple: invest in growth quadrants ofmajor centers with strong job creation and good quality oflife, and assemble 500 to 1000 contiguous acres to providemaster-planned community opportunities for homebuilders. For internal housing operations, the focus is onaffordable housing. Our future prospects are strong, with aland inventory bank of approximately 37,000 lots held fordevelopment and 4,000 lots under development acrossthe portfolio.400035003000250020001500100050002,9572002Lot & Home Sales3,3813,0132003 20043,933<strong>2005</strong>McKenzie Towne, Calgary
Portfolio by City<strong>Brookfield</strong> <strong>Properties</strong> Corporation, one of North America’s largest commercial real estate companies, owns, develops and managespremier office properties. Our portfolio comprises 66 commercial properties totaling 48 million square feet and ten development sitestotaling over eight million square feet in the downtown cores of New York, Boston, Washington, D.C., Toronto, Calgary and Ottawa.Landmark properties include the World Financial Center in New York City, and BCE Place in Toronto.UNITED STATESEffective <strong>Brookfield</strong>’sOwnership EffectiveNumber of Leased Office Retail/Other Leasable Area Interest Interest<strong>Properties</strong> % 000’s Sq. Ft. 000’s Sq. Ft. 000’s Sq. Ft. % 000’s Sq. Ft.New YorkWorld Financial CenterOne 1 87.0 1,520 108 1,628 100 1,628Two 1 100.0 2,455 36 2,491 100 2,491Three 1 81.5 1,179 53 1,232 100 1,232Four 1 100.0 1,711 89 1,800 51 917Retail 67.6 — 295 295 100 295One Liberty Plaza 1 94.2 2,194 20 2,214 100 2,214245 Park Avenue 1 99.5 1,630 62 1,692 51 863300 Madison Avenue 1 100.0 1,089 5 1,094 100 1,094Development401 West 31st Street 1 — 2,500 — 2,500 100 2,500Other 1 49.1 — 7 7 50 49 94.9 14,278 675 14,953 13,238Boston53 State Street 1 86.6 1,091 70 1,161 51 59275 State Street 1 100.0 742 260 1,002 51 5112 92.1 1,833 330 2,163 1,103Washington, D.C.1625 Eye Street 1 96.2 374 197 571 100 571701 9th Street 1 100.0 340 207 547 100 547Potomac Tower 1 100.0 236 203 439 100 4393 98.5 950 607 1,557 1,557DenverRepublic PlazaOffice 1 86.2 1,247 — 1,247 100 1,247Development and other 2 — 1,300 548 1,848 100 1,848Trade Center 2 87.9 767 43 810 100 8105 86.9 3,314 591 3,905 3,905Minneapolis33 South Sixth Street 2 86.2 1,082 695 1,777 100 1,777Dain Plaza 2 90.4 593 638 1,231 100 1,2314 87.9 1,675 1,333 3,008 3,008Subtotal United States 23 93.1 22,050 3,536 25,586 22,81113
CANADAEffective <strong>Brookfield</strong>’sOwnership EffectiveNumber of Leased Office Retail/Other Leasable Area Interest Interest<strong>Properties</strong> % 000’s Sq. Ft. 000’s Sq. Ft. 000’s Sq. Ft. % 000’s Sq. Ft.TorontoBCE PlaceBay Wellington Tower 1 91.3 1,296 42 1,338 100 1,338TD Canada Trust Tower 1 98.1 1,126 17 1,143 50 572Retail, parking and office 2 98.4 136 809 945 75 704First Canadian Place 1 94.7 2,409 372 2,781 25 695Exchange Tower Block 2 93.1 1,136 257 1,393 58 812Atrium on Bay 1 89.4 914 327 1,241 50 621Hudson Bay Centre 1 87.4 536 556 1,092 25 2732 Queen St. E 1 91.5 448 97 545 25 136Queens Quay Terminal 1 97.5 428 75 503 100 503151 Yonge St. 1 100.0 289 82 371 25 9318 King St. E 1 87.9 219 33 252 25 632 St. Clair Ave. W 1 90.6 210 90 300 25 75HSBC Building 1 100.0 188 37 225 100 22540 St. Clair Ave. W 1 93.4 117 32 149 25 37DevelopmentsBay Adelaide Centre 3 2,500 2,500 100 2,500BCE Place III 1 800 800 65 52020 93.4 12,752 2,826 15,578 9,167CalgaryBankers Hall 3 99.5 1,943 750 2,693 50 1,347Petro Canada Centre 2 99.9 1,707 245 1,952 50 9765th Avenue Place 2 99.9 1,428 255 1,683 50 842Gulf Canada Square 1 97.4 1,052 93 1,145 25 286Altius Centre 1 99.5 303 75 378 25 95840 - 7th Ave. SW 1 97.7 250 37 287 25 72McFarlane Tower 1 99.3 233 44 277 25 69Franklin Atrium 1 88.0 143 102 245 25 61Altalink Place 1 100.0 77 28 105 25 26Mount Royal Place 1 96.0 54 28 82 25 20Franklin Building 1 100.0 51 38 89 25 22DevelopmentBankers Court 2 — 500 — 500 50 25017 99.1 7,741 1,695 9,436 4,066OttawaPlace de Ville I 2 100.0 558 531 1,089 25 272Place de Ville II 2 99.3 577 466 1,043 25 261Jean Edmonds Towers 2 99.9 528 117 645 25 1612204 Walkley 1 100.0 104 — 104 25 262200 Walkley 1 100.0 54 — 54 25 14DevelopmentPlace de Ville III 1 — 500 — 500 25 1259 99.7 2,321 1,114 3,435 859Other CommercialRoyal Centre, Vancouver 1 93.0 493 360 853 100 853Canadian Western Bank, Edmonton 1 93.3 372 124 496 25 124Enbridge Tower, Edmonton 1 98.3 178 34 212 25 53330 St. Mary Avenue, Winnipeg 1 89.3 143 34 177 25 44175 Hargrave Street, Winnipeg 1 71.0 69 5 74 25 194342 Queen Street, Niagara Falls 1 91.2 149 60 209 25 52Other 1 96.0 71 3 74 100 747 92.3 1,475 620 2,095 1,219Subtotal Canada 53 95.9 24,289 6,255 30,544 15,311Total portfolio 76 94.6 46,339 9,791 56,130 38,122Less: non-controlling interests (1,485)<strong>Brookfield</strong>’s net effective ownership 36,63714
Management’s Discussion and Analysis of Financial ResultsPART I – OBJECTIVES AND FINANCIAL HIGHLIGHTS................................................................................................... 17PART II – FINANCIAL STATEMENT ANALYSIS ............................................................................................................... 22PART III – RISKS AND UNCERTAINTIES ........................................................................................................................ 43PART IV – CRITICAL ACCOUNTING POLICIES AND ESTIMATES ................................................................................... 47PART V – BUSINESS ENVIRONMENT AND OUTLOOK .................................................................................................. 51FORWARD-LOOKING STATEMENTSThis annual report to shareholders, particularly the “Business Environment and Outlook” section, contains forward-looking statementsand information within the meaning of applicable securities legislation. Although <strong>Brookfield</strong> <strong>Properties</strong> believes that the anticipatedfuture results, performance or achievements expressed or implied by the forward-looking statements and information are based uponreasonable assumptions and expectations, the reader should not place undue reliance on forward-looking statements and informationbecause they involve known and unknown risks, uncertainties and other factors which may cause the actual results, performance orachievements of the company to differ materially from anticipated future results, performance or achievements expressed or implied bysuch forward-looking statements and information. Factors that could cause actual results to differ materially from those set forth in theforward-looking statements and information include general economic conditions; local real estate conditions, including thedevelopment of properties in close proximity to the company’s properties; timely leasing of newly-developed properties and re-leasing ofoccupied square footage upon expiration; dependence on tenants’ financial condition; the uncertainties of real estate development andacquisition activity; the ability to effectively integrate acquisitions; interest rates; availability of equity and debt financing; the impact ofnewly-adopted accounting principles on the company’s accounting policies and on period-to-period comparisons of financial results;and other risks and factors described from time to time in the documents filed by the company with the securities regulators in Canadaand the United States including in the <strong>Annual</strong> Information Form under the heading “Business of <strong>Brookfield</strong> <strong>Properties</strong> – Company andReal Estate Industry Risks.” The company undertakes no obligation to publicly update or revise any forward-looking statements orinformation, whether as a result of new information, future events or otherwise.15
Management’s Discussion and Analysis of Financial ResultsFebruary 8, 2006PART I – OBJECTIVES AND FINANCIAL HIGHLIGHTSBASIS OF PRESENTATIONFinancial data included in Management’s Discussion and Analysis (“MD&A”) has been prepared in accordance with Canadian generallyaccepted accounting principles (“GAAP”) with non-GAAP measures such as net operating income and funds from operations beingreconciled to appropriate Canadian GAAP measures. All dollar references, unless otherwise stated, are in millions of US dollars exceptper share amounts. Amounts in Canadian dollars are identified as “C$”.The following discussion and analysis is intended to provide readers with an assessment of the performance of <strong>Brookfield</strong> <strong>Properties</strong>Corporation (“<strong>Brookfield</strong> <strong>Properties</strong>”) over the past two years as well as our financial position and future prospects. It should be read inconjunction with the audited consolidated financial statements and appended notes which begin on page 54 of this report. In ourdiscussion of operating performance, we refer to net operating income and funds from operations on a total and per share basis. Netoperating income is defined as income from property operations after operating expenses have been deducted, but prior to deductingfinancing, administration and income tax expenses. Funds from operations is defined as net income prior to extraordinary items, noncashitems and depreciation and amortization. We use net operating income and funds from operations to assess the operating resultsof the company, as net operating income is an important measure in assessing operating performance and funds from operations is arelevant measure in analyzing real estate, as commercial properties generally appreciate rather than depreciate. We provide thecomponents of net operating income on page 35 and a full reconciliation from net income to funds from operations on page 34. Netoperating income and funds from operations are both non-GAAP measures which do not have any standardized meaning prescribed byGAAP and therefore may not be comparable to similar measures presented by non-real estate companies.Additional information, including our <strong>Annual</strong> Information Form, is available on our Web site at www.brookfieldproperties.com, or onwww.sedar.com or www.sec.gov.FINANCIAL HIGHLIGHTS<strong>Brookfield</strong> <strong>Properties</strong>’ financial results are as follows:(Millions, except per share amounts) <strong>2005</strong> 2004 2003Results of operationsNet incomeExcluding lease termination income and gains (1) $ 164 $ 102 $ 162Including lease termination income and gains 164 138 232Net income per share – dilutedExcluding lease termination income and gains (1) $ 0.69 $ 0.43 $ 0.67Including lease termination income and gains 0.69 0.58 0.96Common share dividends paid per share 0.65 0.42 0.34 (2)Funds from operationsExcluding lease termination income and gains (1) $ 435 $ 403 $ 343Including lease termination income and gains 435 462 442Funds from operations per share – dilutedExcluding lease termination income and gains (1) $ 1.85 $ 1.70 $ 1.43Including lease termination income and gains 1.85 1.95 1.85Balance sheet dataTotal assets $ 9,513 $ 8,800 $ 8,382Commercial properties 7,430 6,555 6,179Commercial property debt 5,216 4,754 4,754Shareholders’ equity 1,943 1,992 1,938(1)Exclusion of lease termination income and gains from these results is an additional non-GAAP measure which we believe provides readers with a supplementalbasis for evaluating our on-going operations since lease terminations and gains are the result of unpredictable and opportunistic events. The 2004 and 2003results included $60 million and $100 million, respectively, of lease termination income and gains ($36 million and $60 million, respectively, net of tax forpurposes of net income). There was no lease termination income or gains in <strong>2005</strong>.(2)Excludes the distribution of <strong>Brookfield</strong> Homes Corporation (“<strong>Brookfield</strong> Homes”). On January 6, 2003, we distributed all of the common shares of <strong>Brookfield</strong>Homes to common shareholders of record on January 2, 2003. Common shareholders received one common share of <strong>Brookfield</strong> Homes for each five commonshares of <strong>Brookfield</strong> <strong>Properties</strong> held on the date of record, and the transaction was recorded as a distribution to shareholders at the carried value of ourinvestment in <strong>Brookfield</strong> Homes.17
OVERVIEW OF THE BUSINESS<strong>Brookfield</strong> <strong>Properties</strong> is a publicly-traded North American commercial real estate company listed on the New York and Toronto stockexchanges under the symbol BPO. We operate in two principal business segments, the first being the ownership, development andmanagement of premier commercial office properties in select cities in North America, and the second being the development ofresidential land. At December 31, <strong>2005</strong>, the book value of <strong>Brookfield</strong> <strong>Properties</strong>’ assets was $9.5 billion. During <strong>2005</strong> we generated $164million of net income ($0.69 per diluted share) and $435 million of funds from operations ($1.85 per diluted share).COMMERCIAL PROPERTY OPERATIONSOur strategy of owning, pro-actively managing and developing premier properties in supply-constrained, high-growth markets withhigh barriers to entry has created one of North America’s most distinguished portfolios of office properties. Our portfolio consists of 66commercial properties totaling 48 million square feet and ten development sites totaling over eight million square feet. Our primarymarkets are the financial, energy and government center cities of New York, Boston, Washington, D.C., Toronto, Calgary and Ottawa.We intend to continue our strategy of concentrating operations within a select number of supply-constrained markets with attractivetenant bases in order to maintain a meaningful presence and build on the strength of our tenant relationships within these markets.We remain focused on the following strategic priorities:• Surfacing value from our properties through pro-active leasing and select redevelopment initiatives;• Prudent capital management including the refinancing of mature properties and investing in joint venture opportunities withinstitutional partners who seek to benefit from the depth of our expertise;• Monetizing development assets as the economy rebounds and continued supply constraints create opportunities.The following table summarizes our investment by market:Leasable<strong>Brookfield</strong><strong>Properties</strong>’Net BookRegionNumber of<strong>Properties</strong>Area(000’s Sq.Ft.)Owned Interest(000’s Sq. Ft.)Book Value(Millions)Debt(Millions)Equity(Millions)New York, New York 8 12,453 10,738 $ 3,824 $ 3,122 $ 702Boston, Massachusetts 2 2,163 1,103 325 159 166Washington, D.C. 3 1,557 1,557 395 357 38Toronto, Ontario 16 12,278 6,147 1,399 704 695Calgary, Alberta 15 8,936 3,816 570 409 161Ottawa, Ontario 8 2,935 734 100 50 50Denver, Colorado (1) 3 2,605 2,605 344 221 123Minneapolis, Minnesota 4 3,008 3,008 429 180 249Other 7 2,095 1,219 119 65 5466 48,030 30,927 $ 7,505 $ 5,267 $ 2,238Office development sites 10 8,100 7,195 224 — 224Total 76 56,130 38,122 $ 7,729 $ 5,267 $ 2,462(1)Includes $75 million of assets and $51 million of liabilities related to discontinued operationsAn important characteristic of our portfolio is the strong credit quality of our tenants. We direct special attention to credit quality inorder to ensure the long-term sustainability of rental revenues through economic cycles. Major tenants with over 600,000 square feet ofspace in the portfolio include Merrill Lynch, Government of Canada, CIBC, Bank of Montreal, JPMorgan Chase, RBC Financial Group,Petro-Canada, Target Corporation and Imperial Oil. A detailed list of major tenants is included in Part III of this MD&A which deals with“Risks and Uncertainties” commencing on page 43.Our strategy is to sign long-term leases in order to mitigate risk and reduce our overall retenanting costs. We typically commencediscussions with tenants regarding their space requirements well in advance of the contractual expiration, and while each market isdifferent, the majority of our leases, when signed, extend between 10 and 20-year terms. As a result of this strategy, approximately 5% ofour leases mature annually.18
Following is the breakdown of lease maturities by market with associated in-place rental rates:Total PortfolioNew York/Boston/Washington, D. C.Toronto/Calgary/OttawaDenver/Minneapolis/OtherYear of Expiry000’sSq. Ft. %NetRateper Sq.Ft.-$000’sSq. Ft. %NetRateper Sq.Ft.-$000’sSq. Ft. %NetRateper Sq.Ft.-$000’sSq. Ft. %NetRateper Sq.Ft.-$Currently available 2,242 5.4 784 5.2 763 4.2 695 11.32006 1,463 3.6 $ 14 382 2.5 $ 15 772 3.6 $ 13 309 5.0 $ 102007 1,402 3.4 19 103 0.7 26 959 4.9 17 340 5.5 132008 3,427 8.3 17 717 4.8 27 2,110 6.1 13 600 9.7 122009 1,868 4.5 16 127 0.8 31 1,282 6.3 14 459 7.4 82010 3,457 8.3 25 689 4.6 38 2,254 12.5 21 514 8.3 102011 3,097 7.5 25 616 4.1 42 2,228 12.3 18 253 4.1 122012 2,378 5.8 20 664 4.4 20 1,370 7.6 19 344 5.6 172013 & beyond 28,696 53.2 25 12,091 72.9 33 12,411 42.5 17 4,194 43.1 1248,030 100.0 $ 25 16,173 100.0 $ 33 24,149 100.0 $ 17 7,708 100.0 $ 12Weighted average market net rent $ 25 $ 33 $ 20 $ 14Commercial DevelopmentWe hold interests in over eight million square feet of high-quality, centrally-located development sites at various stages of planning andconstruction. We will seek to monetize these sites through development only when our risk-adjusted return hurdles are met and whensignificant pre-leasing targets with one or more lead tenants have been achieved. As the economy rebounds, continued supplyconstraints should create opportunities for us to enhance value through the development of these assets.The following table summarizes our commercial development projects at December 31, <strong>2005</strong>:LocationNumberof Sites Ownership Sq. Ft.New York, New York401 West 31st Street Ninth Avenue across from Moynihan Train Station 1 100% 2,500,000Toronto, OntarioBay Adelaide Centre Bay and Adelaide Streets 3 100% 2,500,000BCE Place III Third phase of BCE Place project 1 65% 800,000Calgary, AlbertaBankers Court East and West Parkades adjacent to Bankers Hall 2 50% 500,000Ottawa, OntarioPlace de Ville III Third phase of Place de Ville project located at 300 Queen Street 1 25% 500,000Denver, Colorado425 15th Street One block from Republic Plaza 1 100% 800,000Tremont Garage One block from Republic Plaza 1 100% 500,000Total 10 8,100,000Residential DevelopmentOur wholly-owned subsidiaries, Carma Inc., Carma Developers LP and <strong>Brookfield</strong> Homes (Ontario), develop residential land andconduct homebuilding operations. These business units primarily entitle and develop land in master-planned communities and sellthese lots to other homebuilders. Through these units we also build and sell homes. Operations are currently focused in four markets:Alberta, Ontario, Colorado and Texas. Most of the land holdings were purchased in the mid-1990’s, and as a result have an embeddedcost advantage over many companies which are acquiring land today at much higher prices. In addition, our development operationscontinue to benefit from the low interest rate environment and strong demand in the North American housing market.19
We intend to continue to grow this business by selectively acquiring land that provides the residential development groups withattractive projects that are consistent with our overall strategy and management expertise. We acquire land only if we believe that it willprovide a minimum return on invested capital.We classify land into two categories, land held for development and land under development. Land held for development includes costsof acquiring land as well as general infrastructure costs to service the land within a community that is not directly related to saleable lots.Once development of a phase begins, the associated costs with that phase are transferred from land held for development to land underdevelopment which includes all underlying costs that are attributable to the phase of saleable lots, including the underlying land, roads,parks and housing construction costs.The following table summarizes our residential land development at December 31, <strong>2005</strong>:Under DevelopmentHeld for DevelopmentNumber of LotsBook Value(Millions)EstimatedNumber of LotsBook Value(Millions)Alberta 2,713 $ 113 24,943 $ 156Ontario 497 32 6,983 39Colorado 729 19 2,931 23Texas and other 158 2 1,859 7Total 4,097 $ 166 36,716 $ 225PERFORMANCE MEASUREMENTThe key indicators by which we measure our performance are:20• Net income per share;• Net operating income;• Funds from operations per share;• Overall indebtedness level;• Weighted average cost of debt; and• Occupancy levels.While we monitor and analyze our financial performance using a number of indicators, our primary business objective of generatingreliable and growing cashflow is monitored and analyzed using net income, net operating income and funds from operations. While netincome is calculated in accordance with generally accepted accounting principles (“GAAP’), net operating income and funds fromoperations are both non-GAAP financial measures which do not have any standardized meaning prescribed by GAAP and are thereforeunlikely to be comparable to similar measures presented by other companies. We provide the components of net operating income onpage 35 and a full reconciliation from net income to funds from operations on page 34 of this MD&A.Net IncomeNet income is calculated in accordance with GAAP. Net income is used as a key indicator in assessing the profitability of the company.Net Operating IncomeNet operating income is defined as income from property operations after operating expenses have been deducted, but prior todeducting financing, administration and income tax expenses. Net operating income is used as a key indicator of performance as itrepresents a measure over which management has control. We measure the performance of management by comparing theperformance of the property portfolio adjusted for the effect of current and prior year sales and acquisitions.Funds from OperationsFunds from operations is defined as net income prior to extraordinary items, non-cash items and depreciation and amortization. Whilewe believe that funds from operations is the most relevant measure to analyze real estate as commercial properties generally appreciaterather than depreciate, we believe that both funds from operations and net income are both relevant measures. We compute funds fromoperations substantially in accordance with the definition provided by the Real Property Association of Canada (“RealPac”). Under thisdefinition, funds from operations does not represent or approximate cash generated from operating activities determined in accordancewith GAAP in Canada or the United States, and should not be considered as an alternative to GAAP measures. Accordingly, we provide areconciliation of funds from operations to net income, consistent with the definition provided by RealPac as set out above. Areconciliation is not provided to cashflow from operating activities, as it is often subject to fluctuations based on the timing of workingcapital payments.
KEY PERFORMANCE DRIVERSIn addition to monitoring and analyzing performance in terms of net operating income and funds from operations, we consider thefollowing items to be important drivers of our current and anticipated financial performance:• Increases in occupancies by leasing up vacant space;• Increases in rental rates as market conditions permit; and• Reduction in occupancy costs through achieving economies of scale and diligently managing contracts.We also believe that the key external performance drivers are:• The availability of new property acquisitions which fit into our strategic plan;• The availability of equity capital at a reasonable cost; and• The availability of debt capital at a cost and on terms conducive to our goals.SIGNIFICANT EVENTSDuring the fourth quarter, we completed the acquisition of a 25% joint venture interest in O&Y <strong>Properties</strong> Corporation and O&Y RealEstate Investment Trust (collectively, “O&Y”). The O&Y portfolio consists of 27 office properties and one development site totaling 11.6million square feet in Toronto, Calgary, Ottawa, Edmonton and Winnipeg. Included in the portfolio is First Canadian Place, which isdirectly connected to <strong>Brookfield</strong> <strong>Properties</strong>’ Exchange Tower in Toronto. We serve as property and asset manager for the entire portfolio.The following is a summary of our investment in the portfolio:Number of Leasable Area<strong>Brookfield</strong> <strong>Properties</strong>’Owned InterestPurchase PriceBook ValueRegion <strong>Properties</strong> (000’s Sq. Ft.) (000’s Sq. Ft.) (Millions)Toronto, Ontario 6 4,397 1,099 $ 266Calgary, Alberta 8 2,608 651 110Ottawa, Ontario 8 2,935 734 97Edmonton, Alberta 2 708 177 14Winnipeg, Manitoba 2 252 63 3Niagara Falls, Ontario 1 209 52 227 11,109 2,776 $ 492Office development site 1 500 125 3Total commercial and development properties 28 11,609 2,901 $ 495Accounts receivable and other assets 14Intangible assets 56Accounts payable and other liabilities assumed (14)Intangible liabilities (97)Future income tax liabilities assumed (26)Commercial property debt assumed (1) (246)Total purchase price $ 182(1)Includes acquisition financing of $110 million21
PART II – FINANCIAL STATEMENT ANALYSISASSET PROFILEOur total asset book value was $9.5 billion at December 31, <strong>2005</strong>, an increase of $713 million from 2004. The increase in total assets isprimarily attributable to the acquisition of the O&Y portfolio, as well as the impact of the strengthening Canadian dollar. The following isa summary of our assets over the past two years:(Millions) <strong>2005</strong> 2004Commercial properties $ 7,430 $ 6,555Development properties 615 716Receivables and other 955 739Restricted cash and deposits 316 297Marketable securities 58 285Cash and cash equivalents 64 112Assets related to discontinued operations 75 96Total $ 9,513 $ 8,800COMMERCIAL PROPERTIESOur acquisition of the O&Y portfolio accounts for the majority of the increase in book value of commercial properties from December31, 2004. Our 25% joint venture interest in the O&Y portfolio was purchased for approximately $182 million, after the assumption ofdebt and acquisition financing totaling $110 million in the fourth quarter of <strong>2005</strong> and comprises 11.6 million square feet in Toronto,Calgary, Ottawa, Edmonton and Winnipeg.Both Three World Financial Center and Hudson’s Bay Centre were reclassified to commercial properties in <strong>2005</strong>. The consolidatedcarrying value of our North American properties is approximately $243 per square foot, significantly less than the estimated replacementcost of these assets.A breakdown of our commercial properties by region is as follows:Leasable Area<strong>Brookfield</strong> <strong>Properties</strong>’Owned Interest<strong>2005</strong>Book Value2004Book ValueRegion (000’s Sq. Ft.) (000’s Sq. Ft.) (Millions) (Millions)New York, New York 12,453 10,738 $ 3,824 $ 3,542Boston, Massachusetts 2,163 1,103 325 328Washington, D.C. 1,557 1,557 395 397Toronto, Ontario 12,278 6,147 1,399 1,068Calgary, Alberta 8,936 3,816 570 448Ottawa, Ontario 2,935 734 100 —Denver, Colorado (1) 2,605 2,605 344 370Minneapolis, Minnesota 3,008 3,008 429 414Other 2,095 1,219 119 84Total 48,030 30,927 $ 7,505 $ 6,651(1)Includes $75 million and $96 million of discontinued operations at December 31, <strong>2005</strong> and 2004, respectivelyTENANT INSTALLATION COSTS AND CAPITAL EXPENDITURESUpon the signing of the majority of our leases, we provide tenant improvements for leased space in order to accommodate the specificspace requirements of the tenant. In addition to this capital, leasing commissions are paid to third-party brokers representing tenants inlease negotiations. Tenant improvements and leasing commissions are capitalized in the year incurred, amortized over the term of thelease and recovered through rental payments. Expenditures for tenant installation costs in <strong>2005</strong> totaled $123 million, compared with the$82 million expended in 2004. The increase was a result of tenant improvements incurred on the lease-up of space at Three WorldFinancial Center.On an annual basis, one to three million square feet of leases expire on average with a cost to replace these tenancies approximating $15to $20 per square foot, with each region of operation varying in actual cost per square foot. The average expenditure on tenantinducements across the portfolio over the last two years was $10 per square foot.22
Tenant installation costs are summarized as follows:(Millions) <strong>2005</strong> 2004Leasing commissions $ 15 $ 15Tenant improvements 108 67Total $ 123 $ 82We also invest in on-going maintenance and capital improvement projects to sustain the high quality of the infrastructure and tenantservice amenities in our properties. Due to the relatively recent construction and major renovation of our core properties as well as highqualityconstruction standards, our recurring capital maintenance expenditures are lower than industry norms. Capital maintenanceexpenditures totaled $21 million in <strong>2005</strong>, compared with $26 million in 2004. These expenditures exclude repairs and maintenance costswhich are recovered through contractual tenant cost recovery payments.Capital expenditures include revenue-enhancing capital expenditures which represent improvements to an asset or reconfiguration ofspace to increase rentable area or increase current rental rates, and include non-revenue enhancing expenditures, which are thoserequired to extend the service life of an asset.The details of our capital expenditures are summarized as follows:(Millions) <strong>2005</strong> 2004Revenue enhancing $ 15 $ 14Non-revenue enhancing 6 12Total $ 21 $ 26ASSETS RELATED TO DISCONTINUED OPERATIONSIn the third and fourth quarters of <strong>2005</strong>, two properties, the Colorado State Bank Building (“CSBB”) and the World Trade Center Denver(“WTD”), respectively, met the criteria for being classified as held for sale. The sale of CSBB closed in December <strong>2005</strong> and the dispositionof WTD was completed in January 2006. We have reclassified $75 million (2004 - $96 million) of assets and $51 million (2004 - $64million) of liabilities to discontinued operations in connection with these properties.DEVELOPMENT PROPERTIESDevelopment properties consist of commercial property development sites, density rights and related infrastructure, as well asresidential land and infrastructure in our land development business. The total book value of this development land and infrastructurewas $615 million at December 31, <strong>2005</strong>, a decrease of $101 million from $716 million in 2004. The decrease is primarily attributable tothe reclassification of both Three World Financial Center and Hudson’s Bay Centre to commercial properties, offset by the purchase ofthe remaining 50% interest in the Bay Adelaide Centre in Toronto and the expansion of our residential development business.The components of our development properties are as follows:(Millions) <strong>2005</strong> 2004Commercial developments $ 224 $ 399Residential development 391 317Total $ 615 $ 71623
Commercial developmentsThe details of the commercial development property portfolio are as follows:(Millions)BuildableSq. Ft. <strong>2005</strong> 2004Bay Adelaide Centre, Toronto 2,500,000 $ 191 $ 101Three World Financial Center, New York (1) — — 248Hudson’s Bay Centre, Toronto (1) — — 29Other:401 West 31 st Street, New York 2,500,000BCE Place III, Toronto 800,000Bankers Court, Calgary 500,000Place de Ville III, Ottawa 500,000425 15 th Street, Denver 800,000Tremont Garage, Denver 500,0005,600,000 33 21Total 8,100,000 $ 224 $ 399(1)Reclassified to commercial properties in <strong>2005</strong>Although we are not a speculative developer, we are a full-service real estate company with in-house development expertise. Withapproximately 8.1 million square feet of high-quality, centrally-located development properties in New York, Toronto, Calgary, Ottawaand Denver, we will undertake developments when our risk-adjusted returns are adequate and significant pre-leasing of space has beenachieved.In the fourth quarter of <strong>2005</strong>, we increased our ownership in the Bay Adelaide Centre development to 100% by acquiring the remaining50% interest at a price of $90 million, payable with $70 million cash and a $20 million vendor take-back mortgage. This project has inplace full below-grade infrastructure to service 2.5 million square feet of office and residential space. A fully operational undergroundparking facility is currently generating revenue.We also own expansion rights for a third office tower at BCE Place, our flagship Toronto office complex, which includes approximately800,000 square feet of density. We have similar rights to develop 2.5 million square feet at 401 West 31st Street in Midtown Manhattan,New York; 500,000 square feet of office space at Bankers Court in Calgary; 500,000 square feet at Place de Ville III in Ottawa; 800,000square feet at 425 15th Street in Denver; and 500,000 square feet at Tremont Garage in Denver.The details of our development and redevelopment expenditures on commercial and development properties are as follows:(Millions) <strong>2005</strong> 2004Construction costs $ 30 $ 21Interest capitalized 15 14Property taxes and other 5 20Total $ 50 $ 55Residential developmentOur land development operations are focused in four markets: Alberta, Ontario, Colorado, and Texas. The book value of theseinvestments at December 31, <strong>2005</strong> was $391 million, compared with $317 million at the end of 2004. The increase was primarilyattributable to acquisitions and the strengthening of the Canadian dollar, offset by residential inventory sold.The details of our residential development property portfolio are as follows:(Millions) <strong>2005</strong> 2004Under development $ 166 $ 132Held for development 225 185Total $ 391 $ 31724
The details of the residential development land under development and held for development are as follows:Number of LotsBook Value (Millions)Under Development <strong>2005</strong> 2004 <strong>2005</strong> 2004Alberta 2,713 2,585 $ 113 $ 90Ontario 497 748 32 16Colorado 729 818 19 22Texas and other 158 30 2 4Total 4,097 4,181 $ 166 $ 132EstimatedNumber of Lots Number of Acres Book Value (Millions)Held for Development <strong>2005</strong> 2004 <strong>2005</strong> 2004 <strong>2005</strong> 2004Alberta 24,943 23,795 4,428 4,215 $ 156 $ 125Ontario 6,983 5,738 1,364 1,164 39 28Colorado 2,931 3,222 548 666 23 24Texas and other 1,859 2,080 541 575 7 8Total 36,716 34,835 6,881 6,620 $ 225 $ 185RECEIVABLES AND OTHER ASSETSReceivables and other assets increased to $955 million at December 31, <strong>2005</strong> from $739 million at December 31, 2004. Receivables andreal estate mortgages increased by $116 million to $551 million at December 31, <strong>2005</strong> primarily as a result of the expansion of our landand housing operations and additional straight-line and free rent receivable recognized during the year. In September 2003, the CICAissued EIC 140 “Accounting for Operating Leases Acquired in either an Asset Acquisition or a Business Combination” in which theEmerging Issues Committee of the CICA concluded that an enterprise that acquires real estate should allocate a portion of the purchaseprice to in-place operating leases, based on their fair value that the enterprise acquires in connection with the real estate property.Accordingly, we assessed the fair value of acquired intangible assets and liabilities, including tenant improvements, above- and belowmarketleases, origination costs, and other identified intangible assets and assumed liabilities, and have allocated $125 million (2004 -$70 million) to tenant relationships and above market leases in connection with the O&Y acquisition and certain other previouspurchases.The components of receivables and other assets are as follows:(Millions) <strong>2005</strong> 2004Receivables and real estate mortgages $ 551 $ 435Prepaid expenses and other assets 279 234Intangible assets 125 70Total $ 955 $ 739RESTRICTED CASH AND DEPOSITSCash and deposits are considered restricted when there are limits imposed by third parties that prevent its use for current purposes.Restricted cash and deposits increased to $316 million from $297 million in 2004. The increase is primarily a result of the proceeds wereinvested from the sale of CSBB. These proceeds are being held by a qualified intermediary for reinvestment in commercial properties.Included in restricted cash and deposits is $256 million (2004 - $268 million) of short-term government securities held in a trust accountto match interest and principal payments of the $246 million mortgage on One Liberty Plaza maturing in 2007. In 2004, our commercialdebt in respect to One Liberty Plaza was presented net of the related defeasance securities. To conform with current year presentation,these securities have been reclassified to restricted cash and deposits.CASH AND MARKETABLE SECURITIESWe endeavor to maintain high levels of liquidity to ensure that we can react quickly to potential investment opportunities. This liquidityconsists of cash and marketable securities which contribute investment returns, as well as committed lines of credit. To ensure wemaximize our returns, cash balances are generally carried at a modest level and excess cash is used to repay revolving credit lines. Thesefunds are invested in short-term marketable securities. Marketable securities consist of a portfolio of fixed-rate corporate bonds whichare carried at amortized cost with a fair value which approximates their book value at an average yield of 2.6%. The bond portfoliomatures over the next two years.25
As at December 31, <strong>2005</strong>, cash balances decreased to $64 million from $112 million at December 31, 2004 and marketable securitiesdecreased to $58 million from $285 million at December 31, 2004, as these funds were used to purchase our interest in the O&Yportfolio and the remaining 50% interest in the Bay Adelaide Centre.UTILIZATION OF CASH RESOURCESThe following table illustrates the utilization of cashflow generated by our operating activities, and our financing and investinginitiatives:(Millions) <strong>2005</strong> 2004 TotalCashflow from operating activities $ 106 $ 459 $ 565FinancingBorrowings, net of repayments 283 (182) 101Net issuance of preferred shares — 261 261Net repurchase of common shares (66) (33) (99)Shareholder distributions (149) (261) (410)68 (215) (147)InvestingMarketable securities 227 (18) 209Acquisitions of real estate, net (359) (144) (503)Development and redevelopment (50) (55) (105)Restricted cash and deposits (19) (21) (40)Capital expenditures (21) (26) (47)(222) (264) (486)Decrease in cash $ (48) $ (20) $ (68)Cashflow from operating activities represents the primary source of liquidity to service debt, to fund deferred maintenance and leasingcosts and to fund distributions on shares. Cashflow from operating activities is dependent upon occupancy levels of properties owned,rental rates achieved and timing of the collection of receivables and payment of payables.26
LIABILITIES AND SHAREHOLDERS’ EQUITYOur asset base of $9.5 billion is financed with a combination of debt, capital securities and preferred and common equity. Thecomponents of our liabilities and shareholders’ equity over the past two years are as follows:(Millions) <strong>2005</strong> 2004LiabilitiesCommercial property debt $ 5,216 $ 4,754Accounts payable and other liabilities 626 452Future income tax liability 188 96Liabilities related to discontinued operations 51 64Capital securities 1,101 1,069Non-controlling interests 59 53Preferred equity - subsidiaries 329 320Shareholders’ equityPreferred equity - corporate 45 45Common equity 1,898 1,947Total $ 9,513 $ 8,800COMMERCIAL PROPERTY DEBTCommercial property debt totaled $5.2 billion at December 31, <strong>2005</strong>, compared with $4.8 billion at December 31, 2004. The increaseduring <strong>2005</strong> is due to the acquisition of the O&Y portfolio, the strengthening of the Canadian dollar and additional corporate borrowing,offset by principal amortization. Commercial property debt at December 31, <strong>2005</strong> had an average interest rate of 6.5% and an averageterm to maturity of nine years. Predominantly all of our commercial property debt is recourse only to specific properties, therebyreducing the overall financial risk to the company.Our financing targets and results are set out in the following table:Three year<strong>Annual</strong> ResultsObjective average <strong>2005</strong> 2004 2003Maintain debt to total market capitalization of 50% or less 38% 34% 37% 42%Move toward long-term goal of 95% non-recourse debt 89% 88% 93% 86%Maintain interest expense coverage of 2.3x or greater 2.5x 2.6x 2.6x 2.3xIn addition, we attempt to match the maturity of our commercial property debt portfolio with the average lease term of our properties.At December 31, <strong>2005</strong>, both the average term to maturity of our commercial property debt and our average lease term was nine years.During <strong>2005</strong>, we financed or refinanced $684 million of commercial property debt. The details are as follows:Financed / Refinanced(Millions) Mortgage Interest Rate %Corporate revolver facility $ 350 LIBOR + 110bpsOne World Financial Center, New York 300 LIBOR + 100bpsAtrium on Bay, Toronto 34 CDOR + (95bps-115bps)Total $ 684We increased our bank credit facility by $200 million to $350 million at a rate of LIBOR + 110 basis points, a reduction of five basispoints from the previous facility. The bank credit facility is in the form of a three-year revolving facility and was drawn in the amount of$274 million as at December 31, <strong>2005</strong> ($20 million at December 31, 2004). We refinanced One World Financial Center with a $300million, three-year recourse mortgage debt at a rate of LIBOR + 100 basis points. We also refinanced Atrium on Bay for $34 million on aone-year floating rate basis at a rate ranging from 95 to 115 basis points over the one-month CDOR Interbank rate while the asset isrepositioned.As at December 31, <strong>2005</strong>, we had approximately $397 million (December 31, 2004 - $216 million) of indebtedness outstanding to<strong>Brookfield</strong> Asset Management Inc. and its affiliates, $172 million of which is included in capital securities and the remainder of theindebtedness balance is included in our commercial property debt. Interest expense related to this indebtedness, including preferreddividends reclassified to interest expense, totaled $9 million in <strong>2005</strong>, compared to $6 million in 2004, and was recorded at the exchangeamount.27
The details of commercial property debt at December 31, <strong>2005</strong> are as follows:Commercial PropertyLocationInterestRate %MaturityDate<strong>Brookfield</strong><strong>Properties</strong>’ProportionateShare (Millions) Mortgage DetailsAtrium on Bay Toronto 4.30 2006 $ 34 Non-recourse, floating rateOne Liberty Plaza (1) New York 6.98 2007 246 Non-recourse, fixed rateTD Canada Trust Tower Toronto 6.60 2007 108 Non-recourse, fixed ratePetro-Canada Centre Calgary 6.43 2008 112 Non-recourse, fixed rateOne World Financial Center New York 5.39 2009 300 Recourse, floating rateFirst Canadian Place Toronto 8.06 2009 64 Non-recourse, fixed rate245 Park Avenue New York 6.65 2011 243 Non-recourse, fixed rateOne Liberty Plaza New York 6.75 2011 407 Non-recourse, fixed rateFifth Avenue Place Calgary 7.59 2011 67 Non-recourse, fixed ratePotomac Tower Washington 4.72 2011 75 Non-recourse, fixed rateExchange Tower Toronto 6.83 2012 57 Non-recourse, fixed rateTwo World Financial Center New York 6.91 2013 659 Non-recourse, fixed rateFour World Financial Center New York 6.95 2013 341 Non-recourse, fixed rateBay Wellington Tower Toronto 6.49 2013 306 Non-recourse, fixed rateBankers Hall Calgary 7.20 2013 155 Non-recourse, fixed rateRepublic Plaza Denver 5.13 2014 170 Non-recourse, fixed rate1625 Eye Street Washington 6.00 2014 129 Non-recourse, fixed rateRoyal Centre Vancouver 7.50 2022 44 Non-recourse, fixed rate53 State Street Boston 6.91 2023 72 Non-recourse, fixed rate33 South Sixth Street Minneapolis 6.72 2027 97 Non-recourse, fixed rateDain Plaza Minneapolis 7.37 2027 83 Non-recourse, fixed rate701 9th Street Washington 6.73 2028 153 Non-recourse, fixed rate75 State Street Boston 7.00 2028 87 Non-recourse, fixed rate300 Madison Avenue New York 7.26 2032 400 Non-recourse, fixed rate300 Madison Avenue New York 3.55 2012 109 Non-recourse, floating rateCorporate credit facilities — 324 Recourse, floating rateO&Y acquisition financing andother assumed debt — 187 Various termsDevelopment and other debt — 187 Various termsTotal 6.50% $ 5,216(1)Included in restricted cash and deposits is $256 of securities to match interest and principal payments on this commercial property debtCommercial property debt maturities for the next five years and thereafter are as follows:Weighted Average(Millions) Scheduled Interest Rate atYear Amortization Maturities Total Dec. 31, <strong>2005</strong>2006 $ 60 $ 210 $ 270 5.2%2007 263 371 634 6.5%2008 197 180 377 5.8%2009 174 663 837 5.4%2010 185 4 189 6.4%2011 and thereafter — 2,909 2,909 6.5%Total $ 879 $ 4,337 $ 5,216 6.5%The most significant maturity in the next five years is the floating-rate recourse mortgage which was placed on One World FinancialCenter in 2003, and refinanced in <strong>2005</strong>, in order to facilitate flexibility in tenant discussions on this project and to minimize borrowingcosts. We expect to refinance this facility in the future with long-term, fixed-rate debt.28
CONTRACTUAL OBLIGATIONSThe following table presents our contractual obligations over the next five years:Payments Due By Period(Millions) Total 1 - 3 Years 4 - 5 Years After 5 YearsCommercial property debt $ 5,216 $ 1,281 $ 1,026 $ 2,909Residential development debt 158 155 3 —Capital securities (1) 929 — 172 757Interest expense (2)Commercial property debt 2,463 848 445 1,170Capital securities (1) 415 193 96 126(1)Excludes Class AAA Series E, as these are retractable at the holder’s option or redeemable at our option at any time(2)Represents aggregate interest expense expected to be paid over the term of the debt, on an undiscounted basis, based on current interest andforeign exchange ratesAdditionally, we have properties situated on land held under leases or other agreements largely expiring on or before the year 2069.Minimum rental payments on land leases are approximately $22 million annually for the next five years and $959 million in total on anundiscounted basis.Credit RatingsWe are currently rated by two credit rating agencies, Dominion Bond Rating Service (“DBRS”) and Standard and Poors (“S&P”). We arecommitted to arranging our affairs to maintain these ratings and improve them further over time.The credit ratings for the company at December 31, <strong>2005</strong> and at the date of this report were as follows:DBRSS&PCorporate rating BBB(high) BBBPreferred shares Pfd-3(high) P3(high)Credit ratings are intended to provide investors with an independent measure of the credit quality of an issue of securities. The creditratings presented are not recommendations to purchase, hold or sell the company’s common or preferred shares, as such ratings do notcomment as to market price or suitability for a particular investor. There is no assurance that any rating will remain in effect for anygiven period of time or that any rating will not be revised or withdrawn entirely by a rating agency in the future if, in its judgment,circumstances so warrant.Corporate Guarantees and Contingent ObligationsWe conduct our operations through entities that are fully or proportionately consolidated in the financial statements except for ourinvestment in <strong>Brookfield</strong> LePage Johnson Controls and a 25% investment in a residential development project in Toronto, which areboth equity accounted.We may be contingently liable with respect to litigation and claims that arise in the normal course of business. In addition, we mayexecute agreements that provide for indemnifications and guarantees to third parties. Disclosure of commitments, guarantees andcontingencies can be found in Note 22 to the consolidated financial statements.ACCOUNTS PAYABLE AND OTHER LIABILITIESAccounts payable and other liabilities totaled $626 million in <strong>2005</strong>, compared with $452 million in 2004. The increase is primarily due tothe adoption of CICA issued EIC 140 “Accounting for Operating Leases Acquired in either an Asset Acquisition or a BusinessCombination” in which the Emerging Issues Committee of the CICA concluded that an enterprise that acquires real estate shouldallocate a portion of the purchase price to in-place operating leases, based on their fair value, that the enterprise acquires in connectionwith the real estate property. Accordingly, we allocated $126 million (2004 - $28 million) to below-market tenant leases and unfavorableground leases assumed. The balance of the change is due to additional accrued interest as a result of higher debt balances and anincrease in operating payables relating to the expansion of our land and housing operations. Total debt attributable to land developmentat December 31, <strong>2005</strong> was $158 million, compared with $135 million in 2004. This financing is primarily recourse in nature to our landdevelopment subsidiaries and relates to construction and development loans, which are repaid from the sales proceeds of building lotsand homes, and other short-term advances. As new homes are constructed, loans are funded on a rolling basis. This financing had aweighted average interest rate of 5.0% at December 31, <strong>2005</strong> (2004 - 4.2%).29
A summary of the components of accounts payable and other liabilities is as follows:(Millions) <strong>2005</strong> 2004Accounts payable $ 342 $ 289Residential development debt 158 135ntangible liabilities 126 28Total $ 626 $ 452FUTURE INCOME TAXESAt December 31, <strong>2005</strong>, we had a future income tax liability of $188 million compared to $96 million at December 31, 2004, an increaseof $92 million, primarily reflecting the acquisition of the O&Y portfolio and the utilization of tax losses during <strong>2005</strong>.(Millions) <strong>2005</strong> 2004Future income tax liabilities related to difference in tax and book basis, net $ 541 $ 568Future income tax assets related to non-capital losses and capital losses (353) (472)Total $ 188 $ 96CAPITAL SECURITIESEffective January 1, <strong>2005</strong>, we adopted an amendment to CICA Handbook section 3861, “Financial Instruments – Disclosure andPresentation,” retroactively with restatement of prior periods. This amendment requires financial instruments that may be settled, at ouroption, in cash or the equivalent value of a variable number of the company’s equity instruments to be presented as a liability. As aresult, certain of our Class AAA preferred shares previously included in shareholders’ equity were reclassified to liabilities under thecaption “capital securities.” See Note 2 to the consolidated financial statements for further discussion.We have the following capital securities outstanding:(Millions, except share information)SharesOutstandingCumulativeDividend Rate <strong>2005</strong> 2004Class AAA Series E 8,000,000 70% of bank prime $ 172 $ 167Class AAA Series F 8,000,000 6.00% 172 167Class AAA Series G 4,400,000 5.25% 110 110Class AAA Series H 8,000,000 5.75% 173 167Class AAA Series I 8,000,000 5.20% 172 167Class AAA Series J 8,000,000 5.00% 172 167Class AAA Series K 6,000,000 5.20% 130 124Total $ 1,101 $ 1,069For redemption dates, refer to Note 14 of the consolidated financial statementsNON-CONTROLLING INTERESTSIn addition to our 100% owned subsidiaries, we conduct our commercial property operations through BPO <strong>Properties</strong> Ltd. (“BPO<strong>Properties</strong>”) in Canada, which holds substantially all of our Canadian assets other than BCE Place in Toronto and through <strong>Brookfield</strong>Financial <strong>Properties</strong>, L.P. (“<strong>Brookfield</strong> Financial <strong>Properties</strong>”) in the U.S., which holds substantially all of our interests in our New York,Boston and Washington, D.C. assets.The following table details the components of non-controlling interests:(Millions) Others’ Equity Ownership <strong>2005</strong> 2004Common shares of BPO <strong>Properties</strong> 11.0% $ 47 $ 42Limited partnership units of <strong>Brookfield</strong> Financial <strong>Properties</strong> 0.6% 12 11Total $ 59 $ 53Non-controlling interests in BPO <strong>Properties</strong> increased to $47 million at December 31, <strong>2005</strong> from $42 million at December 31, 2004primarily due to earnings in <strong>2005</strong> in excess of distributions.30
PREFERRED EQUITY – SUBSIDIARIESIn addition to the preferred equity classified as capital securities, we had $329 million of preferred equity outstanding at December 31,<strong>2005</strong> issued by BPO <strong>Properties</strong>. These preferred shares represent low-cost capital to <strong>Brookfield</strong> <strong>Properties</strong>, without dilution to thecommon equity base. Dividends paid on these preferred shares are a component of non-controlling interests expense.The following table details the preferred shares issued by our subsidiaries:SharesOutstandingPreferredShares SeriesCumulativeDividend Rate <strong>2005</strong> 2004(Millions, except share information)BPO <strong>Properties</strong>1,805,489 Series G 70% of bank prime $ 39 $ 383,816,527 Series J 70% of bank prime 82 80300 Series K 30-day BA + 0.4% 129 1242,847,711 Series M 70% of bank prime 62 59800,000 Series N 30-day BA + 0.4% 17 17$ 329 $ 318100%-owned subsidiaries — 2Total $ 329 $ 320During <strong>2005</strong>, dividends of $10 million were paid on preferred shares issued by our subsidiaries, compared with $12 million in 2004. Thedecrease is related to the redemption of $120 million of preferred shares issued by one of our 100%-owned subsidiaries in 2004 and afurther $2 million in <strong>2005</strong>.PREFERRED EQUITY – CORPORATEAt December 31, <strong>2005</strong> we had $45 million of preferred equity outstanding. Similar to the preferred shares issued by subsidiaries, thesepreferred shares represent low-cost capital to us, without dilution to our common equity base. Dividends paid on these preferred sharesare accounted for as capital distributions.We have the following preferred shares outstanding:(Millions, except share information)SharesOutstandingCumulativeDividend Rate <strong>2005</strong> 2004Class A redeemable voting 6,312,000 7.50% $ 11 $ 11Class AA Series E 2,000,000 70% of bank prime 34 34Total $ 45 $ 45For detailed terms on our preferred shares, refer to our <strong>Annual</strong> Information Form.During <strong>2005</strong>, we paid preferred dividends of $2 million, consistent with 2004.COMMON EQUITYOn February 9, <strong>2005</strong>, our Board of Directors approved a three-for-two stock split in the form of a stock dividend. Shareholders receivedone <strong>Brookfield</strong> <strong>Properties</strong> common share for each two common shares held. The stock dividend was paid on March 31, <strong>2005</strong> toshareholders of record at the close of business on March 15, <strong>2005</strong>.As at December 31, <strong>2005</strong>, we had 231,209,625 issued and outstanding common shares. On a diluted basis, we had 235,851,586common shares outstanding, calculated as follows:<strong>2005</strong> 2004 (1)Common shares outstanding 231,209,625 233,387,780Unexercised options 4,641,961 4,692,869Common shares outstanding – diluted (2) 235,851,586 238,080,649Common shares repurchased 2,693,500 2,114,850(1)Adjusted for the three-for-two common stock-split on March 31, <strong>2005</strong>(2)Includes all potential common shares at December 31, <strong>2005</strong>The diluted book value per common share at December 31, <strong>2005</strong> was $8.35 compared with $8.41 at December 31, 2004. During the yearended December 31, <strong>2005</strong>, we repurchased 2.7 million common shares under our normal course issuer bid at an average price of $27.5031
per share. Since the inception of the normal course issuer bid in 1999, we have repurchased approximately 21 million shares at anaverage price of $14.97 per share on a post-split adjusted basis.At December 31, <strong>2005</strong>, the book value of our common equity was $1.9 billion, compared with a market equity capitalization ofapproximately $6.8 billion, calculated as total common shares outstanding multiplied by $29.42, the closing price per common share onthe New York Stock Exchange on December 30, <strong>2005</strong>.CAPITAL RESOURCES AND LIQUIDITYWe employ a broad range of financing strategies to facilitate growth and manage financial risk, with particular emphasis on the overallreduction of the weighted average cost of capital, in order to enhance returns for common shareholders.Contractual rent is the primary driver of cashflow from operating activities, which represents the primary source of liquidity to fund debtservice, dividend payments and recurring capital and leasing costs in our commercial property portfolio. Sufficient cashflows aregenerated by our properties to service these obligations. We seek to increase income from our existing properties by maintaining qualitystandards which promote high occupancy rates and permit increases in rental rates while reducing tenant turnover and controllingoperating expenses. Other sources of revenue include third-party fees generated by our real estate management, leasing anddevelopment businesses. In addition, our tax status as a corporation and substantial tax loss pools allow us to reinvest and retain cashgenerated by our operations without incurring cash taxes.Our commercial property debt is primarily fixed-rate and non-recourse. These investment-grade financings are typically structured up to70% loan-to-appraised value basis. In addition, in certain circumstances when a building is leased almost exclusively to a high-creditquality tenant, a higher loan-to-value financing, based on the tenant’s credit quality, is put in place at rates commensurate with the costof funds for the tenant. This reduces our equity requirements to finance commercial property, and enhances equity returns.COST OF CAPITALWe continually strive to reduce our weighted average cost of capital and improve common shareholders’ equity returns through valueenhancementinitiatives and the consistent monitoring of the balance between debt and equity financing.As at December 31, <strong>2005</strong>, our weighted average cost of capital, assuming a 12% return on equity, was 8.1% (2004 – 8.0%). Our cost ofcapital is lower than many of our peers because of the greater amount of investment-grade financing which can be placed on our assets,a function of the high-quality nature of both the assets and the tenant base which comprise our portfolio. The increase over the prioryear is due to a general increase in interest rates resulting in a higher cost of floating rate debt.The following schedule details the capitalization of the company at the end of <strong>2005</strong> and 2004 and the related costs thereof:Cost of Capital (1) Underlying Value (2)(Millions) <strong>2005</strong> 2004 <strong>2005</strong> 2004LiabilitiesCommercial property debt 6.5% 6.5% $ 5,267 $ 4,818Residential debt 3.2% 2.7% 158 135Capital securities 5.1% 5.0% 1,101 1,069Non-controlling interests 12.0% 12.0% 59 53Preferred equity - subsidiaries 3.6% 3.0% 329 320Shareholders’ equityPreferred equity - corporate 4.5% 4.5% 45 45Common equity 12.0% 12.0% 6,802 5,818Total (3) 8.1% 8.0% $ 13,761 $ 12,258(1)As a percentage of average book value(2)Underlying value of liabilities represents the cost to retire on maturity. Underlying value of common equity is based on the closing stock price of<strong>Brookfield</strong> <strong>Properties</strong>’ common shares(3)In calculating the weighted average cost of capital, the cost of debt has been tax-effected32
OPERATING RESULTSNET INCOMEOur net income for the year ended December 31, <strong>2005</strong> was $164 million ($0.69 per diluted share) compared to $138 million ($0.58 perdiluted share) in 2004. The net increase is largely a result of:• $64 million of growth ($0.18 per diluted share) from our residential development operations which continues to benefit fromthe low interest rate environment and strong demand in the North American housing market;• the retroactive adoption of CICA Handbook section 3861, “Financial Instruments – Disclosure and Presentation,” resulted inthe recognition of a $63 million ($0.18 per diluted share) unrealized foreign exchange loss in 2004 (refer to Note 2 of theconsolidated financial statements);• a $30 million fee received from Goldman Sachs in <strong>2005</strong> pursuant to a cooperation agreement permitting the commencementof construction on Site 26 in New York, as compared to $60 million in lease termination income realized in the second quarterof 2004 ($0.09 per diluted share) and a leasing fee of $16 million ($0.04 per diluted share) realized upon the successfulcompletion of a sublease at 300 Madison Avenue in the first quarter of 2004; and• an increase in interest expense of $26 million ($0.07 per diluted share) related to additional corporate borrowings, a full year ofinterest carry and amortization on the Washington, D.C. properties acquired in 2004, interest and amortization related to theO&Y acquisition, and the cessation of interest capitalization on Three World Financial Center in the first quarter of <strong>2005</strong>.Set out below is a summary of the various components of our net income and funds from operations. Discussion of each of thesecomponents is provided on the following pages.(Millions) <strong>2005</strong> 2004 2003Total revenue and gains $ 1,549 $ 1,442 $ 1,363Net operating incomeCommercial property operationsOperating income from commercial properties $ 680 $ 671 $ 586Operating income from properties sold (1) 11 12 11Lease termination income and gains — 60 100Total commercial property operations 691 743 697Residential development operations 106 42 31Interest and other income 37 47 62834 832 790ExpensesInterest 330 304 279Interest related to discontinued operations (1) 5 5 4General and administrative 48 41 44Non-controlling interests expense 16 20 21Funds from operations and gains 435 462 442Depreciation and amortization 163 140 76Depreciation and amortization related to discontinued operations (1) 5 5 3Unrealized foreign exchange on preferred share restatement — 63 29Future income taxes and other provisions 103 116 102Net income $ 164 $ 138 $ 232Net income per share – dilutedPrior to discontinued operations and lease termination income and gains $ 0.69 $ 0.42 $ 0.65Discontinued operations — 0.01 0.02Lease termination income and gains — 0.15 0.29$ 0.69 $ 0.58 $ 0.96Funds from operations per share - dilutedPrior to discontinued operations and lease termination income and gains $ 1.82 $ 1.67 $ 1.40Discontinued operations 0.03 0.03 0.03Lease termination income and gains — 0.25 0.42$ 1.85 $ 1.95 $ 1.85(1)Refer to page 40 for further details on discontinued operations33
It should be noted that challenges of comparability of net income exist among various real estate companies, as those entities structuredas corporations, such as <strong>Brookfield</strong> <strong>Properties</strong>, are required to charge their earnings with tax expense, despite the presence of tax losseswhich reduce the cash tax obligation. This differs from those entities which operate as real estate investment trusts (“REITs”), as REITsare not subject to taxation, provided they remain in compliance with specific tax codes.Our net income per share and weighted average common shares outstanding are calculated as follows:(Millions, except per share amounts) <strong>2005</strong> 2004 2003Net income $ 164 $ 138 $ 232Preferred share dividends (2) (2) (2)Net income available to common shareholders $ 162 $ 136 $ 230Weighted average shares outstanding – basic 232.1 234.0 236.1Net income per share – basic $ 0.70 $ 0.58 $ 0.96Weighted average shares outstanding – diluted 234.2 235.7 237.9Net income per share – diluted $ 0.69 $ 0.58 $ 0.96Weighted average shares outstanding – basic 232.1 234.0 236.1Unexercised options 2.1 1.7 1.8Weighted average shares outstanding – diluted 234.2 235.7 237.9RECONCILIATION OF NET INCOME TO FUNDS FROM OPERATIONS(Millions) <strong>2005</strong> 2004 2003Net income $ 164 $ 138 $ 232Add:Depreciation and amortization (1) 168 145 79Unrealized foreign exchange on preferred share restatement — 63 29Future income taxes and other provisions 103 116 102Funds from operations and gains $ 435 $ 462 $ 442Less:Lease termination income and gains (2) — (59) (99)Funds from operations $ 435 $ 403 $ 343(1)Includes depreciation and amortization from the consolidated income statements of $163 million, $140 million and $76 million anddepreciation and amortization from discontinued operations of $5 million, $5 million and $3 million for the years ended December 31, <strong>2005</strong>,2004 and 2003, respectively(2)Net of non-controlling interests expenseAfter providing for preferred share dividends, our funds from operations per diluted share, excluding lease termination income andgains, is calculated as follows:(Millions, except per share amounts) <strong>2005</strong> 2004 2003Funds from continuing operations $ 435 $ 403 $ 343Preferred share dividends (2) (2) (2)$ 433 $ 401 $ 341Weighted average shares outstanding 234.2 235.7 237.9Funds from operations per share $ 1.85 $ 1.70 $ 1.43Excluding lease termination income and gains, funds from operations increased 9% to $1.85 per share during year <strong>2005</strong> compared with$1.70 per share in 2004.Our <strong>2005</strong> results include a special fee of $30 million ($0.13 per share) received from Goldman Sachs pursuant to a cooperationagreement permitting the commencement of construction on certain lands adjacent to the company’s World Financial Center in NewYork, known as Site 26. The 2004 results included lease termination income of $60 million ($0.25 per share) in conjunction with the34
termination of a previously existing lease and the commencement of a new lease at One World Financial Center in New York. The 2003gains related to the sale of a 49% interest in 245 Park Avenue in New York totaling $100 million ($0.42 per share).The components of revenue and gains are as follows:(Millions) <strong>2005</strong> 2004 2003Commercial property operationsRevenue from current properties, including fee income $ 1,051 $ 1,006 $ 921Recurring fee income 22 20 20Non-recurring fee and other income 30 27 15Revenue from discontinued operations 20 21 20Lease termination income and gains — 60 100Total commercial property revenue 1,123 1,134 1,076Revenue from residential development operations 389 261 225Revenue from commercial property and residential development operations 1,512 1,395 1,301Interest and other 37 47 62Total $ 1,549 $ 1,442 $ 1,363COMMERCIAL PROPERTY OPERATIONSCommercial property net operating income contributed $650 million in <strong>2005</strong> compared with $644 million in 2004 and $571 million in2003. Including non-recurring fees, lease termination income and gains, net operating income was $680 million in <strong>2005</strong> compared with$731 million in 2004 and $686 million in 2003.The components of commercial property net operating income are as follows:(Millions) <strong>2005</strong> 2004 2003Rental revenue $ 1,051 $ 1,006 $ 921Recurring fee income 22 20 20Property operating costs (423) (382) (370)Net operating income 650 644 571Non-recurring fee and other income 30 27 15Lease termination income and gains — 60 100Net operating income including lease termination income and gains $ 680 $ 731 $ 686The growth in net operating income in each of the past two years is as follows:(Millions) <strong>2005</strong> 2004Net operating income, prior year (1) $ 644 $ 571(a) Contractual rent increases and straight-line rental income, net (3) 27(b) Leasing activity (1) 4(c) Acquisitions, net of dispositions 8 42(d) Recurring fee income 2 —Net operating income, end of year $ 650 $ 644(e) Non-recurring fee and other income 30 27(f) Lease termination income — 60Net operating income including lease termination income, end of year $ 680 $ 731(1)Prior year net operating income has been restated for discontinued operations(a) Contractual rent increases and straight-line rental income, netOur leases generally have clauses which provide for the collection of rental revenues in amounts that increase every five years, with theseincreases negotiated at the signing of the lease. The large number of high-credit quality tenants in our portfolio lowers the risk of notrealizing these increases. During the year ended December 31, <strong>2005</strong>, net operating income was negatively impacted by $3 million due tocontractual rent increases, offset by a decrease in straight-line rental income. During the year ended December 31, 2004, contractualrent increases and straight-line rental income contributed $27 million to net operating income, including the adoption of CICAHandbook Section 1100, “Generally Accepted Accounting Principles” in 2004 which resulted in an additional $22 million of straight-linerental income in 2004.35
(b) Leasing activityAlthough occupancy increased, net operating income was negatively impacted in <strong>2005</strong>, largely due to increased vacancies of higher rentspace at 53 State Street in Boston and One World Financial Center in New York. At December 31, <strong>2005</strong>, average in-place net rentsthroughout the portfolio remained flat at $23 per square foot as compared to December 31, 2004.The following table shows the average in-place rents and estimated current market rents for similar space in each of our markets as atDecember 31, <strong>2005</strong>:GrossLeasable AreaAvg.Lease TermAvg. In-placeNet RentAvg. MarketNet Rent(000’s Sq. Ft.) (Years) ($ per Sq. Ft.) ($ per Sq. Ft.)New York, New YorkMidtown 2,786 19 $ 39 $ 55Lower Manhattan 9,667 9 31 25Boston, Massachusetts 2,163 6 29 30Washington, D.C. 1,557 15 30 38Toronto, Ontario 12,278 7 22 22Calgary, Alberta 8,936 8 16 24Ottawa, Ontario 2,935 5 10 14Denver, Colorado 2,605 4 14 15Minneapolis, Minnesota 3,008 8 8 13Other 2,095 11 9 14Total (1) 48,030 10 $ 23 $ 25(1)Excludes developmentsOur occupancy rate in our primary markets of New York, Boston, Washington, D.C., Toronto, Calgary and Ottawa increased by 160 basispoints to 95.6% at December 31, <strong>2005</strong> compared with 94.0% at December 31, 2004 with the acquisition of the O&Y portfolio and thecontinuing lease-up of Three World Financial Center in New York and 1625 Eye Street in Washington, D.C. Our occupancy rate inDenver, Minneapolis and other secondary markets increased by 250 basis points to 88.7% at December 31, <strong>2005</strong>, compared with 86.2%at December 31, 2004 with the continuing lease-up of 33 South Sixth Street where the retail redevelopment project at Minneapolis CityCenter is nearing completion.A summary of current and historical occupancy levels for the past two years is as follows:Dec. 31, <strong>2005</strong> Dec. 31, 2004Total% SquareLeased FeetTotalSquareFeet%Leased(Thousands of square feet)New York, New York 12,453 94.9 12,453 92.1Boston, Massachusetts 2,163 92.1 2,163 96.8Washington, D.C. 1,557 98.5 1,557 93.2Toronto, Ontario 12,278 93.4 7,882 93.3Calgary, Alberta 8,936 99.1 6,331 98.4Ottawa, Ontario 2,935 99.7 — —Denver, Colorado 2,605 86.9 3,017 85.4Minneapolis, Minnesota 3,008 87.9 3,008 85.8Other 2,095 92.3 926 90.5Total (1) 48,030 94.6 37,337 92.7New York/Boston/Washington/Toronto/Calgary/Ottawa 40,322 95.6 30,386 94.0Denver/Minneapolis/Other 7,708 88.7 6,951 86.2Total (1) 48,030 94.6 37,337 92.7(1)Excludes developments36
During <strong>2005</strong>, we leased 3.8 million square feet of space, approximately three times the amount of space contractually expiring. Thisincluded 2.2 million square feet of new leases and 1.6 million square feet of renewals.The details of our leasing activity for <strong>2005</strong> are as follows:December 31, 2004 <strong>2005</strong> Activities December 31, <strong>2005</strong>(Thousands of sq. ft.) GLA (1) Leased ExpiriesAcceleratedExpiriesExpiringNet RentLeasingLeasingNet RentAcq.(Disp.) GLA (1) LeasedNew York, New YorkMidtown 2,786 2,749 — (75) 102 1 2,786 2,777Lower Manhattan 9,667 8,744 (277) (107) 698 (1) 9,667 9,057Boston, Massachusetts 2,163 2,103 (158) (342) 411 (1) 2,163 2,013Washington, D.C. 1,557 1,490 (6) (36) 94 — 1,557 1,542Toronto, Ontario 7,882 7,449 (413) (667) 1,027 4,195 12,278 11,591Calgary, Alberta 6,331 6,247 (40) (480) 600 2,538 8,936 8,865Ottawa, Ontario — — — — — 2,930 2,935 2,930Denver, Colorado 3,017 2,657 (242) (238) 430 (273) 2,605 2,334Minneapolis, Minnesota 3,008 2,655 (47) (243) 344 (1) 3,008 2,708Other 926 863 (4) (82) 107 1,087 2,095 1,971Total 37,337 34,957 (1,187) (2,270) $ 20 3,813 $ 19 10,475 48,030 45,788(1)Excludes developments(c) Acquisitions, net of dispositionsThe value created in our mature commercial properties provides us with the opportunity to generate additional gains and capitalavailable to reinvest in other assets at higher returns. The acquisition of the Washington, D.C. properties and the O&Y portfoliocontributed an additional $8 million of net operating income in <strong>2005</strong>. In 2004, the acquisition of properties in Washington, D.C. and thecompletion of the development project at 300 Madison in New York contributed an additional $42 million of net operating income.(d) Recurring fee incomeFee income includes property management fees, leasing fees and project management fees relating to certain co-owned properties. Feeincome serves as a cashflow supplement to enhance returns from co-owned assets. We also earn fees through <strong>Brookfield</strong> ResidentialServices Ltd. and <strong>Brookfield</strong> LePage Johnson Controls. <strong>Brookfield</strong> Residential Services Ltd. has been managing condominiums in theGreater Metropolitan Toronto area for the past 25 years and manages in excess of 35,000 units in over 200 condominium corporations.<strong>Brookfield</strong> <strong>Properties</strong> LePage Facilities Management, one of the largest facilities management operations in Canada, is owned 40% by<strong>Brookfield</strong> <strong>Properties</strong> in partnership with Johnson Controls. This joint venture, which is equity accounted, manages close to 100 millionsquare feet of premises for major corporations and government, and continues to benefit from the trend towards outsourcing offacilities management worldwide.The details of our fee income are as follows:(Millions) <strong>2005</strong> 2004 2003Property management, leasing and project management fees $ 7 $ 6 $ 6<strong>Brookfield</strong> Residential fees 9 8 8<strong>Brookfield</strong> LePage Johnson Controls 6 6 6Total $ 22 $ 20 $ 20The generation of fee income is not viewed as a separate segmented business activity; however, with the establishment of our officefunds, the associated fees represent an important area of growth for us and are expected to increase as we expand our assets undermanagement. These fees typically include a stable base fee for providing regular ongoing services as well as performance fees that areearned when the performance of the fund exceeds certain predetermined benchmarks. We will also earn transaction fees for investmentand leasing activities conducted on behalf of these funds.(e) Non-recurring fee and other incomeDuring <strong>2005</strong>, we received a $30 million fee from Goldman Sachs in accordance with a cooperation agreement signed in December <strong>2005</strong>.The agreement related to certain rights <strong>Brookfield</strong> <strong>Properties</strong> has at Site 26 in Battery Park City where Goldman Sachs has commenced37
construction of its 2.1 million square foot headquarters building which is expected to be fully occupied in 2009. During 2004, we realizedleasing fees upon the successful completion of a sublease at 300 Madison Avenue as well as miscellaneous fees totaling $27 million.(f) Lease termination income and gainsDuring the first quarter of 2004, we entered into a twenty-year lease with Cadwalader, Wickersham & Taft for approximately 460,000square feet in One World Financial Center in New York. The transaction resulted in termination income of $60 million in the secondquarter of 2004 upon termination of the existing lease. While these events are opportunistic and difficult to predict, the dynamic tenantbase which is typical of our buildings should provide us with similar opportunities in the future.Commercial Property Operating CostsCommercial property operating costs which include real estate taxes, utilities, insurance, repairs and maintenance, cleaning and otherproperty-related expenses increased to $423 million from $382 million in 2004. The primary reason for the increase was the expansionof our portfolio with Three World Financial Center being transferred out of development properties and into commercial properties,accounting for approximately $18 million of the increase, and the acquisitions of the Washington D.C. properties in 2004 and the O&Yproperties in the fourth quarter of <strong>2005</strong>, accounting for approximately $10 million of the increase. The balance of the change is a resultof inflationary pressures. As a result of world events over the past few years, premiums for insurance have increased substantially for allproperty owners and utility costs have generally increased by 10% due to the increased hydro and electricity costs. Substantially all ofour leases are net leases in which the lessee is required to pay all their proportionate share of property operating expenses such asutilities, repairs, insurance and taxes.RESIDENTIAL DEVELOPMENT OPERATIONSOur residential development operations are located in four markets: Alberta, Ontario, Colorado and Texas. Most of our land holdingswere purchased in the mid-1990’s, and as a result have an embedded cost advantage over many companies which are acquiring landtoday at much higher prices. In addition, our residential development operations continue to benefit from the low interest rateenvironment and strong demand in the North American housing market.Our residential development operations contributed $106 million of income in <strong>2005</strong>, an increase of $64 million over 2004 and $75million over 2003. These increases are due to a combination of volume and operating margins. The increase in volume reflects thecontinued strength in the Alberta housing market where oil and gas prices remain high and the unemployment rate remains low, whilethe increases in operating margins are attributable to the low cost basis of our land inventory.The components of residential development net operating income are as follows:(Millions) <strong>2005</strong> 2004 2003Sales revenue $ 389 $ 261 $ 225Operating costs 283 219 194Total $ 106 $ 42 $ 31Lot sales for the past three years and the related revenue received are as follows:Lot sales(Units)Lot Sales Revenue(Millions)Average Lot Sales Revenue(Thousands)<strong>2005</strong> 2004 2003 <strong>2005</strong> 2004 2003 <strong>2005</strong> 2004 2003Alberta 2,617 2,078 1,768 $ 182 $ 107 $ 83 $ 70 $ 51 $ 47Colorado 369 468 448 24 19 24 65 41 54Total 2,986 2,546 2,216 $ 206 $ 126 $ 107 $ 69 $ 49 $ 48Home sales for the past three years and the related revenue received are as follows:Home sales(Units)Home Sales Revenue(Millions)Average Home Sales Revenue(Thousands)<strong>2005</strong> 2004 2003 <strong>2005</strong> 2004 2003 <strong>2005</strong> 2004 2003Alberta 556 496 479 $ 86 $ 61 $ 55 $ 155 $ 123 $ 115Ontario 391 339 318 97 74 63 248 218 198Total 947 835 797 $ 183 $ 135 $ 118 $ 193 $ 162 $ 14838
Residential development operating costs, which include land costs, land servicing costs, housing development costs, property taxes andother related costs increased to $283 million from $219 million in 2004. This increase is a result of our expanded operations leading toan increase in sales along with inflationary pressures.INTEREST AND OTHER INCOMEInterest and other income includes interest charged on loans receivable, interest received on cash balances and transactional gains andlosses realized on the disposal of non-core assets. Interest and other income decreased to $37 million in <strong>2005</strong> compared with $47million in 2004, primarily due to lower interest income earned on cash deposits and marketable securities which were sold to purchasethe O&Y portfolio.INTEREST EXPENSEInterest expense, including preferred share dividends reclassified to interest expense as discussed in Note 2 of the consolidated financialstatements, increased 9% to $330 million in <strong>2005</strong>, compared with $304 million in 2004. This increase relates to additional interest carryon our corporate borrowings, the O&Y portfolio and Washington, D.C. acquisitions and the cessation of interest capitalization on ThreeWorld Financial Center, as well as dividends, recorded as interest, paid on the Class AAA Series J preferred shares which were issuedduring the second quarter of 2004 and the Class AAA Series K preferred shares, which were issued during the fourth quarter of 2004.GENERAL AND ADMINISTRATIVE EXPENSESGeneral and administrative costs during the year ended <strong>2005</strong> increased to $48 million from $41 million in 2004 due to the acquisition ofthe O&Y portfolio in the fourth quarter of <strong>2005</strong>, and inflationary and competitive pressures on salaries. Included in general andadministrative expenses is $8 million (2004 - $8 million) of expenses related to the operations of our subsidiary, <strong>Brookfield</strong> ResidentialServices Ltd. With the O&Y acquisition and the planned launch of a U.S. office fund, we expect these expenses to increase further due toincreased property management and leasing staff requirements resulting from significant portfolio growth and commensurate staffingrequirements in accounting, information systems, human resources, acquisitions and business analysis, as well as overall compensationincreases.NON-CONTROLLING INTERESTS EXPENSENon-controlling interests expense consists of earnings attributable to interests not owned by <strong>Brookfield</strong> <strong>Properties</strong> in BPO <strong>Properties</strong>and <strong>Brookfield</strong> Financial <strong>Properties</strong>, as well as dividends on shares issued by BPO <strong>Properties</strong> and our 100%-owned subsidiaries.For the year ended December 31, <strong>2005</strong>, dividends paid on shares issued by our subsidiaries decreased to $11 million from $48 million in2004. The 2004 results included the impact of the redemption of $120 million of preferred shares issued by our subsidiaries in October2004 as well as the payment of a special dividend in March 2004.Non-controlling interests expense in subsidiary earnings was $5 million in <strong>2005</strong> compared with $(28) million in 2004. The 2004 resultsincluded the lease termination income earned in the third quarter of 2004 and the payment of a special dividend by BPO <strong>Properties</strong> inMarch 2004.The following table outlines the dividends and earnings paid or attributable to other shareholders of subsidiaries of <strong>Brookfield</strong><strong>Properties</strong>:(Millions) Type <strong>2005</strong> 2004 2003BPO <strong>Properties</strong> Redeemable preferred shares (1) $ 10 $ 8 $ 9BPO <strong>Properties</strong> Common shares 1 37 1100%-owned subsidiaries Redeemable preferred shares (1) — 3 4Dividends – shares of subsidiaries $ 11 $ 48 $ 14BPO <strong>Properties</strong> Participating interests $ 4 $ (30) $ 5<strong>Brookfield</strong> Financial <strong>Properties</strong> Participating interests 1 2 2Non-controlling interests expense in subsidiaryearnings $ 5 $ (28) $ 7Total $ 16 $ 20 $ 21(1)Non-participatingDEPRECIATION AND AMORTIZATION EXPENSEDepreciation for the year ended December 31, <strong>2005</strong> increased by $23 million to $163 million from $140 million in 2004. The majority ofthis increase was due to the addition of the O&Y portfolio in the fourth quarter of <strong>2005</strong> and the Washington, D.C. properties in the thirdquarter of 2004, as well as the reclassification of Three World Financial Center and Hudson’s Bay Centre from development properties.39
DISCONTINUED OPERATIONSDuring the fourth quarter of <strong>2005</strong>, we reached an agreement to sell our 100% interest in the World Trade Center Denver. Incomeattributable to discontinued operations was $1 million and $2 million for the years ended December 31, <strong>2005</strong> and 2004, respectively.The 2004 results also include the sale of Colorado State Bank Building, which was sold in the fourth quarter of <strong>2005</strong>. The following tablesummarizes the income from discontinued operations:(Millions) <strong>2005</strong> 2004 2003Revenue from properties sold $ 20 $ 21 $ 20Operating expenses 9 9 9$ 11 $ 12 $ 11Interest expense (5) (5) (4)Funds from operations – discontinued operations $ 6 $ 7 $ 7Depreciation and amortization (5) (5) (3)Income from discontinued operations $ 1 $ 2 $ 4SEGMENTED INFORMATIONThe company and its subsidiaries operate in the U.S. and Canada within the commercial property and the residential developmentbusinesses. The commercial markets in which we operate are primarily New York, Boston, Washington, D.C., Denver and Minneapolisin the U.S., and Toronto, Calgary and Ottawa in Canada. Approximately 73% of our commercial property net operating income or 71%of our commercial property funds from operations are derived from the U.S. Our residential development operations are focused in fourmarkets: Alberta and Ontario in Canada and Colorado and Texas in the U.S. Details of the segmented financial information for ourprincipal areas of business are as follows:CommercialUnited StatesCanadaResidentialDevelopment(Millions) <strong>2005</strong> 2004 <strong>2005</strong> 2004 <strong>2005</strong> 2004 <strong>2005</strong> 2004Assets<strong>Properties</strong> $ 5,318 $ 5,224 $ 2,336 $ 1,730 $ 391 $ 317 $ 8,045 $ 7,271Receivables and other 407 339 375 316 173 84 955 739Restricted cash and deposits 314 297 2 ⎯ ⎯ ⎯ 316 297Marketable securities ⎯ 285 58 ⎯ ⎯ ⎯ 58 285Cash and cash equivalents 33 49 25 59 6 4 64 112Assets related to discontinued operations 75 96 ⎯ ⎯ ⎯ ⎯ 75 96Total $ 6,147 $ 6,290 $ 2,796 $ 2,105 $ 570 $ 405 $ 9,513 $ 8,800TotalCommercialUnited StatesCanadaResidentialDevelopment(Millions) <strong>2005</strong> 2004 <strong>2005</strong> 2004 <strong>2005</strong> 2004 <strong>2005</strong> 2004Revenue $ 787 $ 752 $ 316 $ 301 $ 389 $ 261 $ 1,492 $ 1,314Lease termination income ⎯ 60 ⎯ ⎯ ⎯ ⎯ ⎯ 60Expenses 292 253 131 129 283 219 706 601495 559 185 172 106 42 786 773Other revenues 6 14 27 33 4 ⎯ 37 47Net operating income from continuingoperations 501 573 212 205 110 42 823 820Interest expense 231 243 99 61 ⎯ ⎯ 330 304General and administrative 26 20 22 21 ⎯ ⎯ 48 41Non-controlling interests expense ⎯ 4 16 16 ⎯ ⎯ 16 20Income before undernoted 244 306 75 107 110 42 429 455Depreciation and amortization 126 98 37 42 ⎯ ⎯ 163 140Income before unallocated costs 118 208 38 65 110 42 266 315Unrealized foreign exchange on preferredshare restatement ⎯ 63Future income taxes and other provisions 103 116Net income from continuing operations $ 163 $ 136Discontinued operations 1 2Net income $ 164 $ 138Total40
QUARTERLY RESULTSThe <strong>2005</strong> and 2004 results by quarter are as follows:<strong>2005</strong> 2004(Millions, except per share amounts) Q4 Q3 Q2 Q1 Q4 Q3 Q2 Q1Total revenue $ 474 $ 378 $ 362 $ 335 $ 390 $ 345 $ 381 $ 326Net operating incomeCommercial property operations 192 160 162 166 167 165 163 176Lease termination income ⎯ ⎯ ⎯ ⎯ ⎯ ⎯ 60 ⎯Total commercial property operations 192 160 162 166 167 165 223 176Residential development operations 45 24 24 13 13 11 10 8Interest and other 6 10 10 11 11 11 11 14243 194 196 190 191 187 244 198ExpensesInterest 86 84 81 79 79 76 76 73General and administrative 15 11 11 11 10 10 11 10Non-controlling interests expense 4 4 5 3 4 5 6 5138 95 99 97 98 96 151 110Depreciation and amortization 47 41 40 35 38 35 34 33Unrealized foreign exchange on preferred sharerestatement ⎯ ⎯ ⎯ ⎯ 41 28 (2) (4)Future income taxes and other provisions 42 22 19 20 17 22 47 30Net income from continuing operations $ 49 $ 32 $ 40 $ 42 $ 2 $ 11 $ 72 $ 51Discontinued operations (2) 1 1 1 ⎯ ⎯ 1 1Net income $ 47 $ 33 $ 41 $ 43 $ 2 $ 11 $ 73 $ 52Net income per share - basicPrior to discontinued operations and leasetermination income $ 0.21 $ 0.14 $ 0.17 $ 0.18 $ ⎯ $ 0.05 $ 0.15 $ 0.22Discontinued operations (0.01) ⎯ 0.01 ⎯ ⎯ ⎯ 0.01 ⎯Lease termination income ⎯ ⎯ ⎯ ⎯ ⎯ ⎯ 0.15 ⎯$ 0.20 $ 0.14 $ 0.18 $ 0.18 $ ⎯ $ 0.05 $ 0.31 $ 0.22Net income per share - dilutedPrior to discontinued operations and leasetermination income $ 0.21 $ 0.14 $ 0.16 $ 0.18 $ ⎯ $ 0.05 $ 0.15 $ 0.22Discontinued operations (0.01) ⎯ 0.01 ⎯ ⎯ ⎯ 0.01 ⎯Lease termination income ⎯ ⎯ ⎯ ⎯ ⎯ ⎯ 0.15 ⎯$ 0.20 $ 0.14 $ 0.17 $ 0.18 $ ⎯ $ 0.05 $ 0.31 $ 0.22Funds from operations per share – dilutedPrior to discontinued operations and leasetermination income $ 0.59 $ 0.40 $ 0.42 $ 0.41 $ 0.42 $ 0.40 $ 0.39 $ 0.46Discontinued operations ⎯ 0.01 0.01 0.01 ⎯ 0.01 0.01 0.01Lease termination income ⎯ ⎯ ⎯ ⎯ ⎯ ⎯ 0.25 ⎯$ 0.59 $ 0.41 $ 0.43 $ 0.42 $ 0.42 $ 0.41 $ 0.65 $ 0.47Notes:(1)The 2004 results have been restated to reflect the impact of the reclassification of certain preferred share dividends to interest expense andforeign exchange on the reclassification of certain preferred shares to liabilities(2)Per share amounts include the effect of the three-for-two common stock split on March 31, <strong>2005</strong>Operating income from current properties in the fourth quarter of <strong>2005</strong> increased as compared with previous quarters in <strong>2005</strong> due tothe acquisition of the O&Y portfolio and the collection of the $30 million fee in accordance with the cooperation agreement signed withGoldman Sachs in December <strong>2005</strong>.The gain realized in the second quarter of 2004 of $60 million in lease termination income is a result of the termination of a previouslyexisting lease and the commencement of a new lease at One World Financial Center in New York. The gain realized in the fourth quarterof 2003 of $100 million is related to the sale of a 49% interest in 245 Park Avenue in New York.Residential development income increased in the fourth quarter of <strong>2005</strong> compared with previous quarters in <strong>2005</strong> and 2004 due to thecontinued strength of the North American housing market. Interest and other income decreased in each quarter in <strong>2005</strong> as the 2004results included a contribution from our now-complete residential condominium project in Toronto.41
Interest expense increased in the fourth quarter of <strong>2005</strong> as a result of the addition of interest carry on the Potomac Tower debt, thecessation of interest capitalization on Three World Financial Center and the higher level of corporate borrowings. General andadministrative expenses increased in the fourth quarter of <strong>2005</strong> due to the acquisition of the O&Y portfolio. Non-controlling interestsexpense remained consistent with prior quarters. Depreciation and amortization increased due to the acquisition of the O&Y portfolio.Future income taxes and other provisions increased in the fourth quarter of <strong>2005</strong> due to the tax effect on the $30 million fee received inaccordance with the cooperation agreement signed with Goldman Sachs. Net income increased in the fourth quarter of <strong>2005</strong> comparedto the fourth quarter of 2004 principally due to the acquisition of the O&Y portfolio.42
PART III – RISKS AND UNCERTAINTIESIn evaluating <strong>Brookfield</strong> <strong>Properties</strong> and its business, the following is a brief review of the potential impact different risks anduncertainties may have on our operations.INTEREST RATE AND FINANCING RISKWe attempt to stagger the maturities of our mortgage portfolio evenly over a 10-year time horizon. We believe that this strategy willmost effectively manage interest rate risk.As outlined under “Capital Resources and Liquidity,” on page 32 of this MD&A, we have an ongoing requirement to access debt marketsto refinance maturing debt as it comes due. There is a risk that lenders will not refinance such maturing debt on terms and conditionsacceptable to us, or on any terms at all. Our strategy to stagger the maturities of our mortgage portfolio attempts to mitigate ourexposure to excessive amounts of debt maturing in any one year.We have a floating rate bank credit facility of $350 million, the terms of which extend to 2009. At December 31, <strong>2005</strong>, $274 million wasdrawn. There is a risk that bank lenders will not refinance the facility on terms and conditions acceptable to us, or on any terms at all. Asa mitigating factor, we have a one-year term extension option.The table below outlines the effect of hypothetical changes in interest rates on total interest expense relating to our floating rate bankcredit facility. The analysis does not reflect the impact a changing interest rate environment could have on our overall performance, andas a result, it does not reflect the actions management may take in such an environment.As atInterest Rate MovementApproximate Change in <strong>Annual</strong>Interest Expense (Millions)Approximate Change on InterestExpense per Share per YearDecember 31, <strong>2005</strong> + 100 bps $ 16 $ 0.07December 31, 2004 + 100 bps $ 8 $ 0.04We have identified a target level of indebtedness for the company of 55% of gross book value. It is our view that such level ofindebtedness is conservative given the lending parameters currently existing in the real estate marketplace (generally up to 75% ofcurrent market value) and based on this, we believe that all debts will be financed or refinanced as they come due in the foreseeablefuture.CREDIT RISKAs we invest in mortgages from time to time, further credit risks arise in the event that borrowers default on the repayment of theirmortgages to us. We endeavor to ensure that adequate security has been provided in support of such mortgages.Credit risk arises from the possibility that tenants may be unable to fulfill their lease commitments. We mitigate this risk by ensuringthat our tenant mix is diversified and by limiting our exposure to any one tenant. We also maintain a portfolio that is diversified byproperty type so that exposure to a business sector is lessened. Currently, no one tenant represents more than 10% of total leasable area.We attempt to mitigate our credit risk by signing long-term leases with tenants who have investment grade credit ratings. Additionaldiscussion of this strategy is included on page 18 of this MD&A.43
The following list shows the largest tenants by leasable area in our portfolio and their respective lease commitments:Year ofExpiry (1)000’sSq.Ft. (2)% ofSq. Ft. (2) Credit Rating (3)TenantLocationRatedMerrill Lynch New York/Toronto 2013 4,363 9.1% A+CIBC/CIBC World Markets New York/Toronto/Calgary 2028 2,066 4.3% A+Government of Canada Toronto/Ottawa/Edmonton 2010 2,008 4.2% AAABank of Montreal/Nesbitt Burns Toronto/Calgary 2018 1,092 2.3% AA-JPMorgan Chase New York/Denver 2018 1,029 2.1% A+RBC Financial Group Five major markets 2018 981 2.0% AA-Petro-Canada Calgary 2013 871 1.8% BBBTarget Corporation Minneapolis 2013 840 1.8% A+Imperial Oil Calgary 2011 633 1.3% AAATalisman Energy Calgary 2015 527 1.1% BBB+CP Rail Calgary 2014 452 0.9% BBBConoco Phillips Calgary 2010 445 0.9% A-American Express New York 2022 408 0.8% A+Fidelity <strong>Properties</strong> Inc. New York/Boston 2009 381 0.8% BBB-Pepco Holdings Inc. Washington, D.C. 2028 364 0.8% BBB+Enbridge Inc. Calgary/Edmonton 2016 355 0.7% A-Teachers Insurance Annuity Association Denver 2008 323 0.7% AAACanadian Natural Resources Calgary 2011 277 0.6% BBB+Goldman Sachs New York 2015 274 0.6% A+EnCana Corporation Calgary 2013 256 0.5% A-Lehman Brothers New York 2010 253 0.5% AA-Anadarko Canada Corporation Calgary 2011 235 0.5% BBB+Bank of Nova Scotia New York 2014 230 0.5% AA-Amdocs Canada Inc. Toronto 2010 220 0.5% BBB-Bank of America Boston 2008 213 0.4% AAMarsh Mercer Toronto 2015 207 0.4% BGovernment and related services Various Various 1,285 2.7% BBB- or higherOther investment grade Various Various 3,479 7.3% BBB- or higher24,067 50.1%UnratedCadwalader, Wickersham & Taft LLP New York 2024 465 1.0% —Cleary, Gottlieb, Steen & Hamilton New York 2012 446 1.0% —Goodwin Procter LLP Boston 2016 397 0.8% —Wellington Management Co. Boston 2011 358 0.7% —National Association of Securities Dealers New York 2020 277 0.6% —Osler Hoskin & Harcourt LLP Toronto 2015 254 0.5% —CI Investments Inc. Toronto 2011 212 0.4% —Total 26,476 55.1%(1)Weighted average based on square feet(2)Prior to considering partnership interests in partially-owned properties(3)From Standard & Poors, Moody’s or Dominion Bond Rating ServiceLEASE ROLL-OVER RISKLease roll-over risk arises from the possibility that we may experience difficulty renewing leases as they expire or in releasing spacevacated by tenants upon early lease expiry. We attempt to stagger the lease expiry profile so that we are not faced with disproportionateamounts of space expiring in any one year; approximately 5% of our leases mature annually. We further mitigate this risk by maintaininga diversified portfolio mix by geographic location and by proactively leasing space in advance of its contractual expiry. Additionaldiscussion of our strategy to manage lease roll-over risk can be found on page 18 of this MD&A.44
The following table sets out lease expiries, by square footage, for our portfolio at December 31, <strong>2005</strong>:December 31, <strong>2005</strong> Currently2013 &(000’s Sq. Ft.) Available 2006 2007 2008 2009 2010 2011 2012 Beyond TotalNew York 619 317 18 252 102 517 216 591 9,821 12,453Boston 150 65 85 447 15 172 382 26 821 2,163Washington, D.C. 15 ⎯ ⎯ 18 10 ⎯ 18 47 1,449 1,557Toronto 687 454 604 697 849 1,122 615 735 6,515 12,278Calgary 71 201 289 407 298 1,130 1,613 633 4,294 8,936Ottawa 5 117 66 1,006 135 2 ⎯ 2 1,602 2,9351,547 1,154 1,062 2,827 1,409 2,943 2,844 2,034 24,502 40,322% of total 3.8% 2.8% 2.6% 6.8% 3.4% 7.1% 6.9% 5.0% 46.7% 85.1%Denver 271 126 154 446 92 250 101 136 1,029 2,605Minneapolis 300 56 31 83 212 50 32 117 2,127 3,008Other 124 127 155 71 155 214 120 91 1,038 2,095695 309 340 600 459 514 253 344 4,194 7,708% of total 1.6% 0.8% 0.8% 1.5% 1.1% 1.2% 0.6% 0.8% 6.5% 14.9%2,242 1,463 1,402 3,427 1,868 3,457 3,097 2,378 28,696 48,0305.4% 3.6% 3.4% 8.3% 4.5% 8.3% 7.5% 5.8% 53.2% 100.0%<strong>Brookfield</strong> <strong>Properties</strong>’ portfolio has a weighted average lease life of nine years. The average lease terms in our major markets of NewYork, Boston, Washington, Toronto, Calgary and Ottawa are 11 years, 6 years, 15 years, 7 years, 7 years and 5 years, respectively.ENVIRONMENTAL RISKSAs an owner of real property, we are subject to various federal, provincial, state and municipal laws relating to environmental matters.Such laws provide that we could be liable for the costs of removing certain hazardous substances and remediating certain hazardouslocations. The failure to remove or remediate such substances or locations, if any, could adversely affect our ability to sell such real estateor to borrow using such real estate as collateral and could potentially result in claims against us. We are not aware of any material noncompliancewith environmental laws at any of our properties nor are we aware of any pending or threatened investigations or actions byenvironmental regulatory authorities in connection with any of our properties or any pending or threatened claims relating toenvironmental conditions at our properties.We will continue to make the necessary capital and operating expenditures to ensure that we are compliant with environmental laws andregulations. Although there can be no assurances, we do not believe that costs relating to environmental matters will have a materiallyadverse effect on our business, financial condition or results of operation. However, environmental laws and regulations can change andwe may become subject to more stringent environmental laws and regulations in the future, which could have an adverse effect on ourfinancial condition or results of operation.OTHER RISKS AND UNCERTAINTIESReal estate investments are generally subject to varying degrees of risk depending on the nature of the property. These risks includechanges in general economic conditions (such as the availability and cost of mortgage funds), local conditions (such as an oversupply ofspace or a reduction in demand for real estate in the markets in which we operate), the attractiveness of the properties to tenants,competition from others with available space and the ability of the owner to provide adequate maintenance at an economical cost.Certain significant expenditures, including property taxes, maintenance costs, mortgage payments, insurance costs and related chargesmust be made regardless of whether or not a property is producing sufficient income to service these expenses. Our commercialproperties are subject to mortgages, which require significant debt service payments. If we are unable or unwilling to meet mortgagepayments on any property, losses could be sustained as a result of the mortgagee’s exercise of its rights of foreclosure or sale.Real estate is relatively illiquid. Such illiquidity may limit our ability to vary our portfolio promptly in response to changing economic orinvestment conditions. Also, financial difficulties of other property owners resulting in distressed sales could depress real estate values inthe markets in which we operate.Our commercial properties generate a relatively stable source of income from contractual tenant rent payments. Continued growth ofrental income is dependent on strong leasing markets to ensure expiring leases are renewed and new tenants are found promptly to fillvacancies.45
While the outlook for commercial office rents is positive in the long term, 2006 may not provide the same level of increases in rentalrates on renewal as compared to previous years. We are, however, substantially protected against short-term market conditions, as mostof our leases are long-term in nature with an average term of nine years. A protracted disruption in the economy, such as the onset of asevere recession, could place downward pressure on overall occupancy levels and net effective rents.Our commercial properties operations have insurance covering certain acts of terrorism for up to $500 million of damage and businessinterruption costs. We continue to seek additional coverage equal to the full replacement cost of our assets. However, until this type ofcoverage becomes commercially available on an economically reasonable basis, any damage or business interruption costs as a result ofuninsured acts of terrorism could result in a material cost to us.In our land development operations, markets have been favorable over the past five years with strong demand for well-locatedresidential lots. Our operations are concentrated in high growth areas which we believe to have positive demographic and economicconditions. Nonetheless, the home building and land development industry is cyclical in nature and may be significantly affected bychanges in general and local economic conditions such as consumer confidence, job stability, availability of financing for home buyersand higher interest rates due to their impact on home buyers’ decisions. These conditions can affect the outlook of consumers and, inparticular, the price and volume of home purchases. Furthermore, we are subject to risks related to the availability and cost of materialsand labor, supply and cost of building lots, and adverse weather conditions that can cause delays in the construction schedules and costoverruns.FOREIGN EXCHANGE FLUCTUATIONSWhile approximately 35% of our assets and 46% of our revenues originate in Canada, we have substantially matched our Canadianassets with Canadian liabilities. Furthermore, our U.S. and Canadian operations are self sustaining and we hedge our net investment inour Canadian operations. As a result, our operations have generally not been materially impacted by the movement in the Canadian toU.S. dollar exchange rate.DERIVATIVE FINANCIAL INSTRUMENTSWe utilize derivative financial instruments primarily to manage financial risks, including interest rate, commodity and foreign exchangerisks. Hedge accounting is applied where the derivative is designated as a hedge of a specific exposure and there is reasonable assurancethe hedge will be effective. Realized and unrealized gains and losses on forward exchange contracts designated as hedges of currencyrisks are included in the cumulative translation account when the currency risk being hedged relates to a net investment in a selfsustainingsubsidiary. Otherwise, realized and unrealized gains and losses on derivative financial instruments designated as hedges offinancial risks are included in income as an offset to the hedged item in the period the underlying asset, liability or anticipatedtransaction to which they relate.Financial instruments that are not designated as hedges are carried at estimated fair values and gains and losses arising from changes infair values are recognized in income as a component of interest and other income in the period the changes occur. The use of nonhedgingderivative contracts is governed by documented risk management policies and approved limits.During <strong>2005</strong>, our use of derivative financial instruments was limited to foreign exchange contracts. Unrealized gains and losses,representing the fair value of such contracts, are determined in reference to the appropriate forward exchange rate for each contract atDecember 31st and are reflected in receivables and other assets or accounts payable and other liabilities, as appropriate, on the balancesheet.At December 31, <strong>2005</strong>, we had foreign exchange contracts to sell a notional amount of C$660 million, maturing in March 2006,designated as hedges for accounting purposes to manage our foreign exchange risk in respect to our Canadian-denominated net assets.The fair value of these contracts at December 31, <strong>2005</strong> was a loss of $1 million which is reflected in the cumulative translationadjustment account.Our self-sustaining subsidiaries also had foreign exchange contracts to sell a notional amount of US$77 million, maturing in January2006, which have not been designated as hedges for financial reporting purposes. The aggregate fair value of these contracts atDecember 31, <strong>2005</strong> was a gain of $0.3 million, which is included in interest and other in the consolidated statement of income.The primary risks associated with our use of derivatives are credit risk and price risk. Credit risk is the risk that losses will be incurredfrom the default of the counterparty on its contractual obligations. The use of derivative contracts is governed by documented riskmanagement policies and approved limits, which includes an evaluation of the creditworthiness of counterparties, as well as managingthe size, diversification and maturity of the portfolio. Price risk is the risk that we will incur losses from derivatives from adverse changesin foreign exchange rates. We mitigate price risk by entering only into derivative transactions where we have determined a significantoffset exists between changes in the fair value of, or the cashflows attributable to, the hedged item and the hedging item.46
PART IV – CRITICAL ACCOUNTING POLICIES AND ESTIMATESCHANGES IN ACCOUNTING POLICIESEffective January 1, <strong>2005</strong>, we adopted the following new accounting policies, none of which individually or collectively had a materialimpact on our consolidated financial statements, unless otherwise noted. These changes were the result of changes to the CanadianInstitute of Chartered Accountants (“CICA”) Handbook, Accounting Guidelines (“AcG”) and Emerging Issues Committee Abstracts(“EIC”).Liabilities and equity, CICA Handbook Section 3861Effective January 1, <strong>2005</strong>, we adopted an amendment to CICA Handbook section 3861, “Financial Instruments – Disclosure andPresentation,” retroactively, with restatement of prior periods. This amendment requires financial instruments that may be settled, atour option, in cash or the equivalent value of a variable number of our equity instruments to be presented as a liability. As a result,certain of our Class AAA preferred shares previously included in shareholders’ interests were reclassified to liabilities under the caption“Capital securities.” Consistent with their presentation as liabilities, dividends paid on these preferred shares of $49 million for the yearended December 31, <strong>2005</strong>, and $39 million during the year ended December 31, 2004, have also been reclassified to interest expense.The retroactive adoption of this amendment resulted in an adjustment to opening retained earnings at January 1, 2004 of $20 millionrepresenting the cumulative foreign exchange impact of Canadian denominated capital securities and reclassification of issue costs.Income for the year ended December 31, 2004 and opening retained earnings at January 1, <strong>2005</strong> are similarly impacted by ($63) millionand $80 million, respectively. Effective January 1, <strong>2005</strong>, certain of these capital securities have been designated as hedges for accountingpurposes to manage our foreign currency exposure in respect to our Canadian denominated net investments.Consolidation of variable interest entities, CICA AcG 15Effective January 1, <strong>2005</strong>, we adopted CICA Accounting Guideline 15, “Consolidation of Variable Interest Entities” (AcG 15). Thisguideline provides guidance for applying the principles in section 1590, “Subsidiaries,” to those entities defined as Variable InterestEntities (VIEs) and more commonly referred to as Special Purpose Entities (SPEs), in which either the equity at risk is not sufficient topermit that entity to finance its activities without additional subordinated financial support from other parties, or equity investors lackeither voting control, an obligation to absorb expected losses, or the right to relieve expected residual returns. AcG 15 requiresconsolidation of VIEs by the Primary Beneficiary. The Primary Beneficiary is defined as the party who has exposure to the majority of aVIE’s expected losses and/or expected residual returns. AcG 15 essentially harmonizes Canadian generally accepted accounting principles(GAAP) with the equivalent US standard, which we adopted in its December 31, 2004 financial statements for purposes of reconciling toUS GAAP. The adoption of this standard did not have a material impact.FUTURE ACCOUNTING POLICY CHANGESThe following future accounting policy changes may have an impact on the company, although the impact, if any, has not beendetermined at this time.Comprehensive Income, CICA Handbook Section 1530In January <strong>2005</strong>, the CICA issued Handbook Section 1530, “Comprehensive Income,” which is effective for our 2007 fiscal year. As aresult of adopting this standard, a new statement, Comprehensive Income, will be included in our financial statements. Majorcomponents for this statement will include unrealized gains and losses on financial assets classified as available-for-sale, unrealizedforeign currency translation amounts, net of hedging, arising from self-sustaining foreign operations, and changes in the fair value ofthe effective position of cash flow hedging instruments.Financial Instruments – Recognition and Measurement, CICA Handbook Section 3855In January <strong>2005</strong>, the CICA issued Handbook Section 3855, “Financial Instruments – Recognition and Measurement,” which is effectivefor our 2007 fiscal year. Under this new standard, all financial instruments will be classified as one of the following: held-to-maturity,loans and receivables, held-for-trading or available-for-sale. Financial assets and liabilities held-for-trading will be measured at fair valuewith gains and losses recognized in net income. Financial assets held-to-maturity, loans and receivables and financial liabilities otherthan those held-for-trading, will be measured at amortized cost. Available-for-sale instruments will be measured at fair value withunrealized gains and losses recognized in other comprehensive income. The standard also permits designation of any financialinstrument as held-for-trading upon initial recognition.Hedges, CICA Handbook Section 3865In January <strong>2005</strong>, the CICA issued Handbook Section 3865, “Hedges,” which is effective for our 2007 fiscal year. This new standardspecifies the criteria under which hedge accounting can be applied and how hedge accounting can be executed for each of the permittedhedging strategies: fair value hedges, cash flow hedges and hedges of a foreign currency exposure of a net investment in a selfsustainingforeign operation. In a fair value hedging relationship, the carrying value of the hedged item is adjusted by gains or losses47
attributable to the hedged risk and recognized in net income. This change in fair value of the hedged item, to the extent that thehedging relationship is effective, is offset by changes in the fair value of the derivative. In a cash flow hedging relationship, the effectiveportion of the change in the fair value of the hedging derivative will be recognized in other comprehensive income. The ineffectiveportion will be recognized in net income. The amounts recognized in accumulated other comprehensive income will be reclassified tonet income in the periods in which net income is affected by the variability in the cash flows of the hedged item. In hedging a foreigncurrency exposure of a net investment in a self-sustaining foreign operation, foreign exchange gains and losses on the hedginginstruments will be recognized in other comprehensive income.Effect of Contingently Convertible Instruments on the Computation of Diluted Earnings Per Share, Emerging Issues CommitteeAbstract 155In September <strong>2005</strong>, the Emerging Issues Committee of the AcSB of the CICA issued EIC 155, “The Effect of Contingently ConvertibleInstruments on the Computation of Diluted Earnings Per Share,” which is effective for our 2006 fiscal year. The abstract addresses whenthe effect of contingently convertible instruments should be included in the computation of diluted earnings per share. The conclusionis that the effect of the contingently convertible instruments should be included in the computation of diluted earnings per share (ifdilutive), regardless of whether the market price trigger has been met. This abstract is to be applied retroactively, with restatement ofprior period diluted earnings per share.Implicit Variable Interests, Emerging Issues Committee Abstract 157In October <strong>2005</strong>, the Emerging Issues Committee issued Abstract No. 157, “Implicit Variable Interests Under AcG 15” (“EIC 157”). ThisEIC clarifies that implicit variable interests are implied financial interests in an entity that change with changes in the fair value of theentity’s net assets exclusive of variable interests which is effective for our 2006 fiscal year. An implicit variable interest is similar to anexplicit variable interest except that it involves absorbing and/or receiving variability indirectly from the entity. The identification of animplicit variable interest is a matter of judgment that depends on the relevant facts and circumstances. The implication of this EIC is notexpected to have a material impact on our financial results.Conditional Asset Retirement Obligations, Emerging Issues Committee Abstract 159In December <strong>2005</strong>, the Emerging Issues Committee issued Abstract No. 159, “Conditional Asset Retirement Obligations” (“EIC 159”).This EIC requires an entity to recognize the fair value of a legal obligation to perform asset retirement activities, even though the timingand/or method of settlement may be uncertain. The implication of this EIC is not expected to have a material impact on our financialresults.USE OF ESTIMATESThe preparation of our financial statements requires management to make judgments, estimates and assumptions that affect thereported amounts of assets and liabilities, disclosure of contingent assets and liabilities at the date of the financial statements and thereported amounts of revenues and expenses during the reporting period. Our estimates are based on historical experience and onvarious other assumptions that are believed to be reasonable under the circumstances. The result of our ongoing evaluation of theseestimates forms the basis for making judgments about the carrying values of assets and liabilities and the reported amounts of revenuesand expenses that are not readily apparent from other sources. Actual results may differ from these estimates under differentassumptions.Our critical accounting policies are those that we believe are the most important in portraying our financial condition and results, andrequire the most subjective judgment and estimates on the part of management. A summary of our significant accounting policies,including the critical accounting policies discussed below, is set forth in Note 1 to our consolidated financial statements.Property AcquisitionsUpon acquisition of rental properties, we determine the fair value of acquired tangible and intangible assets, including land, buildings,tenant improvements, above- and below-market leases and origination costs related to acquired in-place leases, other identifiedintangible assets and assumed liabilities and allocate the purchase price to the acquired assets and assumed liabilities, including land atappraised value and buildings at depreciated replacement cost. We assess and consider fair values based on estimated cashflowprojections that utilize appropriate discount rates, as well as available market information. Estimates of future cashflows are based on anumber of factors including the historical operating results, known and anticipated trends and market conditions. We also consider anallocation of purchase price to other acquired intangibles, including acquired in-place leases that may have a customer relationshipintangible value, including (but not limited to) the nature and extent of the existing relationship with the tenant, the tenant’s creditquality and expectations of renewals. We record acquired above- and below-market leases at their fair value, using a discount rate whichreflects the risks associated with the leases acquired, equal to the difference between: (1) the contractual amounts to be paid pursuant toeach in-place lease; and (2) management’s estimate of fair market lease rates for each corresponding in-place lease, measured over aperiod equal to the remaining term of the leases for above-market leases and the initial term plus the term of any below-market fixed48
ate renewal options for below-market leases. Recorded amounts for in-place lease origination values are based on our evaluation of thespecific characteristics of each tenant’s lease. Factors to be considered include estimates of carrying costs during expected lease-upperiods considering current market conditions, and costs to execute similar leases. Building is stated at a depreciated replacement cost.The cost of buildings and improvements includes the purchase price of property, legal fees and other acquisition costs.Depreciation and amortization on rental properties is based on the allocation of the acquisition cost to land, building, tenantimprovements and intangibles and their estimated useful lives, based on management’s estimates. The allocation of the acquisition costand the determination of the estimated useful lives of the components significantly impact the computation of depreciation andamortization recorded over future periods and, accordingly, net income.DepreciationWe apply the straight-line method of depreciation. Under this method, depreciation is charged to income on a straight-line basis overthe remaining estimated useful life of the property. A significant portion of the acquisition cost of each property is allocated to building.The allocation of the acquisition cost to building and the determination of the useful life are based upon management’s estimates. Inthe event the allocation to building is inappropriate or the estimated useful life of buildings proves incorrect, the computation ofdepreciation will not be appropriately reflected over future periods.Impairment of AssetsWe review the long-lived assets used in operations for impairment when there is an event or change in circumstances that indicates apotential impairment in value. An asset is considered impaired when the undiscounted future cashflows are not sufficient to recover theasset’s carrying value. If such impairment is present, an impairment loss is recognized based on the excess of the carrying amount of theasset over its fair value. The evaluation of anticipated cashflows is based in part on assumptions regarding future occupancy, rental ratesand capital requirements that could differ materially from actual results in future periods.The fair value of mortgages receivable depends upon the financial stability of the issuer and the economic value of the underlyingsecurity.There were no impairments recorded for the years ended December 31, <strong>2005</strong> or 2004.Revenue RecognitionBase rental revenue is reported on a straight-line basis over the terms of each lease. In accordance with EIC-140, we recognize rentalrevenue of acquired in-place “above and below” market leases at their fair value over the terms of the respective leases. Free rentreceivable represents rental income recognized in excess of rent payments actually received pursuant to the terms of the individual leaseagreements. An allowance for doubtful accounts is recorded, if necessary, for estimated losses resulting from the inability of tenants tomake required rent payments. The computation of this allowance is based on the tenants’ payment history and current credit status, aswell as certain industry or geographic specific credit considerations.Recoveries from tenants, consisting of amounts due from tenants for common area maintenance, real estate taxes and other recoverablecosts, are recognized as revenue in the period the expenses are incurred. Tenant reimbursements are recognized and presented inaccordance with EIC Abstract No. 123 “<strong>Report</strong>ing Revenue Gross as a Principal versus Net as an Agent,” which requires that thesereimbursements be recorded on a gross basis, as we are generally the primary obligor with respect to purchasing goods and servicesfrom third-party suppliers, having discretion in selecting suppliers and taking credit risk.Fair Value of Financial InstrumentsThe fair values of mortgage debt notes payable and unsecured senior notes are calculated based on the discount spread between thefuture contractual interest payments and future interest payments on mortgage debt based on a current market rate. In determining thecurrent market rate, market spread is added to the quoted yields on federal government bonds with similar maturity dates to debt inplace. Because valuations of the financial instruments are based on these types of estimates, the fair values of financial instruments maychange if the estimates do not prove to be accurate.TaxIn accordance with both Canadian and US GAAP, we use the liability method of accounting for future income taxes and provide forfuture income taxes for all significant income tax temporary differences.Preparation of the financial statements requires an estimate of income taxes in the jurisdictions in which we operate. The processinvolves an estimate of our actual current tax exposure and an assessment of temporary differences resulting from differing treatment ofitems, such as depreciation and amortization, for tax and accounting purposes. These differences result in future tax assets and liabilities49
which are included in our balance sheet. An assessment must also be made to determine the likelihood that our future tax assets will berecovered from future taxable income. To the extent that recovery is not considered more likely than not, a valuation allowance must beprovided.Judgment is required in determining the provision for income taxes, future income tax assets and liabilities and any related valuationallowance. To the extent a valuation allowance is created or revised, current period earnings will be affected. Judgment is required toassess tax interpretations, regulations and legislation, which are continually changing to ensure liabilities are complete and to ensureassets net of valuation allowances are realizable. The impact of different interpretations and applications could potentially be material.During the year, we released approximately $11 million (2004 - $21 million) of tax valuation allowances related to our Canadiancommercial operations following the completion of certain reviews by taxation authorities, and recorded $8 million (2004 - $4 million) inpreviously unrecognized tax assets in connection with a strategic tax review undertaken by the company and determination of thenecessary plans to realize such assets. Both these changes are reflected in our income tax provision.RELATED-PARTY TRANSACTIONSIn the normal course of operations, we enter into various transactions on market terms with related parties which have been measuredat exchange value and are recognized in the consolidated financial statements.At December 31, <strong>2005</strong>, we had approximately $397 million (December 31, 2004 - $216 million) of indebtedness outstanding to ourparent company, <strong>Brookfield</strong> Asset Management Inc. and its affiliate, $172 million of which is included in our capital securities and theremainder of the indebtedness balance is included in our commercial property debt. Interest expense related to this indebtedness,including preferred share dividends reclassified to interest expense as discussed in Note 2 of the consolidated financial statements,totaled $12 million for the year ended December 31, <strong>2005</strong> compared to $11 million for the same period in 2004, and were recorded atthe exchange amount. Additionally, included in rental revenues are amounts received from <strong>Brookfield</strong> Asset Management Inc., and itsaffiliates of $5 million (2004 - $5 million). These amounts have been recorded at the exchange amount.50
PART V - BUSINESS ENVIRONMENT AND OUTLOOKCOMMERCIAL OPERATIONSIn the office property markets where we have a presence, the markets appear to have stabilized and are now recovering. While the paceof recovery has been slow, absorption rates have become positive in most markets. The most significant improvement has taken place inCalgary.The lack of development, especially in central business districts, has created some stability and the erosion in rental rates experiencedover the past two years appears to have stabilized. Office vacancy rates are generally expected to decline gradually over the near term,with the pace of absorption potentially accelerating during 2006. As a result, rental rates are expected to begin to move upward this year,with leasing costs and landlord incentives expected to decline at the same time. However, any significant slow-down in the economycould have a dampening effect on the recovery of office markets.The investment market continues to remain competitive with acquisition prices increasing. The strength in acquisition activity is due toa great demand from investors for high-quality office product with limited supply of assets for sale. In addition, the current low interestrate environment has allowed investors to acquire real estate at lower yields.RESIDENTIAL DEVELOPMENT OPERATIONSOperating cash flow increased significantly in <strong>2005</strong> as our Alberta operations benefited from a high level of activity due to the continuedgrowth in the province’s oil and gas industry. While both margins and volumes increased, the high level of activity is creating someupward cost pressure and production delays. Nonetheless, we expect another strong year in 2006.While we remain committed to greenfield developments, over the last several years we have taken a greater interest in infillopportunities as cities strive to intensify. We are working on several infill opportunities at this time and while we have found them totake longer to consummate than traditional deals, we believe that intensification of cities is a trend that must and will continue and as aresult, we plan to designate additional resources to this aspect of the operation going forward.DISCLOSURE CONTROLS AND PROCEDURESManagement, including the Chief Executive Officer and Chief Financial Officer, has evaluated the effectiveness of our disclosure controlsand procedures (as defined in the Canadian Securities Administrators Multilateral Instrument 52-109). Based on that evaluation, the ChiefExecutive Officer and Chief Financial Officer concluded that such disclosure controls and procedures were effective as of December 31,<strong>2005</strong> in providing reasonable assurance that material information relating to the company and our consolidated subsidiaries would bemade known to us by others within those entities.OUTLOOKWe are optimistic as we look to 2006. The leasing markets within which we operate are continuing to improve on a measured basis andthe general economic environment has strengthened, although there are some conditions that warrant continued caution. Further,residential markets remain very sound in Alberta, giving us expectations of another successful year from these operations. With a solidgrowth platform consisting of a strong balance sheet, over eight million square feet of development opportunities and significantfinancial flexibility, <strong>Brookfield</strong> <strong>Properties</strong> is well-positioned to continue to deliver on its commitments to shareholders.Craig J. LaurieSenior Vice President and Chief Financial OfficerFebruary 8, 200651
DISTRIBUTIONSDistributions paid by the company during the year ended December 31, <strong>2005</strong> and in the past three fiscal years are as follows:Currency Dec. 31, <strong>2005</strong> Dec. 31, 2004 Dec. 31, 2003 Dec. 31, 2002Common shares (1) US$ $ 0.6500 $ 0.4200 $ 0.3400 (2) $ 0.2800Class A preferred shares C$ 0.1875 0.1875 0.1875 0.1875Class AA Series E preferred shares C$ 0.7591 0.7061 0.8202 0.7272Class AAA Series A preferred shares C$ — — — 1.6521Class AAA Series B preferred shares C$ — — — 1.6521Class AAA Series C preferred shares C$ — — 1.2356 2.0000Class AAA Series D preferred shares C$ — — 1.2356 2.0000Class AAA Series E preferred shares C$ 0.7695 0.7027 — —Class AAA Series F preferred shares C$ 1.5000 1.5000 1.5000 0.3986Class AAA Series G preferred shares US$ 1.3125 1.3125 0.7237 —Class AAA Series H preferred shares C$ 1.4375 1.4375 0.3033 —Class AAA Series I preferred shares C$ 1.3000 1.3000 — —Class AAA Series J preferred shares C$ 1.2500 0.8333 — —Class AAA Series K preferred shares C$ 1.3000 0.2486 — —(1)Per share amounts include the effect of the three-for-two common stock-split on March 31, <strong>2005</strong>(2)Excludes the distribution of <strong>Brookfield</strong> <strong>Properties</strong> Homes Corporation52
Management’s Responsibility for the Financial StatementsThe consolidated financial statements and management’s financial analysis and review contained in this annual report are theresponsibility of the management of the company. To fulfill this responsibility, the company maintains a system of internal controls toensure that its reporting practices and accounting and administrative procedures are appropriate and provide assurance that relevantand reliable financial information is produced. The consolidated financial statements have been prepared in conformity with Canadiangenerally accepted accounting principles and, where appropriate, reflect estimates based on management’s best judgment in thecircumstances. The financial information presented throughout this annual report is consistent with the information contained in theconsolidated financial statements.Deloitte & Touche LLP, the independent registered chartered accountants appointed by the shareholders, have audited the consolidatedfinancial statements in accordance with Canadian generally accepted auditing standards to enable them to express to the shareholderstheir opinion on the consolidated financial statements. Their report as independent registered chartered accountants is set out below.The consolidated financial statements have been further examined by the Board of Directors and by its Audit Committee, which meetswith the auditors and management to review the activities of each and reports to the Board of Directors. The auditors have direct andfull access to the Audit Committee and meet with the committee both with and without management present. The Board of Directors,directly and through its Audit Committee, oversees management responsibilities and is responsible for reviewing and approving thefinancial statements.Richard B. ClarkPresident and Chief Executive OfficerFebruary 8, 2006Craig J. LaurieSenior Vice President and Chief Financial Officer<strong>Report</strong> of Independent Registered Chartered AccountantsTo the Shareholders,We have audited the consolidated balance sheets of <strong>Brookfield</strong> <strong>Properties</strong> Corporation as at December 31, <strong>2005</strong> and 2004 and theconsolidated statements of income, retained earnings and cashflow for the years then ended. These financial statements are theresponsibility of the company’s management. Our responsibility is to express an opinion on these financial statements based on ouraudits.We conducted our audits in accordance with Canadian generally accepted auditing standards. Those standards require that we plan andperform an audit to obtain reasonable assurance whether the financial statements are free of material misstatement. An audit includesexamining, on a test basis, evidence supporting the amounts and disclosures in the financial statements. An audit also includesassessing the accounting principles used and significant estimates made by management, as well as evaluating the overall financialstatement presentation.In our opinion, these consolidated financial statements present fairly, in all material respects, the financial position of the company as atDecember 31, <strong>2005</strong> and 2004 and the results of its operations and its cashflows for the years then ended in accordance with Canadiangenerally accepted accounting principles.The company is not required to have, nor were we engaged to perform, an audit of its internal control over financial reporting. Our auditincluded consideration of internal control over financial reporting as a basis for designing audit procedures that are appropriate in thecircumstances, but not for the purpose of expressing an opinion on the effectiveness of the company’s internal control over financialreporting. Accordingly, we express no such opinion.Toronto, CanadaFebruary 8, 2006Independent Registered Chartered Accountants53
Consolidated Balance SheetDecember 31 (US Millions) Note <strong>2005</strong> 2004 (1)AssetsCommercial properties 5 $ 7,430 $ 6,555Development properties 6 615 716Receivables and other 7 955 739Restricted cash and deposits 8 316 297Marketable securities 9 58 285Cash and cash equivalents 64 112Assets related to discontinued operations 10 75 96$ 9,513 $ 8,800LiabilitiesCommercial property debt 11 $ 5,216 $ 4,754Accounts payable and other liabilities 12 626 452Future income tax liability 13 188 96Liabilities related to discontinued operations 10 51 64Capital securities 14 1,101 1,069Non-controlling interests 15 59 53Preferred equity - subsidiaries 16 329 320Shareholders’ equityPreferred equity - corporate 17 45 45Common equity 18 1,898 1,947$ 9,513 $ 8,800(1)Certain comparative information has been restated to conform with current year presentation – see Notes 2, 8 and 10See accompanying notes to the consolidated financial statementsOn behalf of the Board,Gordon E. ArnellChairmanRichard B. ClarkPresident and Chief Executive Officer54
Consolidated Statement of IncomeDecember 31 (US Millions, except per share amounts) Note <strong>2005</strong> 2004 (1)Total revenue 20 $ 1,549 $ 1,442Net operating incomeCommercial property operations 20Operating income from properties $ 680 $ 671Lease termination income — 60Total commercial property operations 680 731Residential development operations 20 106 42Interest and other 37 47823 820ExpensesInterest 330 304General and administrative 48 41Non-controlling interests expense 16 20429 455Depreciation and amortization 163 140Unrealized foreign exchange on preferred share restatement — 63Future income taxes and other provisions 13 103 116Net income from continuing operations $ 163 $ 136Discontinued operations 10 1 2Net income $ 164 $ 138Net income per common share 18Basic $ 0.70 $ 0.58Diluted $ 0.69 $ 0.58(1)Certain comparative information has been restated to conform with current year presentation – see Notes 2 and 10See accompanying notes to the consolidated financial statementsConsolidated Statement of Retained EarningsDecember 31 (US Millions) Note <strong>2005</strong> 2004 (1)Retained earnings – beginning of year $ 787 $ 777Net income 164 138Shareholder distributionsPreferred shares dividends - corporate (2) (2)Common share dividends (150) (96)Amount paid in excess of the book value of commonshares purchased for cancellation (52) (30)Retained earnings – end of year 18 $ 747 $ 787(1)Certain comparative information has been restated to conform with current year presentation – see Note 2See accompanying notes to the consolidated financial statements55
Consolidated Statement of CashflowDecember 31 (US Millions) Note <strong>2005</strong> 2004Operating activitiesNet income $ 164 $ 138Depreciation and amortization 168 145Unrealized foreign exchange on preferred share restatement — 63Future income taxes and other provisions 103 116Commercial property tenant installation costs (123) (82)Other (206) 79106 459Financing activities and capital distributionsCommercial property debt arranged 750 452Commercial property debt repayments (463) (626)Land development debt, net (4) (8)Capital securities issued — 261Common shares issued 8 10Common shares repurchased (74) (43)Cashflow retained from (distributed to) non-controlling interests 3 (163)Preferred share dividends - corporate (2) (2)Common share dividends (150) (96)68 (215)Investing activitiesMarketable securities 227 (18)Acquisitions of real estate, net 23 (366) (207)Dispositions of real estate, net 23 7 63Development and redevelopment investments (50) (55)Restricted cash and deposits (19) (21)Capital expenditures (21) (26)(222) (264)Decrease in cash resources (48) (20)Opening cash and cash equivalents 112 132Closing cash and cash equivalents $ 64 $ 112See accompanying notes to the consolidated financial statements56
Notes to the Consolidated Financial StatementsNOTE 1: SUMMARY OF ACCOUNTING POLICIES(a) GeneralThe consolidated financial statements of <strong>Brookfield</strong> <strong>Properties</strong> Corporation (“the company”) are prepared in accordance with generallyaccepted accounting principles as prescribed by the Canadian Institute of Chartered Accountants (“CICA”).(b) Principles of consolidationThe consolidated financial statements include:(i)the accounts of all subsidiaries of the company including its wholly-owned operations, as well as BPO <strong>Properties</strong> Ltd.(“BPO <strong>Properties</strong>”) and <strong>Brookfield</strong> Financial <strong>Properties</strong> L.P. (“<strong>Brookfield</strong> Financial <strong>Properties</strong>”); and(ii) the accounts of all subsidiaries’ incorporated and unincorporated joint ventures and partnerships to the extent of thecompany’s proportionate interest in their respective assets, liabilities, revenue and expenses.The company’s ownership interests in operating entities which are not wholly owned, other than joint ventures, are as follows:(i)<strong>Brookfield</strong> Financial <strong>Properties</strong> L.P.: The company owns a 99.4% limited partnership interest and general partnershipinterest in <strong>Brookfield</strong> Financial <strong>Properties</strong> L.P.(ii) BPO <strong>Properties</strong> Ltd.: The company owns 89% on an equity basis and 54.3% on a voting basis of the common shares ofBPO <strong>Properties</strong> Ltd.(c) <strong>Properties</strong>(i) Commercial propertiesCommercial properties held for investment are carried at cost less accumulated depreciation. Upon acquisition, thecompany allocates the purchase price to the components of the commercial properties acquired: the amount allocated toland is based on its estimated fair value; buildings and existing tenant improvements are recorded at depreciatedreplacement cost; above- and below-market in-place operating leases are determined based on the present value of thedifference between the rents payable under the contractual terms of the leases and estimated market rents; leaseorigination costs for in-place operating leases are determined based on the estimated costs that would be incurred to putthe existing leases in place under the same terms and conditions; and tenant relationships are measured based on thepresent value of the estimated avoided net costs if a tenant were to renew its lease at expiry, discounted by the probabilityof such renewal.Depreciation on buildings is provided on a straight-line basis over the useful lives of the properties to a maximum of 60years. Depreciation is determined with reference to each rental property’s carried value, remaining estimated useful lifeand residual value. Acquired tenant improvements, above- and below-market in-place operating leases and leaseorigination costs are amortized on a straight-line basis over the remaining terms of the leases. The value associated withtenant relationships is amortized on a straight-line basis over the expected term of the relationships. All other tenantimprovements and re-leasing costs are deferred and amortized on a straight-line basis over the lives of the leases towhich they relate. Depreciation on buildings and amortization of deferred leasing costs and tenant improvements thatare determined to be assets of the company are recorded in depreciation and amortization expense. All other amounts areamortized to revenue.<strong>Properties</strong> are reviewed for impairment whenever events or changes in circumstances indicate the carrying value may notbe recoverable. For commercial properties, an impairment loss is recognized when a property’s carrying value exceeds itsundiscounted future net cashflow. The impairment is measured as the amount by which the carrying value exceeds theestimated fair value. Projections of future cashflow take into account the specific business plan for each property andmanagement’s best estimate of the most probable set of economic conditions anticipated to prevail in the market.(ii)Commercial development propertiesCommercial properties under development consist of properties for which a major repositioning program is beingconducted and properties which are under construction. These properties are recorded at cost, including predevelopmentexpenditures. For development properties, an impairment loss is recognized when a property’s carryingvalue exceeds its undiscounted future net cashflow. <strong>Properties</strong> are reviewed for impairment whenever events or changes57
in circumstances indicate the carrying value may not be recoverable. The impairment is measured as the amount by whichthe carrying value exceeds the estimated fair value. Projections of future cashflow take into account the specific businessplan for each property and management’s best estimate of the most probable set of economic conditions anticipated toprevail in the market.(iii) Residential development propertiesDevelopment land is held for residential development and is recorded at the lower of cost and estimated net realizablevalue. Costs are allocated to the saleable acreage of each project or subdivision in proportion to the anticipated revenue.(d) Capitalized costsCosts capitalized to commercial and residential properties which are under development and other properties held for sale include alldirect and directly attributable expenditures incurred in connection with the acquisition, development, construction and initialpredetermined leasing period. Costs directly attributable to development projects include interest and salaries and benefits of employeesdirectly associated with the development projects, such as architects, engineers, designers and development project managers. Ancillaryincome relating specifically to such properties during the development period is treated as a reduction of costs.(e) Deferred financing costsFinancing costs are deferred and amortized to amortization expense on a straight-line basis over the terms of the debt to which theyrelate.(f) Stock-based compensationThe company accounts for stock options using the fair value method. Under this method, compensation expense for stock options thatare direct awards of stock is measured at fair value at the grant date using the Black-Scholes option pricing model and recognized overthe vesting period. A Deferred Share Unit (“DSU”) plan is offered to executive officers and non-employee directors of the company.DSUs are accounted for as liabilities. Employee compensation expense for these plans is charged against income over the vesting periodof the DSUs. Changes in the amount payable by the company in respect to vested DSUs as a result of dividends and share pricemovements are recorded as employee compensation expense in the period of the change.(g) Revenue recognition(i) Commercial propertiesThe company has retained substantially all of the risks and benefits of ownership of its rental properties and thereforeaccounts for leases with its tenants as operating leases. The total amount of contractual rent to be received fromoperating leases is recognized on a straight-line basis over the term of the lease; a straight-line or free rent receivable, asapplicable, is recorded for the difference between the rental revenue recorded and the contractual amount received.Rental revenue includes percentage participating rents and recoveries of operating expenses, including property, capitaland Canadian large corporation taxes. Percentage participating rents are recognized when tenants’ specified sales targetshave been met. Operating expense recoveries are recognized in the period that recoverable costs are chargeable totenants.Revenue from a commercial property is recognized upon the earlier of attaining a break-even point in cashflow after debtservicing or the expiration of a reasonable period of time, subject to the time limitation determined when the project isapproved, but no later than one year following substantial completion. Prior to this, the property is categorized as aproperty under development, and related revenue is applied to reduce development costs.(ii)Residential propertiesLand sales are recognized at the time that the risks and rewards of ownership have been transferred, possession or titlepasses to the purchaser, all material conditions of the sales contract have been met, and a significant cash down paymentor appropriate security is received.Revenue from the sale of homes is recognized when title passes to the purchaser upon closing and at which time allproceeds are received or collectability is assured.(h) Income taxesThe company accounts for income taxes under the liability method. Under this method, future income tax assets and liabilities arecalculated based on: (i) the temporary differences between the carrying values and the tax bases of assets and liabilities, and (ii) unusedincome tax losses, measured using substantively enacted income tax rates and laws that are expected to apply in the future as temporarydifferences reverse and income tax losses are used.58
(i) <strong>Report</strong>ing currency and foreign currency translationThe consolidated financial statements have been presented in US dollars as the company’s principal investments and cashflow areinfluenced primarily by the US dollar. Assets and liabilities denominated in foreign currencies are translated into US dollars at the rate ineffect at the balance sheet date. Revenues and expenses are translated at the weighted average rate in effect for the period presented.The company’s operations in Canada are self-sustaining in nature and as such, cumulative gains and losses arising from theconsolidation of the assets and liabilities of these operations are recorded as a separate component of shareholders’ equity.All amounts expressed in the financial statements are in millions of US dollars unless otherwise noted.(j) Marketable securitiesMarketable securities are carried at the lower of amortized cost and their estimated net realizable value. During periods where the fairvalue or the quoted market value may be less than cost, the company reviews the relevant security to determine if it will recover itscarrying value within a reasonable period of time and adjusts it, if necessary. The company also considers the degree to which estimationis incorporated into valuations and any potential impairment relative to the magnitude of the related portfolio.In determining fair values, quoted market prices are generally used when available and, when not available, management estimates theamounts which could be recovered over time or through a transaction with knowledgeable and willing third parties under nocompulsion to act.(k) Use of estimatesThe preparation of financial statements, in conformity with Canadian generally accepted accounting principles, requires estimates andassumptions that affect the carried amounts of assets and liabilities and disclosure of contingent assets and liabilities at the date of thefinancial statements and the reported amounts of revenues and expenses during the reporting period. Actual results could differ fromestimates. Significant estimates are required in the determination of future cashflows and probabilities in assessing net recoverableamounts and net realizable value, the allocation of the purchase price to components of commercial properties and businesses acquired,depreciation and amortization, the company’s ability to utilize tax losses, hedge effectiveness and fair value for disclosure purposes.(l) Derivative financial instrumentsThe company and its subsidiaries utilize derivative financial instruments primarily to manage financial risks, including interest rate,commodity and foreign exchange risks. The use of derivative contracts is governed by documented risk management policies andapproved limits. During <strong>2005</strong>, the company’s use of derivative financial instruments was limited to foreign exchange contracts.Hedge accounting is applied where the derivative is designated as a hedge of a specific exposure and there is reasonable assurance thehedge will be effective. Realized and unrealized gains and losses on forward exchange contracts designated as hedges of currency risksare included in the cumulative translation account when the currency risk being hedged relates to a net investment in a self-sustainingsubsidiary. Otherwise, realized and unrealized gains and losses on derivative financial instruments designated as hedges of financialrisks are included in income as an offset to the hedged item in the period the underlying asset, liability or anticipated transaction towhich they relate.Financial instruments that are not designated as hedges are carried at estimated fair values, and gains and losses arising from changesin fair values are recognized in income as a component of interest and other income in the period the changes occur. The use of nonhedgingderivative contracts is governed by documented risk management policies and approved limits.Unrealized gains and losses, representing the fair value of outstanding foreign exchange contracts, are determined in reference to theappropriate forward rate for each contract at December 31st and are reflected in receivables and other assets or accounts payable andother liabilities, as appropriate, on the balance sheet.(m) Cash and cash equivalentsCash and cash equivalents include cash and short-term investments with original maturities of three months or less.(n) Comparative figuresCertain comparative figures have been reclassified or restated to conform with the current year’s presentation.59
NOTE 2: CHANGES IN ACCOUNTING POLICIESEffective January 1, <strong>2005</strong>, the company adopted the following new accounting policies, none of which individually or collectively had amaterial impact on the consolidated financial statements of the company, unless otherwise noted. These changes were the result ofchanges to the Canadian Institute of Chartered Accountants (“CICA”) Handbook, Accounting Guidelines (“AcG”) and Emerging IssuesCommittee Abstracts (“EIC”).(i) Liabilities and equity, CICA Handbook Section 3861Effective January 1, <strong>2005</strong>, the company adopted an amendment to CICA Handbook section 3861, “Financial Instruments – Disclosureand Presentation,” retroactively with restatement of prior periods. This amendment requires financial instruments that may be settled, atthe company’s option, in cash or the equivalent value of a variable number of the company’s equity instruments to be presented as aliability. As a result, certain of the company’s Class AAA preferred shares previously included in shareholders’ interests were reclassifiedto liabilities under the caption “Capital securities.” Consistent with their presentation as liabilities, dividends paid on these preferredshares of $49 million for the year ended December 31, <strong>2005</strong>, and $39 million during the year ended December 31, 2004, have also beenreclassified to interest expense. The retroactive adoption of this amendment resulted in an adjustment to opening retained earnings atJanuary 1, 2004 of $20 million representing the cumulative foreign exchange impact of Canadian denominated capital securities andreclassification of issue costs. Income for the year ended December 31, 2004 and opening retained earnings at January 1, <strong>2005</strong> aresimilarly impacted by ($63) million and $80 million, respectively. Effective January 1, <strong>2005</strong>, certain of these capital securities have beendesignated as hedges for accounting purposes to manage the company’s foreign currency exposure in respect to its Canadiandenominated net investments.(ii) Consolidation of variable interest entities, CICA AcG 15Effective January 1, <strong>2005</strong>, the company adopted CICA Accounting Guideline 15, “Consolidation of Variable Interest Entities” (AcG 15).This guideline provides guidance for applying the principles in section 1590, “Subsidiaries,” to those entities defined as Variable InterestEntities (VIEs) and more commonly referred to as Special Purpose Entities (SPEs), in which either the equity at risk is not sufficient topermit that entity to finance its activities without additional subordinated financial support from other parties, or equity investors lackeither voting control, an obligation to absorb expected losses, or the right to relieve expected residual returns. AcG 15 requiresconsolidation of VIEs by the Primary Beneficiary. The Primary Beneficiary is defined as the party who has exposure to the majority of aVIE’s expected losses and/or expected residual returns. AcG 15 essentially harmonizes Canadian generally accepted accounting principles(GAAP) with the equivalent US standard, which the company adopted in its December 31, 2004 financial statements for purposes ofreconciling to US GAAP. The adoption of this standard did not have a material impact on the company.NOTE 3: FUTURE ACCOUNTING POLICY CHANGESThe following future accounting policy changes may have an impact on the company, although the impact, if any, has not beendetermined at this time.(i) Comprehensive Income, CICA Handbook Section 1530In January <strong>2005</strong>, the CICA issued Handbook Section 1530, “Comprehensive Income,” which is effective for the company’s 2007 fiscalyear. As a result of adopting this standard, a new statement, Comprehensive Income, will be included in the company’s financialstatements. Major components for this statement will include unrealized gains and losses on financial assets classified as available-forsale,unrealized foreign currency translation amounts, net of hedging, arising from self-sustaining foreign operations and changes inthe fair value of the effective position of cash flow hedging instruments.(ii) Financial Instruments – Recognition and Measurement, CICA Handbook Section 3855In January <strong>2005</strong>, the CICA issued Handbook Section 3855, “Financial Instruments – Recognition and Measurement,” which is effectivefor the company’s 2007 fiscal year. Under this new standard, all financial instruments will be classified as one of the following: held-tomaturity;loans and receivables; held-for-trading; or available-for-sale. Financial assets and liabilities held-for-trading will be measuredat fair value with gains and losses recognized in net income. Financial assets held-to-maturity, loans and receivables and financialliabilities other than those held-for-trading, will be measured at amortized cost. Available-for-sale instruments will be measured at fairvalue with unrealized gains and losses recognized in other comprehensive income. The standard also permits designation of anyfinancial instrument as held-for-trading upon initial recognition.(iii) Hedges, CICA Handbook Section 3865In January <strong>2005</strong>, the CICA issued Handbook Section 3865, “Hedges,” which is effective for the company’s 2007 fiscal year. This newstandard specifies the criteria under which hedge accounting can be applied and how hedge accounting can be executed for each of thepermitted hedging strategies: fair value hedges; cash flow hedges; and hedges of a foreign currency exposure of a net investment in aself-sustaining foreign operation. In a fair value hedging relationship, the carrying value of the hedged item is adjusted by gains orlosses attributable to the hedged risk and recognized in net income. This change in fair value of the hedged item, to the extent that the60
hedging relationship is effective, is offset by changes in the fair value of the derivative. In a cash flow hedging relationship, the effectiveportion of the change in the fair value of the hedging derivative will be recognized in other comprehensive income. The ineffectiveportion will be recognized in net income. The amounts recognized in accumulated other comprehensive income will be reclassified tonet income in the periods in which net income is affected by the variability in the cash flows of the hedged item. In hedging a foreigncurrency exposure of a net investment in a self-sustaining foreign operation, foreign exchange gains and losses on the hedginginstruments will be recognized in other comprehensive income.(iv) Effect of Contingently Convertible Instruments on the Computation of Diluted Earnings Per Share, Emerging Issues Committee Abstract 155In September <strong>2005</strong>, the Emerging Issues Committee of the AcSB of the CICA issued EIC 155, “The Effect of Contingently ConvertibleInstruments on the Computation of Diluted Earnings Per Share,” which is effective for the company’s 2006 fiscal year. The abstractaddresses when the effect of contingently convertible instruments should be included in the computation of diluted earnings per share.The conclusion is that the effect of the contingently convertible instruments should be included in the computation of diluted earningsper share (if dilutive), regardless of whether the market price trigger has been met. This abstract is to be applied retroactively, withrestatement of prior period diluted earnings per share.(v) Implicit Variable Interests, Emerging Issues Committee Abstract 157In October <strong>2005</strong>, the Emerging Issues Committee issued Abstract No. 157, “Implicit Variable Interests Under AcG 15” (“EIC 157”), whichis effective for the company’s 2006 fiscal year. This EIC clarifies that implicit variable interests are implied financial interests in an entitythat changes with changes in the fair value of the entity’s net assets exclusive of variable interests. An implicit variable interest is similarto an explicit variable interest except that it involves absorbing and/or receiving variability indirectly from the entity. The identification ofan implicit variable interest is a matter of judgment that depends on the relevant facts and circumstances. The implication of this EIC isnot expected to have a material impact on the company’s financial results.(vi) Conditional Asset Retirement Obligations, Emerging Issues Committee Abstract 159In December <strong>2005</strong>, the Emerging Issues Committee issued Abstract No. 159, “Conditional Asset Retirement Obligations” (“EIC 159”),which is effective for the company’s 2006 fiscal year. The accounting treatment in this abstract will be applied retroactively, withrestatement of prior periods. This EIC requires an entity to recognize the fair value of a legal obligation to perform asset retirementactivities, even though the timing and/or method of settlement may be uncertain. The implication of this EIC is not expected to have amaterial impact on the company’s financial results.NOTE 4: PROPERTY ACQUISITIONSDuring the fourth quarter, the company completed the acquisition of a 25% joint venture interest in O&Y <strong>Properties</strong> Corporation andO&Y Real Estate Investment Trust (collectively, “O&Y”). The O&Y portfolio consists of 27 office properties and one development sitetotaling 11.6 million square feet in Toronto, Calgary, Ottawa, Edmonton and Winnipeg. Included in the portfolio is First Canadian Place,which is directly connected to <strong>Brookfield</strong> <strong>Properties</strong>’ Exchange Tower in Toronto. The company will serve as property and asset managerfor the portfolio.The following is a summary of the amounts assigned to each major class of asset and liability of O&Y at the date of acquisition:Purchase Price(Millions)Book ValueCommercial and development properties $ 495Accounts receivable and other assets 14Intangible assets (1) 56Accounts payable and other liabilities assumed (14)Intangible liabilities (1) (97)Future income tax liabilities assumed (26)Commercial property debt assumed (2) (246)Total purchase price $ 182(1)All intangibles are subject to amortization(2)Includes acquisition financing of $110 millionThe earnings from the company’s interest in O&Y are included in the consolidated statement of income commencing from October 21,<strong>2005</strong>.61
NOTE 5: COMMERCIAL PROPERTIESA breakdown of commercial properties is as follows:(Millions) <strong>2005</strong> 2004Commercial properties $ 8,137 $ 7,093Less: Accumulated depreciation (707) (538)Total $ 7,430 $ 6,555(a) Commercial properties, carried at a net book value of approximately $2,644 million (2004 - $2,400 million), are situated on land heldunder leases or other agreements largely expiring after the year 2069. Minimum rental payments on land leases are approximately $22million annually for the next five years and $959 million in total on an undiscounted basis.(b) The following amounts represent the company’s proportionate interest in incorporated and unincorporated joint ventures andpartnerships, reflected in the company’s commercial and development properties:(Millions) <strong>2005</strong> 2004Assets $ 2,669 $ 2,173Liabilities 1,611 1,254Operating revenues 381 363Operating expenses 151 141Net income 99 110Cashflow from operating activities 140 146Cashflow from financing activities (19) —Cashflow (used in) from investing activities (174) 25NOTE 6: DEVELOPMENT PROPERTIESDevelopment properties include commercial developments, primarily for office development and residential land under and held fordevelopment. A breakdown of development properties is as follows:(Millions) <strong>2005</strong> 2004Commercial developments $ 224 $ 399Residential development land 391 317Total $ 615 $ 716Commercial developments include commercial land which represents developable land and construction costs. Residential developmentland includes fully entitled lots and land in processing. The company capitalizes interest and administrative and development costs toboth commercial and residential development properties. During <strong>2005</strong>, the company capitalized a total of $50 million (2004 - $55million) of costs. Included in this amount is $18 million (2004 - $6 million) related to redevelopment costs, $17 million (2004 - $35million) of construction and related costs and $15 million (2004 - $14 million) of interest capitalized to the company’s commercialdevelopment sites.The company, through its subsidiaries, is contingently liable for obligations of its joint venture associates in its residential developmentland joint ventures. The amount of such obligations at December 31, <strong>2005</strong> is $1 million (2004 - $1 million). In each case, all of the assetsof the joint venture are available first for the purpose of satisfying these obligations, with the balance shared among the participants inaccordance with the pre-determined joint venture arrangements.NOTE 7: RECEIVABLES AND OTHERThe components of receivables and other assets are as follows:(Millions) <strong>2005</strong> 2004Receivables and real estate mortgages $ 551 $ 435Prepaid expenses and other assets 279 234Intangible assets 125 70Total $ 955 $ 739Included in intangible assets are lease origination costs, tenant relationships and above-market leases assumed on acquisitions, net ofrelated accumulated amortization.62
NOTE 8: RESTRICTED CASH AND DEPOSITSCash and deposits are considered restricted when they are subject to contingent rights of third parties. Included in restricted cash anddeposits is $256 million (2004 - $268 million) of short-term government securities held in a trust account to match interest and principalpayments of the $246 million mortgage on One Liberty Plaza maturing in 2007. In 2004, the company’s commercial debt in respect toOne Liberty Plaza was presented net of the related defeasance securities. To conform with current year presentation, these securitieshave been reclassified to restricted cash and deposits.NOTE 9: MARKETABLE SECURITIESMarketable securities consists of a portfolio of fixed-rate corporate bonds with a book value exceeding fair value by $1 million (2004 –nil). The portfolio has an average yield of 2.6% with maturities from May 2006 to January 2007. As at December 31, <strong>2005</strong> it was thecompany’s intention to hold the portfolio to maturity.NOTE 10: DISCONTINUED OPERATIONSAssets that meet the criteria of CICA Handbook Section 3475, paragraph .08 are classified as discontinued operations. Any such assetsare recorded at the lower of carrying amount or fair value less estimated cost to sell and are not depreciated while classified as held forsale. The results of operations, balance sheet items and cashflows of any property that has been identified as discontinued operations arereported separately if the company will not have any significant continuing involvement in the operations of the property after thedisposal transaction.In the third and fourth quarters of <strong>2005</strong>, two properties, the Colorado State Bank Building (“CSBB”) and the World Trade Center Denver(“WTD”), respectively, met the criteria for being classified as assets held for sale. The sale of CSBB closed in December <strong>2005</strong> and thedisposition of WTD was completed in January 2006. The company has reclassified $75 million (2004 - $96 million) of assets and $51million (2004 - $64 million) of liabilities to discontinued operations in connection with these properties.The following table summarizes the income from discontinued operations:(Millions, except per share information) <strong>2005</strong> 2004Revenue $ 20 $ 21Operating expenses 9 9$ 11 $ 12Interest expense (5) (5)$ 6 $ 7Depreciation and amortization (5) (5)Income from discontinued operations $ 1 $ 2Income from discontinued operations per common share $ — $ —NOTE 11: COMMERCIAL PROPERTY DEBTPredominantly all commercial property mortgages are secured by individual properties without recourse to the company. Approximately95% of the company’s commercial property debt is due after 2006.WeightedAverageInterest Rate atPrincipal Repayments2011 & <strong>2005</strong> 2004(Millions)Dec. 31, <strong>2005</strong> 2006 2007 2008 2009 2010 Beyond Total TotalCommercial property debt 6.5% $ 270 $ 634 $ 377 $ 837 $ 189 $ 2,909 $ 5,216 $ 4,754Commercial property debt includes $1,221 million (2004 - $945 million) repayable in Canadian dollars of C$1,416 million (2004 -C$1,134 million). The weighted average interest rate at December 31, <strong>2005</strong> was 6.5% (2004 - 6.5%).During the second quarter of <strong>2005</strong>, the company refinanced One World Financial Center with a $300 million recourse mortgage debt ata rate of LIBOR + 100 basis points, a reduction of 100 basis points from the previous mortgage. The company also increased its bankcredit facility by $200 million to $350 million at a rate of LIBOR + 110 basis points, a reduction of five basis points from the previousfacility. The bank credit facility is in the form of a three-year revolving facility and was drawn in the amount of $274 million as atDecember 31, <strong>2005</strong> (2004 - $20 million).63
NOTE 12: ACCOUNTS PAYABLE AND OTHER LIABILITIESThe components of the company’s accounts payable and other liabilities are as follows:(Millions) <strong>2005</strong> 2004Accounts payable $ 342 $ 289Land development debt 158 135Intangible liabilities 126 28Total $ 626 $ 452Land development debt of $158 million (2004 - $135 million) is secured by the underlying properties of the company. The weightedaverage interest rate on these advances as at December 31, <strong>2005</strong> was 5.0% (2004 - 4.2%). Advances totaling $134 million are due by theend of 2006, with the remaining balances due prior to 2010. Included in intangible liabilities are below-market tenant leases and abovemarketground leases assumed on acquisitions, net of related accumulated amortization.NOTE 13: FUTURE INCOME TAXESFuture income tax assets (liabilities) consist of the following:(Millions) <strong>2005</strong> 2004Future income tax liabilities related to difference in tax and book basis, net $ (541) $ (568)Future income tax assets related to non-capital losses and capital losses 353 472Total $ (188) $ (96)The company and its Canadian subsidiaries have future income tax assets of $162 million (2004 - $277 million) that relate to non-capitallosses which expire over the next ten years and $47 million (2004 - $45 million) that relate to capital losses which have no expiry. Thecompany’s U.S. subsidiaries have future income tax assets of $144 million (2004 - $150 million) that relate to net operating losses whichexpire over the next 15 years. The amount of non-capital losses and deductible temporary differences, for which no future income taxassets have been recognized, is approximately $377 million (2004 - $400 million) which also expire over the next 10 years.The components of income tax expense are as follows:(Millions) <strong>2005</strong> 2004Income tax expense at the Canadian federal and provincial incometax rate of 35% (2004 – 35%) $ 94 $ 89Increase (decrease) in income tax expense due to the following:Non-deductible preferred share dividends 19 14Higher income tax rates in other jurisdictions 1 6Minority shareholders’ interests in income tax expense (2) (4)Tax assets previously not recognized (18) (25)Non-taxable portion of capital gains — (1)Foreign exchange on preferred share restatement — 22Other 9 15Total $ 103 $ 116NOTE 14: CAPITAL SECURITIESThe company has the following capital securities outstanding:(Millions, except share information)SharesAuthorizedSharesOutstandingCumulativeDividend Rate <strong>2005</strong> 2004Class AAA Series E 8,000,000 8,000,000 70% of bank prime $ 172 $ 167Class AAA Series F 8,000,000 8,000,000 6.00% 172 167Class AAA Series G 6,000,000 4,400,000 5.25% 110 110Class AAA Series H 8,000,000 8,000,000 5.75% 173 167Class AAA Series I 8,000,000 8,000,000 5.20% 172 167Class AAA Series J 8,000,000 8,000,000 5.00% 172 167Class AAA Series K 6,000,000 6,000,000 5.20% 130 124Total $ 1,101 $ 1,06964
The redemption terms of the Class AAA Preferred Shares are as follows:Redemption Date (1) Redemption Price (2) Company’s Option (3) Holder’s Option (4)Series E Retractable at par — — —Series F September 30, 2009 C $25.75 September 30, 2009 March 31, 2013Series G June 30, 2011 US $26.00 June 30, 2011 September 30, 2015Series H December 31, 2011 C $26.00 December 31, 2011 December 31, 2015Series I December 31, 2008 C $25.75 December 31, 2008 December 31, 2010Series J June 30, 2010 C $26.00 June 30, 2010 December 31, 2014Series K December 31, 2012 C $26.00 December 31, 2012 December 31, 2016(1)Subject to applicable law and rights of the corporation, the company may, on or after the dates specified above, redeem Class AAApreferred shares for cash as follows: the Series F at a price of C$25.75, if redeemed during the 12 months commencing September30, 2009 and decreasing by C$0.25 each 12-month period thereafter to a price per share of C$25.00 if redeemed on or afterSeptember 30, 2012; the Series G at a price of US$26.00, if redeemed during the 12 months commencing June 30, 2011 anddecreasing by US$0.33 each 12-month period thereafter to a price per share of US$25.00 if redeemed on or after June 30, 2014; theSeries H at a price of C$26.00, if redeemed during the 12 months commencing December 31, 2011 and decreasing by C$0.33 each12-month period thereafter to a price per share of C$25.00 if redeemed on or after December 31, 2014; the Series I at a price ofC$25.75, if redeemed during the 12 months commencing December 31, 2008 and decreasing by C$0.25 each 12-month periodthereafter to a price per share of C$25.00 if redeemed on or after December 31, 2010; the Series J at a price of C$26.00 if redeemedduring the 12 months commencing June 30, 2010 and decreasing by C$0.25 each 12-month period thereafter to a price per shareof C$25.00 if redeemed on or after June 30, 2014; the Series K at a price of C$26.00 if redeemed during the 12-monthscommencing December 31, 2012 and decreasing by C$0.33 each 12-month period thereafter to a price per share of $C25.00 ifredeemed on or after December 31, 2015.(2)Subject to applicable law and rights of the corporation, the company may purchase Class AAA preferred shares for cancellation at thelowest price or prices at which, in the opinion of the Board of Directors of the company, such shares are obtainable.(3)Subject to the approval of the Toronto Stock Exchange the company may, on or after the dates specified above, convert the ClassAAA, Series F, G, H, I, J and K into common shares of the company. The Class AAA, Series F, G, H, I, J and K preferred shares maybe converted into that number of common shares determined by dividing the then-applicable redemption price by the greater ofC$2.00 (Series G - US$2.00) or 95% of the weighted average trading price of common shares at such time.(4)Subject to the company’s right to redeem or find substitute purchasers, the holder may, on or after the dates specified above,convert Class AAA, Series F, G, H, I, J and K preferred shares into that number of common shares determined by dividing the thenapplicableredemption price by the greater of C$2.00 (Series G - US$2.00) or 95% of the weighted average trading price of commonshares at such time.Cumulative preferred dividends are payable quarterly, as and when declared by the Board of Directors, on the last day of March, June,September and December.NOTE 15: NON-CONTROLLING INTERESTSNon-controlling interests include the amounts of common equity related to other non-controlling shareholders’ interests in propertyownership entities which are consolidated in the company’s accounts. The balances are as follows:(Millions) Others’ Equity Ownership <strong>2005</strong> 2004Common shares of BPO <strong>Properties</strong> (1) 11.0% $ 47 $ 42Limited partnership units of <strong>Brookfield</strong> Financial <strong>Properties</strong> 0.6% 12 11Total $ 59 $ 53(1)Canadian dollar denominated65
NOTE 16: PREFERRED EQUITY – SUBSIDIARIESSubsidiaries preferred shares outstanding total $329 million (2004 - $320 million) as follows:(Millions, except share information)SharesOutstandingPreferredShares SeriesCumulativeDividend Rate <strong>2005</strong> 2004BPO <strong>Properties</strong> 1,805,489 Series G 70% of bank prime $ 39 $ 383,816,527 Series J 70% of bank prime 82 80300 Series K 30-day BA + 0.4% 129 1242,847,711 Series M 70% of bank prime 62 59800,000 Series N 30-day BA + 0.4% 17 17$ 329 $ 318100%-owned subsidiaries — 2Total $ 329 $ 320The redemption terms of the preferred shares issued by BPO <strong>Properties</strong> are as follows:(i) Series G preferred shareholders are entitled to cumulative dividends at an annual rate equal to 70% of the average bank prime rate.The company may, at its option, redeem the shares at a price of C$25 per share plus arrears on any accrued and unpaid dividends.(ii) Series J and M preferred shareholders are entitled to cumulative dividends at an annual rate equal to 70% of the average bank primerate for the previous quarter. The company may, at its option, redeem the shares at a price of C$25 per share plus arrears on any accruedand unpaid dividends.(iii) Series K preferred shareholders are entitled to cumulative dividends at the 30 day bankers’ acceptance rate plus 0.4%. The companymay, at its option, redeem the shares at a price of C$500,000 per share plus an amount equal to all accrued and unpaid dividends.(iv) Series N preferred shareholders are entitled to cumulative dividends at the 30 day bankers’ acceptance rate plus 0.4%. The companymay, at its option, redeem the shares at C$25 per share plus arrears on any accrued and unpaid dividends.NOTE 17: PREFERRED EQUITY – CORPORATEThe company has the following preferred shares authorized and outstanding included in equity:(Millions, except share information)SharesOutstandingCumulativeDividend Rate <strong>2005</strong> 2004Class A redeemable voting 6,312,000 7.50% $ 11 $ 11Class AA Series E 2,000,000 70% of bank prime 34 34Total $ 45 $ 45Cumulative preferred dividends are payable quarterly, as and when declared by the Board of Directors, on the last day of March, June,September and December.The holders of Class A preferred shares are entitled to receive notice of and to attend all shareholders’ meetings and for all purposes areentitled to one vote for each Class A preferred share held, except in respect to the election of directors, where cumulative voting willapply in the same manner as for the common shares. Upon giving at least 30 days’ notice prior to the date set for redemption, thecompany may redeem all, or from time to time any part, of the outstanding Class A preferred shares on payment to the holders thereof,for each share to be redeemed of an amount equal to C$2.50 per share, together with all accrued and unpaid cumulative dividendsthereon.The company may redeem outstanding Class AA preferred shares, at a redemption price for each of the Class AA preferred shares soredeemed as may have been fixed for that purpose in respect of each series prior to the sale and allotment of any Class AA preferredshares of that series, plus an amount equal to unpaid cumulative dividends.66
NOTE 18: COMMON EQUITYThe authorized common share capital consists of an unlimited number of common voting shares. The issued and outstanding commonshare capital consists of:(Millions) <strong>2005</strong> 2004 (1)Common shares $ 1,066 $ 1,080Retained earnings and cumulative translation adjustment 832 867Total $ 1,898 $ 1,947(1)Certain comparative information has been restated due to adoption of an amendment to the CICA Handbook Section 3861, “FinancialInstruments – Disclosure and Presentation” (See Note 2)Retained earnings and cumulative translation adjustment at December 31, <strong>2005</strong> includes a foreign currency cumulative translationadjustment of $85 million (2004 - $80 million)(a) Common sharesDuring the years <strong>2005</strong> and 2004, common shares issued and outstanding changed as follows:<strong>2005</strong> 2004Common shares outstanding, beginning of year 233,387,780 234,370,052Addition of shares as a result of exercise of options 515,345 1,132,578Deduction of shares as a result of repurchases made (2,693,500) (2,114,850)Common shares outstanding, end of year 231,209,625 233,387,780During <strong>2005</strong>, the exercise of options issued under the company’s share option plan generated cash proceeds of $8 million (2004 - $10million). During <strong>2005</strong>, common shares of the company were acquired for cancellation pursuant to the normal course issuer bid at anaverage price of $27.50 per share (2004 - $20.36).(b) Earnings per shareNet income per share and weighted average common shares outstanding are calculated as follows:(Millions, except per share amounts) <strong>2005</strong> 2004Net income $ 164 $ 138Preferred share dividends (2) (2)Net income available to common shareholders $ 162 $ 136Weighted average shares outstanding – basic 232.1 234.0Net income per share – basic $ 0.70 $ 0.58Weighted average shares outstanding – diluted 234.2 235.7Net income per share – diluted $ 0.69 $ 0.58Weighted average shares outstanding – basic 232.1 234.0Unexercised options 2.1 1.7Weighted average shares outstanding – diluted 234.2 235.7On February 9, <strong>2005</strong>, the Board of Directors approved a three-for-two stock split in the form of a stock dividend payable on March 31,<strong>2005</strong> to shareholders of record on March 15, <strong>2005</strong>. The weighted average common shares outstanding for the year ended December 31,2004 have been restated to reflect the three-for-two stock split on March 31, <strong>2005</strong>.67
NOTE 19: STOCK-BASED COMPENSATIONOptions issued under the company’s Share Option Plan vest proportionately over five years and expire ten years after the grant date. Theexercise price is equal to the market price at the grant date.During the first quarter of <strong>2005</strong>, the company granted 763,000 stock options (2004 – 1,462,500), on a post-split basis, under the ShareOption Plan with a weighted average exercise price of $24.40 per share (2004 - $19.61 per share), which was equal to the market price onthe grant date. The compensation expense was calculated using the Black-Scholes model of valuation, assuming a 7.5-year term, 12%volatility (2004 – 16%), a weighted average dividend yield of 3.5% (2004 – 2%) and an interest rate of 4.1% (2004 – 4.6%). The resultingfair value of $4 million (2004 - $6 million) is charged to expense over the vesting period of the options granted.The following table sets out the number of options to purchase common shares which were issued and outstanding at December 31,<strong>2005</strong> under the company’s share option plan:IssueDateExpiryDateNumberof SharesWeightedAverageExercise Price1998 2008 347,750 $ 9.421999 2009 43,950 6.812000 2010 321,560 7.822001 2011 636,370 11.952002 2012 806,296 12.662003 2013 673,685 13.442004 2014 1,125,747 20.27<strong>2005</strong> 2015 686,604 24.89Total 4,641,962 $ 15.70The change in the number of options, on a post-split basis, during <strong>2005</strong> and 2004 is as follows:<strong>2005</strong> 2004NumberWeightedAverage NumberWeightedAverageof Options Exercise Price of Options Exercise PriceOutstanding, beginning of year 4,692,869 $ 14.03 4,863,360 $ 10.69Granted 763,000 24.40 1,462,500 19.61Exercised (515,345) (12.44) (1,132,578) (8.81)Cancelled (298,562) (20.63) (500,413) (13.13)Outstanding, end of year 4,641,962 $ 15.70 4,692,869 $ 14.03Exercisable at end of year 2,875,041 $ 13.30 2,371,086 $ 11.83A Deferred Share Unit Plan is offered to executive officers and non-employee directors of the company. Under this plan, each officer anddirector may choose to receive all or a percentage of his or her annual incentive bonus or directors fees in the form of deferred shareunits (“DSUs”). The DSUs are vested over a five year period and accumulate additional DSUs at the same rate as dividends on commonshares. Officers and directors are not permitted to convert the DSUs into cash until retirement or cessation of employment. The value ofthe vested and non-vested DSUs, when converted to cash, will be equivalent to the market value of the common shares at the time theconversion takes place. Employee compensation expense for these plans is charged against income over the vesting period of the DSUs.Changes in the amount payable by the company in respect to vested DSUs as a result of dividends and share price movements arerecorded as employee compensation expense in the period of the change.Employee compensation expense related to the stock option and the Deferred Share Unit plans for the year ended December 31, <strong>2005</strong>was $4 million (2004 – $5 million).68
NOTE 20: COMMERCIAL PROPERTY AND RESIDENTIAL DEVELOPMENT OPERATIONS(a) RevenueThe components of revenue are as follows:(Millions) <strong>2005</strong> 2004Revenue from commercial property operations $ 1,123 $ 1,134Revenue from residential development operations 389 261Revenue from commercial property and residential development operations 1,512 1,395Interest and other 37 47Total $ 1,549 $ 1,442(b) Commercial property operationsThe results of the company’s commercial property operations are as follows:(Millions) <strong>2005</strong> 2004Revenue from current properties $ 1,103 $ 1,053Property operating costs (423) (382)Net operating income 680 671Lease termination income — 60Net operating income including lease termination income $ 680 $ 731Due to the events of September 11, 2001 and the impact on the company’s properties in Lower Manhattan, commercial property incomeincludes $3 million (2004 - $7 million) of business interruption insurance claims as a result of loss of revenue.Included in revenue from commercial property operations is a $30 million fee received from Goldman Sachs pursuant to a cooperationagreement permitting the commencement of construction on certain lands adjacent to the company’s World Financial Center in NewYork, known as Site 26.Rental revenues from Merrill Lynch accounted for 24% and 1% of U.S. and Canadian revenues from commercial property operations,respectively (2004 - 22% and 1%, respectively). On a consolidated basis, rental revenues from Merrill Lynch accounted for 14% (2004 -14%) of total revenue from commercial property operations.(c) Residential development operationsThe results of the company’s residential development operations are as follows:(Millions) <strong>2005</strong> 2004Revenue $ 389 $ 261Expenses 283 219Total $ 106 $ 4269
NOTE 21: DIFFERENCES FROM UNITED STATES ACCOUNTING PRINCIPLESCanadian generally accepted accounting principles (“Canadian GAAP”) differ in some respects from the principles that the companywould follow if its consolidated financial statements were prepared in accordance with accounting principles generally accepted in theUnited States (“US GAAP”). The effects of significant accounting differences on the company’s balance sheet and statements of income,retained earnings and cashflow are quantified and described in the accompanying notes. Under both Canadian and US GAAP, non-GAAP measures and discussion are generally not included in the financial statements and notes thereto.(a) Income statement differencesThe incorporation of the significant differences in accounting principles in the company’s statement of income for the year endedDecember 31, <strong>2005</strong> under US GAAP would result in net income under US GAAP of $173 million (2004 - $259 million).The principal differences between Canadian GAAP and US GAAP are summarized in the following table:(Millions, except per share information) Note <strong>2005</strong> 2004Net income as reported under Canadian GAAP (1) $ 164 $ 138Adjustments:Decreased commercial property income (i) (15) (18)Decreased commercial property depreciation (ii) 8 7(Decreased) increased commercial property lease terminationincome and gains (iii) (2) 42Unrealized foreign exchange on preferred share restatement (iv) — 63Decreased interest expense (v) 49 39Decreased residential development income (vi) (26) —Increased deferred income taxes (vii) (5) (12)Net income under US GAAP (1) $ 173 $ 259Net income per shareBasic $ 0.52 $ 0.93Diluted $ 0.52 $ 0.92(1)Included in net income under both Canadian and US GAAP is $1 million from discontinued operations in <strong>2005</strong> (2004 - $2 million)Explanation of the significant income statement differences between Canadian GAAP and US GAAP are as follows:(i) Decreased commercial property incomePrior to January 1, 2004, rental revenue was recognized under Canadian GAAP over the term of the lease as it became due whereincreases in rent are intended to offset the estimated effects of inflation. Effective January 1, 2004, rental revenue is recognized on astraight-line basis over the term of the lease on a prospective basis. Under US GAAP, rental revenue has always been recognized on astraight-line basis. The net impact on the current year income of the company had the straight-line method always been used underCanadian GAAP would be a decrease in commercial property revenue of $15 million (2004 - $18 million).(ii) Decreased commercial property depreciationPrior to January 1, 2004, commercial properties were depreciated under Canadian GAAP using the sinking-fund method. EffectiveJanuary 1, 2004, depreciation of rental properties is recorded using the straight-line method on a prospective basis. Under US GAAP,commercial properties have been depreciated on a straight-line basis from inception. As a result of the higher carrying value underCanadian GAAP at January 1, 2004 when the accounting standard changed, straight-line depreciation is higher under Canadian GAAP by$8 million for <strong>2005</strong> (2004 - $7 million).(iii) (Decreased) Increased commercial property lease termination income and gainsUnder US GAAP, the book values of commercial property assets differ from Canadian GAAP as a result of historical rental revenuerecognition and commercial property depreciation methods, as explained in (i) and (ii). Further, termination of a previously-existing leaseat One World Financial Center in New York resulted in additional lease termination income under US GAAP in 2004 whereas underCanadian GAAP this amount is amortized into income over the life of the lease. The net impact of these amounts would be a decrease incommercial property lease termination income and gains of $2 million (2004 – increase of $42 million).(iv) Unrealized foreign exchange on preferred share restatementEffective January 1, <strong>2005</strong>, an amendment to CICA Handbook section 3861, “Financial Instruments – Disclosure and Presentation,” wasadopted for Canadian GAAP retroactively with restatement of prior periods. This amendment requires financial instruments that may besettled, at the company’s option, in cash or the equivalent value of a variable number of the company’s equity instruments to be70
presented as a liability. As a result, certain of the company’s Class AAA preferred shares previously included in shareholders’ equity werereclassified to liabilities under the caption “capital securities” for Canadian GAAP. For US GAAP, these preferred shares do not meet thecriteria to be classified as liabilities and therefore remain in equity. The effect of the restatement for Canadian GAAP on prior year’searnings for Canadian GAAP purposes has been reversed for US GAAP purposes. See Note 2 to the consolidated financial statements forfurther discussion.(v) Decreased interest expenseRevisions to CICA Handbook Section 3861, “Financial Instruments: Disclosure and Presentation” require certain of the company’s ClassAAA preferred shares currently classified as equity to be classified as liabilities for Canadian GAAP due to the holder’s option to convertthem into a variable number of common shares. These securities are classified as equity for US GAAP purposes as they have conversionor conditional redemption features. Dividends totaling $49 million (2004 - $39 million) were recorded as interest expense for CanadianGAAP.(vi) Decreased residential development incomeThe company’s revenue recognition policy for land sales requires, in part, that the significant risks and rewards of ownership have passedto the purchaser prior to the recognition of revenue by the vendor. Primarily in the province of Alberta, land sales transactionssubstantially transfer the risks and rewards of ownership to the purchaser when both parties are bound to the terms of the saleagreement and possession passes to the purchaser. In certain instances, title may not have transferred. Under FAS No. 66, “Sales of RealEstate,” transfer of title is a requirement for recognizing revenue under US GAAP. Accordingly, residential development income woulddecrease by $26 million for US GAAP purposes.(vii) Increased deferred income taxesIncome taxes are accounted for using the liability method under Canadian and US GAAP. For the year ended December 31, <strong>2005</strong>, anincrease of deferred income tax expense of $5 million (2004 - $12 million) would be recorded under US GAAP due to the tax effect of thestated differences between Canadian and US GAAP described above.Under current Canadian and US GAAP, the impact of changes in income tax rates to the tax asset or liability account is reflected in thecurrent year’s statement of income. Under Canadian GAAP, the impact of the change is reflected when the legislation affecting the taxrate change is substantively enacted, whereas the impact under US GAAP is reflected when legislation is enacted. There was no impact inthe current year from this difference.Net income per share under US GAAP is calculated as follows:(Millions, except per share information) <strong>2005</strong> 2004Net income under US GAAP $ 173 $ 259Preferred share dividends (1) (51) (41)Net income available to common shareholders under US GAAP $ 122 $ 218Earnings per share under US GAAPBasic $ 0.52 $ 0.93Diluted $ 0.52 $ 0.92(1)Preferred share dividends for Canadian GAAP purposes were $2 million (2004 - $2 million)(b) Comprehensive incomeUnder US GAAP, the Financial Accounting Standards Board (“FASB”) issued SFAS 130 entitled “<strong>Report</strong>ing Comprehensive Income,”requiring the reporting of comprehensive income. Comprehensive income, which incorporates net income, includes all changes inequity during the year, and accordingly, the change in the company’s cumulative translation adjustment is reflected in the company’scalculation of comprehensive income.Differences arise from the application of the current rate method of currency translation under US GAAP to all periods presentedpursuant to the adoption of the US dollar as the company’s reporting currency, and from other differences between Canadian and USGAAP as described above under “Income statement differences.”Comprehensive income using US GAAP amounts is as follows:(Millions) <strong>2005</strong> 2004Net income under US GAAP $ 173 $ 259Foreign currency translation adjustment under US GAAP 11 71Comprehensive income using US GAAP amounts $ 184 $ 33071
(c) Balance sheet differencesThere are differences in the treatment of balance sheet items between Canadian GAAP and US GAAP. The incorporation of thesignificant differences in accounting principles in the company’s financial statements as at December 31, <strong>2005</strong> and 2004 would result inthe following balance sheet presentation under US GAAP:(Millions) Note <strong>2005</strong> 2004AssetsCommercial properties (i) $ 7,025 $ 6,145Development properties (ii) 642 716Receivables and other (iii) 977 831Restricted cash and deposits 316 297Marketable securities 58 285Cash and cash equivalents 64 112Deferred income tax asset (iv) — 6Assets related to discontinued operations (i) 69 90Total assets under US GAAP $ 9,151 $ 8,482LiabilitiesCommercial property debt $ 5,216 $ 4,754Accounts payable and other liabilities (v) 766 586Deferred income tax liability (iv) 92 —Liabilities related to discontinued operations 51 64Non-controlling interests 64 58Preferred equity - subsidiaries 329 320Shareholders’ equityPreferred equity - corporate (vi) 865 865Common equity (vii) 1,768 1,835Total liabilities and shareholders’ equity under US GAAP $ 9,151 $ 8,482Significant differences between Canadian GAAP and US GAAP are as follows:(i) Commercial propertiesThere are two principal differences between Canadian GAAP and US GAAP affecting the carrying value of commercial properties. Thefirst difference relates to historical differences in the method of depreciation to be applied to depreciable assets as described in Note21(a)(ii). At December 31, <strong>2005</strong>, this would result in a cumulative adjustment of $405 million (2004 - $410 million). The seconddifference relates to the method of accounting for joint ventures and partnerships. Under Canadian GAAP, the accounts of allincorporated and unincorporated joint ventures and partnerships are proportionately consolidated according to the company’sownership interest. Under US GAAP, the equity method of accounting is applied. In circumstances where a joint venture is an operatingentity and the significant financial and operating policies are, by contractual arrangement, jointly controlled by all parties having anequity interest in the entity, US regulations do not require adjustment to equity account the joint ventures. The presentation of thecompany’s joint ventures does not require adjustment to the equity method.(Millions) <strong>2005</strong> 2004Commercial properties under Canadian GAAP $ 7,430 $ 6,555Additional accumulated depreciation under US GAAP (405) (410)Commercial properties under US GAAP $ 7,025 $ 6,145FAS No. 144, “Accounting for the Impairment or Disposal of Long-Lived Assets,” requires that long-lived assets that are to be disposedof by sale be measured at the lesser of book value or fair value less cost to sell. The difference in the carrying amount of assets related todiscontinued operations under US GAAP relates to historical differences in the method of depreciation as compared to Canadian GAAP.72
Assets related to discontinued operations as calculated under US GAAP are as follows:(Millions) <strong>2005</strong> 2004Assets related to discontinued operations under Canadian GAAP $ 75 $ 96Additional accumulated depreciation under US GAAP (6) (6)Assets related to discontinued operations under US GAAP $ 69 $ 90(ii) Development propertiesThe impact on development properties related to differences described in Note 21(a)(vi) is as follows:(Millions) <strong>2005</strong> 2004Development properties under Canadian GAAP $ 615 $ 716Residential inventory adjustment 27 —Development properties under US GAAP $ 642 $ 716(iii) Receivables and otherThe principal differences in the accounting for receivables and other under US GAAP is the inclusion of a straight-line rent receivable of$76 million (2004 - $92 million) had the company always straight-lined its revenue and the deferral of residential income. Refer toNotes 21(a)(i) and 21(a)(vi).(Millions) <strong>2005</strong> 2004Receivables and other under Canadian GAAP $ 955 $ 739Straight-line rent receivable adjustment 76 92Residential receivable adjustment (54) —Receivables and other under US GAAP $ 977 $ 831(iv) Deferred income taxesThe deferred income tax (liability) asset under US GAAP is calculated as follows:(Millions) <strong>2005</strong> 2004Tax assets related to net operating and capital losses $ 489 $ 612Tax liabilities related to differences in tax and book basis (442) (458)Valuation allowance (139) (148)Deferred income tax (liability) asset under US GAAP $ (92) $ 6(v) Accounts payable and other liabilitiesThe principal difference under US GAAP relates to deferred income relating to a lease transaction at One World Financial Center in NewYork. The accounts payable and other liabilities under US GAAP is as follows:(Millions) <strong>2005</strong> 2004Accounts payable and other liabilities under Canadian GAAP $ 626 $ 452Classification of Class AAA, Series E preferred shares (1) 172 167Tenant inducement (32) (33)Accounts payable and other liabilities under US GAAP $ 766 $ 586(1)Classified as capital securities for Canadian GAAP purposes(vi) Preferred equity – corporateUnder US GAAP, the company’s Class AAA preferred shares, with the exception of Series E, are included in preferred equity – corporate.Effective January 1, <strong>2005</strong>, the company reclassified certain of these shares to liabilities under the caption “capital securities” underCanadian GAAP in accordance with CICA Handbook Section 3861 (see Note 2). Preferred equity – corporate under US GAAP is asfollows:(Millions) <strong>2005</strong> 2004Preferred shares – corporate under Canadian GAAP $ 45 $ 45Classification of capital securities as preferred equity 820 820Preferred shares – corporate under US GAAP $ 865 $ 86573
(vii) Common shareholders’ equityThe cumulative impact of US GAAP adjustments to common shareholders’ equity is as follows:(Millions) <strong>2005</strong> 2004Common shareholders’ equity under Canadian GAAP $ 1,898 $ 1,947Adjustment to accumulated depreciation under US GAAP (411) (416)Adjustment to accounts payable and other liabilities under US GAAP 32 33Adjustment to deferred income tax asset under US GAAP 95 102Rental revenue adjustments under US GAAP 74 92Residential revenue adjustment under US GAAP (27) —Foreign currency translation adjustments, net 27 (3)Net effect on equity of amendment to CICA HandbookSection 3861 not required for US GAAP 80 80Common shareholders’ equity under US GAAP $ 1,768 $ 1,835As a result of the above adjustments, the components of common equity under US GAAP are as follows:(Millions) <strong>2005</strong> 2004Common shares $ 1,159 $ 1,173Additional paid-in capital, net of retained earnings 847 871Cumulative translation adjustment (18) (29)Cumulative adjustments to net income and retained earnings (220) (180)Common shareholders’ equity under US GAAP $ 1,768 $ 1,835Joint venturesUnder US GAAP, proportionate consolidation of investments in joint ventures is generally not permitted. As allowed under certain rulesfor foreign private issuers promulgated by the United States Securities and Exchange Commission, the company has continued to followthe proportionate consolidation method. Refer to Notes 1 and 5(b).(d) Cashflow statement differencesThe statement of cashflow prepared under US GAAP differs from Canadian GAAP because dividends paid on capital securities areclassified as operating items for Canadian GAAP and as financing items for US GAAP. As a result, the summarized cashflow statementunder US GAAP is as follows:(Millions) <strong>2005</strong> 2004Cash provided from (used in) the following activitiesOperating $ 155 $ 498Financing 19 (254)Investing (222) (264)Decrease in cash $ (48) $ (20)(e) Change in accounting policies(i) EITF 03-6, “Participating Securities and the Two-Class Method under FASB Statement No. 128, Earnings per Share”This EITF requires the measurement of the impact of certain securities or other instruments or contracts that entitle theirholders to participate in undistributed earnings of the reporting entity, provided such entitlement is non-discretionary andobjectively determinable in determining earnings per share. EITF 03-6 is effective for the company’s <strong>2005</strong> fiscal year, andrequires retroactive adjustment to earnings per share presented for prior periods. The adoption of this EITF did not have amaterial impact on the company.(ii) FASB Interpretation 47, “Accounting for Conditional Asset Retirement Obligations”Effective for December 31, <strong>2005</strong>, the company adopted FASB Interpretation 47, “Accounting for Conditional Asset RetirementObligations.” This interpretation clarifies that the term, conditional asset retirement obligation, in FASB statement 143,“Accounting for Asset Retirement Obligations,” refers to a legal obligation to perform an asset retirement activity in which thetiming and/or method of settlement are conditional on a future event that may or may not be within the control of the entity.The obligation to perform the asset retirement activity is unconditional even though uncertainty exists about the timing and/ormethod of settlement. Accordingly, an entity is required to recognize a liability for the fair value of a conditional assetretirement obligation if the fair value of the liability can be reasonably estimated. The fair value of the liability for the74
conditional asset retirement obligation is recognized as incurred, generally when the asset is acquired, constructed or duringthe normal operations of the asset. The adoption of this interpretation did not have a material impact on the company.(f) Future accounting policy changes(i) SFAS 154, “Accounting Changes and Error Corrections”In May <strong>2005</strong>, the FASB issued SFAS 154, “Accounting Changes and Error Corrections,” which replaces APB Opinion 20,“Accounting Changes” and SFAS 3, “<strong>Report</strong>ing Accounting Changes in Interim Financial Statements.” SFAS requiresretrospective application of changes in accounting principle to prior periods’ financial statements unless it is impracticable todetermine the period-specific effects or the cumulative effect of the change. This statement is effective for fiscal yearsbeginning after December 15, <strong>2005</strong>.(ii) SFAS 123R, “Share-Based Payment”In December 2004, the FASB issued SFAS 123R, “Share-Based Payment” (“SFAS 123R”), which establishes accountingstandards for all transactions in which an entity exchanges its equity instruments for goods or services. SFAS 123R focusesprimarily on accounting for transactions with employees, and carries forward without change prior guidance for share-basedpayments for transactions with non-employees.SFAS 123R eliminates the intrinsic value measurement objective in APB Opinion 25 and generally requires the company tomeasure the cost of employee services received in exchange for an award of equity instruments based on the fair value of theaward on the date of the grant. The standard requires grant date fair value to be estimated using either an option-pricingmodel which is consistent with the terms of the award or a market observed price, if such a price exists. Such cost must berecognized over the period during which an employee is required to provide service in exchange for the award. The standardalso requires the company to estimate the number of instruments that will ultimately be issued, rather than accounting forforfeitures as they occur. The company is assessing the requirements of the standard and believes that its adoption will nothave a significant impact.In March <strong>2005</strong>, the SEC issued Staff Accounting Bulletin No. 107, “Share-Based Payment,” which expresses the SEC staff’sviews on FAS 123R and is effective upon adoption of FAS 123R. Pursuant to the SEC’s announcement in April <strong>2005</strong>, companiesare allowed to implement the standard at the beginning of their next fiscal year, instead of their next reporting period, thatbegins after June 15, <strong>2005</strong>. FAS 123R and its related FSPs are effective for the company as of January 1, 2006. The company iscurrently assessing the impact of adopting FAS123R on its financial positions and results of operations, but it does not expectthe impact to be material.NOTE 22: GUARANTEES, CONTINGENCIES AND OTHER(a) In the normal course of operations, the company and its consolidated subsidiaries execute agreements that provide forindemnification and guarantees to third parties in transactions such as business dispositions, business acquisitions, sales of assets, salesof services, securitization agreements and underwriting and agency agreements. In particular, the company provided income guaranteesto the co-owners in connection with the sale of certain properties in prior years. These guarantees are based on a specified level ofcontractual occupancy until July 2007. The company’s maximum potential loss is $3 million; however, based on estimated levels ofoccupancy, the company does not expect to make any payments.In the ordinary course of the company’s residential development business, the company’s subsidiaries have provided guarantees in theform of letters of credit and performance bonds. As at December 31, <strong>2005</strong>, these guarantees amounted to $35 million, which have notbeen recognized in the financial statements. Such guarantees are required by the municipalities in which the business unit operatesbefore construction permission is granted. The scope of these guarantees cover specific construction obligations of individual projects asthey are developed, and the term of these guarantees span the life of the project, which range from three to eight years. The values ofthe guarantees are reduced as completion milestones are achieved on the projects. These guarantees are terminated only when themunicipality has issued conditions to release a Final Acceptance Certificate to the business unit, which verifies that the business unit hasfulfilled all its contractual obligations. Payment of the guarantees is triggered in the event of expired letters of credit or whenperformance bonds are not renewed and the contractual obligations have not been fulfilled. During the year the company has providedguarantees which, as at December 31, <strong>2005</strong>, amounted to $22 million, that have not been recognized in the financial statements. Theseguarantees arose from the issuance of tax-exempt municipal bonds for infrastructure construction in the company’s Denver, Coloradocommunities. The term of the guarantees span the life of the projects, which range from six to twelve years. The value of the guaranteesis reduced as completion milestones are achieved on the projects and are terminated on or before build out. Payment of the guaranteesis triggered in the event that the debt payments to the bondholders are not fulfilled. The company has not been required to make anypayments under these municipal bonds.75
The company has also agreed to indemnify its directors and certain of its officers and employees. The nature of substantially all of theindemnification undertakings prevent the company from making a reasonable estimate of the maximum potential amount that could berequired to pay third parties as the agreements do not specify a maximum amount and the amounts are dependent upon the outcomeof future contingent events, the nature and likelihood of which cannot be determined at this time. Historically, neither the company norits consolidated subsidiaries have made significant payments nor do they expect to make any significant payments under suchindemnification agreements.<strong>Brookfield</strong> <strong>Properties</strong> does not conduct its operations, other than equity-accounted investments, through entities that are not fully orproportionately consolidated in its consolidated financial statements, and has not guaranteed or otherwise contractually committed tosupport any material financial obligations not reflected in its consolidated financial statements.(b) The company and its operating subsidiaries are contingently liable with respect to litigation and claims that arise from time to time inthe normal course of business. In the opinion of management, any liability which may arise from such contingencies would not have amaterially adverse effect on the consolidated financial statements of the company.(c) On September 11, 2001, <strong>Brookfield</strong> <strong>Properties</strong> owned eight million square feet of space in four office towers surrounding the WorldTrade Center site - One Liberty Plaza and One, Two and Four World Financial Center. The physical damage sustained by these propertiesas a result of the attack on and subsequent collapse of the World Trade Center was mainly cosmetic and consisted primarily ofreplacement of broken windows and some repair to the granite façade on the World Financial Center. While there was no structuraldamage to these four office towers, the glass-enclosed Winter Garden atrium at the center of the World Financial Center suffered moresignificant damage from falling debris than other areas of the complex. This component of the World Financial Center was fully restoredand re-opened in September 2002.To date, approximately $233 million has been received for property and business interruption claims relating to One Liberty Plaza, OneWorld Financial Center, the Winter Garden and common areas of the World Financial Center. Two and Four World Financial Center arecovered by insurance in place under the triple-net leases with Merrill Lynch. <strong>Brookfield</strong> <strong>Properties</strong>’ insurance claim adjustment process ison-going due to the complexity of the issues involved. However, <strong>Brookfield</strong> <strong>Properties</strong> anticipates recovery of all material amountsrelating to the restoration and business interruption costs of its properties. As at December 31, <strong>2005</strong>, the balance of these claimsamounted to approximately $30 million and is expected to be received in its entirety in 2006.One Liberty Plaza and Four World Financial Center reopened in October 2001 and One and Two World Financial Center reopened in thefirst quarter of 2002. No material lease cancellations in the New York portfolio occurred as a result of the events of September 11.<strong>Brookfield</strong> <strong>Properties</strong> has insurance covering certain acts of terrorism for up to $500 million of damage and business interruption costs.<strong>Brookfield</strong> <strong>Properties</strong> continues to seek additional coverage equal to the full replacement cost of its assets; however, until this type ofcoverage becomes commercially available on an economically reasonable basis, any damage or business interruption costs as a result ofuninsured acts of terrorism could result in a material cost to the company. <strong>Brookfield</strong> <strong>Properties</strong> believes it is in compliance with all of itsloan covenants, despite not being able to acquire terrorism coverage for the full replacement cost of all of the company’s properties.NOTE 23: OTHER INFORMATION(a) At December 31, <strong>2005</strong>, the company had foreign exchange contracts to sell a notional amount of C$660 million at a weighted averageexchange rate of C$1.00 = US$0.86, maturing in March 2006, designated as hedges for accounting purposes to manage the company’sforeign exchange risk in respect to its Canadian-denominated net investments. The fair value of these contracts at December 31, <strong>2005</strong>was a loss of $1 million which is reflected in the cumulative translation adjustment account and in accounts payable and other liabilitiesin the consolidated balance sheet. The company’s self-sustaining subsidiaries also had foreign exchange contracts to sell a notionalamount of US$77 million at a weighted average exchange rate of US$1.00 = C$1.16, maturing in January 2006, which have not beendesignated as hedges for financial reporting purposes. The aggregate fair value of these contracts at December 31, <strong>2005</strong> was a gain of$0.3 million, which is reflected in interest and other income in the consolidated statement of income with a corresponding asset inreceivables and other in the consolidated balance sheet.(b) As at December 31, <strong>2005</strong>, <strong>Brookfield</strong> <strong>Properties</strong> had approximately $397 million (December 31, 2004 - $216 million) of indebtednessoutstanding to <strong>Brookfield</strong> Asset Management Inc. and its affiliate, $172 million of which is included in the company’s capital securitiesand the remainder of the indebtedness balance is included in the company’s commercial property debt. Interest expense related to thisindebtedness, including preferred share dividends reclassified to interest expense as discussed in Note 2, totaled $12 million for the yearended December 31, <strong>2005</strong> compared to $11 million for the same period in 2004, and were recorded at the exchange amount.(c) Included in rental revenues are amounts received from the company’s parent company, <strong>Brookfield</strong> Asset Management Inc., and itsaffiliates of $5 million (2004 - $5 million). These amounts have been recorded at the exchange amount.76
(d) The financial assets of the company are generally short-term floating rate loans receivable of a trade nature. At December 31, <strong>2005</strong>,the fair value of mortgages receivable exceeded their book value by $1 million (2004 - $1 million). The fair value of mortgages and loanspayable is determined by references to current market rates for debt with similar terms and risks. As at December 31, <strong>2005</strong>, the fair valueof advances, commercial property debt and other loans payable exceeds the book value of these obligations by $201 million (2004 - $196million).(e) Supplemental cashflow informationYears ended December 31 (Millions) <strong>2005</strong> 2004Acquisitions of real estate $ (653) $ (359)Mortgages and other balances assumed on acquisition 287 152Net acquisitions $ (366) $ (207)Dispositions of real estate $ 19 $ 99Mortgages assumed by purchasers (12) (36)Net dispositions $ 7 $ 63Cash taxes paid $ 9 $ 7Cash interest paid (excluding dividends paid on capital securities) $ 265 $ 273(f) The assets and liabilities of certain of the company’s subsidiaries are neither available to pay debts of, nor constitute legal obligationsof the parent or other subsidiaries, respectively.(g) In <strong>2005</strong>, the company recorded amortization of deferred financing costs of $12 million in depreciation and amortization expense.NOTE 24: SUBSEQUENT EVENTSSubsequent to December 31, <strong>2005</strong>, the company completed the acquisition of One Bethesda Center in the Washington, D.C.metropolitan area for $69 million. The acquisition closed in January 2006. One Bethesda Center is a 168,000 square foot office propertylocated in Bethesda, Maryland.In February 2006, the company signed a definitive agreement with Commercial Net Lease Realty, Inc. to buy its office property located inthe Pentagon City submarket of the Washington, D.C. metropolitan area for $235 million. The transaction is expected to be completedin April 2006.77
NOTE 25: SEGMENTED INFORMATIONThe company and its subsidiaries operate in the United States and Canada within the commercial property business and the residentialdevelopment business. The following summary presents segmented financial information for the company’s principal areas of business:CommercialUnited StatesCanadaResidentialDevelopmentCommercial(Millions) <strong>2005</strong> 2004 <strong>2005</strong> 2004 <strong>2005</strong> 2004 <strong>2005</strong> 2004Assets<strong>Properties</strong> $ 5,318 $ 5,224 $ 2,336 $ 1,730 $ 391 $ 317 $ 8,045 $ 7,271Receivables and other 407 339 375 316 173 84 955 739Restricted cash and deposits 314 297 2 ⎯ ⎯ ⎯ 316 297Marketable securities ⎯ 285 58 ⎯ ⎯ ⎯ 58 285Cash and cash equivalents 33 49 25 59 6 4 64 112Assets related to discontinued operations 75 96 ⎯ ⎯ ⎯ ⎯ 75 96Total $ 6,147 $ 6,290 $ 2,796 $ 2,105 $ 570 $ 405 $ 9,513 $ 8,800The carrying amounts of properties located in the United States and Canada at December 31, <strong>2005</strong> were $5,368 million and $2,677million, respectively (2004 - $5,281 million and $1,990 million, respectively).CommercialUnited StatesCanadaResidentialDevelopmentTotal(Millions) <strong>2005</strong> 2004 <strong>2005</strong> 2004 <strong>2005</strong> 2004 <strong>2005</strong> 2004Revenues $ 787 $ 752 $ 316 $ 301 $ 389 $ 261 $ 1,492 $ 1,314Lease termination income ⎯ 60 ⎯ ⎯ ⎯ ⎯ ⎯ 60Expenses 292 253 131 129 283 219 706 601495 559 185 172 106 42 786 773Other revenues 6 14 27 33 4 ⎯ 37 47Net operating income from continuingoperations 501 573 212 205 110 42 823 820Interest expense 231 243 99 61 ⎯ ⎯ 330 304General and administrative 26 20 22 21 ⎯ ⎯ 48 41Non-controlling interests expense ⎯ 4 16 16 ⎯ ⎯ 16 20Income before undernoted 244 306 75 107 110 42 429 455Depreciation and amortization 126 98 37 42 ⎯ ⎯ 163 140Income before unallocated costs 118 208 38 65 110 42 266 315Unrealized foreign exchange on preferredshare restatement ⎯ 63Future income taxes and other provisions 103 116Net income from continuing operations $ 163 $ 136Discontinued operations 1 2Net income $ 164 $ 138Acquisitions of real estate, net $ ⎯ $ 124 $ 254 $ 83 $ ⎯ $ ⎯ $ 254 $ 207Dispositions of real estate, net (7) (31) ⎯ (32) ⎯ ⎯ (7) (63)Commercial property tenant improvements 108 69 15 13 ⎯ ⎯ 123 82Development and redevelopment 41 51 9 4 ⎯ ⎯ 50 55Capital expenditures 8 13 13 13 ⎯ ⎯ 21 26Total revenues earned in the United States and Canada for the year ended December 31, <strong>2005</strong> were $821 million and $708 million,respectively (2004 - $845 million and $576 million, respectively).78
Selected Financial InformationDecember 31 (US Millions, except per share information) <strong>2005</strong> 2004 2003 2002 2001Financial results (1)Commercial property net operating income $ 680 $ 671 $ 586 $ 589 $ 606Funds from operations 435 403 343 314 279Net income 164 138 232 236 202Total assets 9,513 8,800 8,382 7,450 7,419Shareholders’ equity 1,943 1,992 1,938 2,093 1,944Per diluted common share (1)Common shares outstanding 231.2 233.4 234.3 240.6 242.6Fully diluted shares outstanding 235.9 238.1 239.4 245.9 247.7Funds from operations and gains $ 1.85 $ 1.95 $ 1.85 $ 1.45 $ 1.28Funds from operations excluding straight line rent,lease termination income and gains 1.85 1.70 1.43 1.25 1.09Net income 0.69 0.58 0.96 0.89 0.75Dividends paid 0.65 0.42 0.34 (2) 0.28 0.23Shareholders’ equity – book value 8.35 8.41 8.12 7.38 6.85Common share price at year end 29.42 24.93 19.13 18.20 15.45Operating data—Commercial propertiesNumber of properties and development sites 76 46 48 50 50Rentable area (millions of sq. ft.) 56 46 46 46 45Effective interest (millions of sq. ft.) 37 35 36 35 37Average occupancy (%) 94.6 92.7 94.1 95.5 97.3(1)Excludes the assets, liabilities and results of operations of <strong>Brookfield</strong> Homes Corporation(2)Excludes the distribution of <strong>Brookfield</strong> Homes Corporation79
Strengthening Corporate Governance<strong>Brookfield</strong> <strong>Properties</strong>’ board of directors is strongly committed to sound corporate governance practices. The board continuously reviewsits corporate governance policies and benchmarks them against evolving legislation and acknowledged leaders in the area. During <strong>2005</strong>,the company advanced a number of initiatives to further improve its corporate governance practices, the most significant of which is thatinvestors are now represented by a majority of independent directors on the board.Governance Policies<strong>Brookfield</strong> <strong>Properties</strong>’ shareholder-friendly corporate governance policies include:• The board has a majority of independent directors and a lead independent director• The full board is elected annually; shareholders have cumulative voting rights in director elections• The company does not have a poison pill in place• The company expenses stock option grants on its income statement• The positions of CEO and Chairman are separated• The company has publicly-disclosed board guidelines• Outside directors meet without the CEO or management present• The audit committee is comprised solely of independent directorsNYSE RulesThe charters for the board of directors and each of the standing committees are in compliance with New York Stock Exchange rules oncorporate governance, the provisions of the Sarbanes-Oxley Act of 2002 and Canadian securities laws. <strong>Brookfield</strong> <strong>Properties</strong>, a Canadiancompany, has chosen to comply with NYSE rules as they apply to U.S. domestic companies and we have filed with the New York StockExchange the most recent <strong>Annual</strong> CEO Certification as required by section 303A.12(a) of the NYSE Listed Company Manual. However,the company has elected to rely on an exemption from the NYSE rules with respect to certain independence requirements for some ofits committees. The board believes that it has an appropriate mix of directors on its committees to effectively oversee the business planand management’s performance.The board endeavors to maintain a watchful eye on governance developments as the regulatory and business climates continue toevolve, and to adopt measures as appropriate in order to ensure that the company’s commitment to good corporate governance remainseffective and strong.Committee MembershipAudit Committee Governance & Nominating Committee Human Resources & Compensation CommitteePaul D. McFarlane, ChairWilliam T. CahillAllan S. OlsonRobert L. StelzlAllan S. Olson, ChairWilliam T. CahillRoderick D. FraserSamuel P.S. PollockJack L. Cockwell, ChairPaul D. McFarlaneWilliam C. Wheaton81
Board of DirectorsGordon E. ArnellLondon, United KingdomChairman<strong>Brookfield</strong> <strong>Properties</strong> CorporationChairman of <strong>Brookfield</strong> since 1989;President and CEO of <strong>Brookfield</strong>’spredecessor, Carena Developments Ltd., foreleven years; senior executive roles atOxford Development Group Ltd. and TrizecCorporation Ltd.William T. CahillRidgefield, ConnecticutSenior Credit OfficerCitibank Community DevelopmentCurrent position since 2002. Previouspositions include Managing Director,Citigroup Real Estate, OREO 1996–2002and Senior Asset Manager 1991–1996.Vice President and Senior Asset Manager,Mellon Real Estate Investment Advisors Inc.,1983–1991.Richard B. ClarkNew York, New YorkPresident and CEO<strong>Brookfield</strong> <strong>Properties</strong> CorporationCurrent position since 2002; Presidentand CEO of U.S. operations 2000–2002;senior positions for <strong>Brookfield</strong> <strong>Properties</strong>predecessor companies including COO,EVP and Director of Leasing. Chairman,Real Estate Roundtable Tax Policy AdvisoryCommittee; Member, NAREIT and REBNYBoard of Governors.Jack L. CockwellToronto, OntarioGroup Chairman<strong>Brookfield</strong> Asset Management Inc.Current position since 2002; President andCEO 1991–2001; senior executive ofpredecessor companies from 1969. Director,Astral Media Inc., Chairman, Board ofTrustees, Royal Ontario Museum andDirector, C.D. Howe Institute.J. Bruce FlattToronto, OntarioPresident and CEO<strong>Brookfield</strong> Asset Management Inc.Current position since 2002;President and CEO of <strong>Brookfield</strong><strong>Properties</strong> Corporation 2000–2001;President and COO 1995–2000;other senior management positionsfrom 1992.Roderick D. Fraser, Ph.D., O.C.Edmonton, AlbertaPresident EmeritusUniversity of AlbertaPresident and Vice-Chancellor, Universityof Alberta 1995-<strong>2005</strong>; Dean of the Facultyof Arts and Science and Vice-Principal(Resources), Queen’s University, Kingston.Officer of the Order of Canada. Director,Canada-U.S. Fulbright Program and theAga Khan University.Paul D. McFarlaneMississauga, OntarioCorporate DirectorRetired from CIBC in 2002 after morethan 40 years’ service in numerousbranch, regional and head office positions,most recently as Senior Vice President,Special Loans, Head Office, from 1994until retirement.Allan S. OlsonEdmonton, AlbertaPresident and CEOFirst Industries CorporationCurrent position since 1991. President andCEO, Churchill Corp. 1989–1990 andBanister Construction Group 1990–1991.Various positions at Stuart OlsonConstruction including President and CEO1965–1989. Chairman, Summit REIT andDirector, Ipsco Steel.82
Samuel P.S. Pollock, O.C.Toronto, OntarioPresident of 96345 Canada Inc.Chairman, Toronto Blue Jays 1995–2000; Chairman, John Labatt Ltd.1991–1995; President, Carena Investments1978–1991; Vice President and GeneralManager, Montreal Canadiens 1964–1978.Officer, Order of Canada and Member,Order of Quebec. Inducted to Hockey Hallof Fame and Canadian Sports Hall ofFame. Named Great Montrealer in 1978.Linda RabbittBethesda, MarylandCEO, Founder and ChairmanRand Construction CorporationCurrent position since 1989. ExecutiveVice President, co-founder and co-ownerHart Construction Co., 1985-1989.Director, Washington Performing ArtsSociety, Greater Washington Board ofTrade and Watson Wyatt & Co. Holdings.Trustee, George Washington Universityand Federal City Council.Robert L. StelzlLos Angeles, CaliforniaRetired from Colony Capital after 14years of service as principal and member ofthe investment committee. President, BrenInvestment <strong>Properties</strong> 1982-1989; seniormanagement positions with severalinternational real estate companiesincluding Cadillac Fairview and Cabot,Cabot and Forbes. Former Chairman,Aman Hotels.William C. Wheaton, Ph.D.Hamilton, MassachusettsProfessor of EconomicsMassachusetts Institute of TechnologyFounder and former director MIT Center forReal Estate, 1992-<strong>2005</strong>; MIT faculty membersince 1972. Founder and Principal, TortoWheaton Research. Co-author, UrbanEconomics and the Real Estate Markets (1996).John E. ZuccottiNew York, New YorkCo-Chairman<strong>Brookfield</strong> <strong>Properties</strong> CorporationCurrent position since 1997. Chairman,Real Estate Board of New York since 2004;Senior Counsel, Weil, Gotshal and Mangessince 1998; President and CEO, Olympia &York Companies U.S.A. 1990–1996;Partner, Brown & Wood 1986–1990 andTufo & Zuccotti 1978–1986. First DeputyMayor of the City of New York 1975–1977.Chairman, New York City PlanningCommission 1973–1975. Trustee Emeritus,Columbia University.83
OfficersCHAIRMENGordon E. ArnellChairmanJohn E. ZuccottiCo-ChairmanCORPORATERichard B. ClarkPresident and Chief Executive OfficerG. Mark BrownSenior Vice President, FinanceKathleen G. KaneSenior Vice President and GeneralCounsel and SecretaryCraig J. LaurieSenior Vice President andChief Financial OfficerMelissa J. ColeyVice President, Investor Relations andCommunicationsRael L. DiamondVice President and ControllerP. Keith HydeVice President, TaxationStephanie A. SchembariVice President, Human ResourcesMichael P. SullivanVice President, Risk ManagementGordon E. WiddesVice President, Information TechnologiesPROPERTY OPERATIONSUNITED STATESDennis H. FriedrichPresident and Chief Operating OfficerLawrence F. GrahamExecutive Vice President, DevelopmentEdward F. BeisnerSenior Vice President and ControllerJames E. HedgesSenior Vice President, Acquisitions andDispositionsDaniel M. KindberghSenior Vice President, OperationsJeremiah B. LarkinSenior Vice President, Director of LeasingDavid SternbergSenior Vice President, Midwest and MountainRegionBrett M. FoxVice President and Associate CounselAndrew W. OsborneVice President, Acquisitions and DispositionsCANADAThomas F. FarleyPresident and Chief Operating OfficerPhilip H. MostowichExecutive Vice President, DevelopmentRobert K. MacNicolSenior Vice President, Office Leasing, EasternIan D. ParkerSenior Vice President, Asset Management,WesternDeborah R. RogersSenior Vice President, Legal, EasternT. Jan SuchardaSenior Vice President, InvestmentsT. Nga TrinhSenior Vice President and ControllerN. Dwight JackVice President, Office Leasing, WesternRESIDENTIAL OPERATIONSAlan NorrisPresident and Chief Executive Officer84
<strong>Brookfield</strong> <strong>Properties</strong> Corporate InformationHead OfficeThree World Financial Center200 Vesey Street, 11th FloorNew York, New York 10281Tel: 212.417.7000Fax: 212.417.7214BCE Place181 Bay Street, Suite 330Toronto, Ontario M5J 2T3Tel: 416.369.2300Fax: 416.369.2301Transfer AgentCIBC Mellon Trust CompanyP.O. Box 7010, Adelaide Street Postal StationToronto, Ontario M5C 2W9Tel: 416.643.5500 or 800.387.0825Fax: 416.643.5501Web site: www.cibcmellon.comE-mail: inquiries@cibcmellon.comStock Exchange ListingsStock Symbol Exchange Record Date Payment DateCommon shares BPO NYSE, TSX First day of March, June, Last business day ofSeptember and December March, June,September and DecemberClass A Preferred SharesSeries A Not listed — First day of March and 15th day of March andSeries B Not listed — September SeptemberClass AA Preferred SharesSeries E Not listed — 15th day of March, June, Last business day ofSeptember and December March, June,September and DecemberClass AAA Preferred SharesSeries F BPO.PR.F TSX 15th day of March, June, Last business day ofSeries G BPO.PR.U TSX September and December March, June,Series H BPO.PR.H TSX September and DecemberSeries I BPO.PR.I TSXSeries J BPO.PR.J TSXSeries K BPO.PR.K TSXShareholder Information www.brookfieldproperties.com<strong>Brookfield</strong> <strong>Properties</strong> welcomes inquiries from shareholders, analysts, media representatives and other interested parties. Questionsrelating to investor relations or media inquiries can be directed to Melissa Coley, Vice President, Investor Relations at (212) 417-7215 orvia e-mail at mcoley@brookfieldproperties.com. Inquiries regarding financial results should be directed to Craig Laurie, Senior VicePresident and Chief Financial Officer at (212) 417-7040 or via e-mail at claurie@brookfieldproperties.com.Shareholder questions relating to dividends, address changes and share certificates should be directed to the company’s Transfer Agent,CIBC Mellon Trust, as listed above.<strong>Annual</strong> General MeetingThe <strong>Annual</strong> General Meeting of shareholders will be held in New York at Three World Financial Center, 26th floor at 10 a.m. on Wednesday,April 26, 2006. Shareholders may also participate in the meeting by webcast through <strong>Brookfield</strong> <strong>Properties</strong>’ Website at www.brookfieldproperties.com.Printed on recycled paper