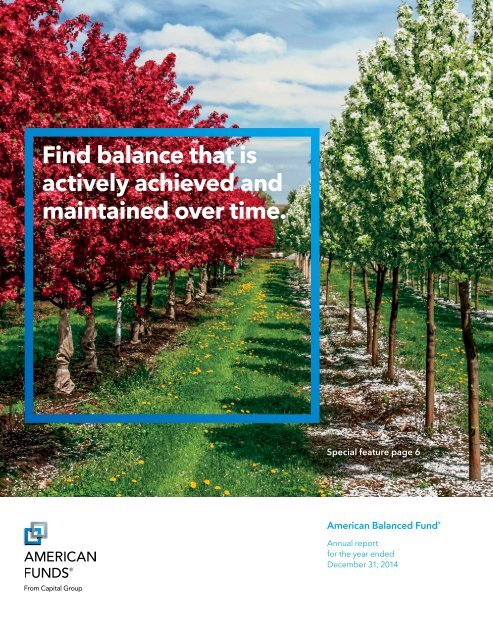
Annual Report - American Balanced Fund - American Funds
Annual Report - American Balanced Fund - American Funds
Annual Report - American Balanced Fund - American Funds

Create successful ePaper yourself
Turn your PDF publications into a flip-book with our unique Google optimized e-Paper software.
Special feature6 We take an active hand inmaintaining a balance ofgrowth and stability.Contents1 Letter to investors4 The value of a long-termperspective12 Summary investment portfolio16 Financial statements35 Board of trustees and otherofficersFellow investors:In a market environment that favoredequities over fixed-income securities,<strong>American</strong> <strong>Balanced</strong> <strong>Fund</strong> gained 8.85%for the 12-month period endedDecember 31, 2014, exceeding the 7.21%return of the Lipper <strong>Balanced</strong> <strong>Fund</strong>sIndex. <strong>American</strong> <strong>Balanced</strong> <strong>Fund</strong>’s returnsfor the past three-, five- and 10-yearperiods were 14.80%, 12.17% and 6.97%— all outpacing the Lipper index returnsof 11.78%, 9.50% and 6.01%, respectively.Looking at the bigger, long-term picture,over the near-40 years that CapitalResearch and Management Companyhas managed the fund, <strong>American</strong><strong>Balanced</strong> <strong>Fund</strong> realized an averageannual total return of 10.94%, comparedwith 10.07% for the Lipper index.In short, fund investors seeking toincrease their wealth — prudently, overtime, through a balanced approach —historically have been rewarded as thefund has invested primarily in blue-chipequities and investment-grade (ratedBBB/Baa and above) fixed-incomesecurities with a U.S. emphasis.For many investors, their introduction to<strong>American</strong> <strong>Balanced</strong> <strong>Fund</strong> has beenthrough their employer’s retirement plan.In 2014, the fund continued to help<strong>American</strong>s prepare for retirement as oneof the most widely used balanced fundsin defined benefit 401(k)s, with over$16.3 billion in participant contributions,according to Pensions & Investments(September 2014).2014 market reviewThe U.S. economy started the year onshaky ground, due to an unusually harshwinter. As temperatures rose, the equitymarkets picked up steam — soon atrecord-breaking levels — extending oneof the longest-running bull markets inhistory. The unmanaged Standard &Poor’s 500 Composite Index climbedabove 2,000 for the first time ever, as itgained 13.66% for the year, withdividends reinvested. The Dow JonesIndustrial Average surpassed the 18,000mark during the year and ended 2014with a 10.02% annual gain, withdividends reinvested.Investors, it seems, were encouraged bythe U.S. economy’s gradual improvement,high corporate profits and attractivestock valuations compared to fixedincomesecurities.Uncertainty about interest rates andhow they would affect investments hadinvestors taking a cautious approach tofixed-income markets through much of2014. Month after month, many investorsexpected rates to go up but, in fact, theycontinued to do the exact opposite. Thiscan be attributed to economic weaknessin the rest of the world, rising geopoliticalrisks and a lower-than-anticipated level ofinflation. Finally, in mid-December, theFed shifted its position on the timing offuture interest rate hikes. That day, therewas a 288-point gain (+1.69%) in the DowJones Industrial Average. The next day,the Dow was up 421 points (+2.43%), itsbest day of the year.Despite concerns investors may haveabout interest rates, a sound fixedincomeinvestment strategy can providecurrent income and potentially mitigatevolatility associated with equity investing.Furthermore, the very strong U.S. equity<strong>American</strong> <strong>Balanced</strong> <strong>Fund</strong> 1
We’ve made a consciouseffort to adjust the equityportion of <strong>American</strong><strong>Balanced</strong> <strong>Fund</strong> from 74%,where it started the year,to 67% to help protectgains our investors wereable to make in 2014.results of the past few years and theassociated rise in valuations argues for amore cautious equity investment position.To that end, we’ve made a consciouseffort to adjust the equity portion of<strong>American</strong> <strong>Balanced</strong> <strong>Fund</strong> from 74%,where it started the year, to 67%, andincrease the fixed-income allocation from23% to 28%. Our goal is to help ourinvestors protect gains they were able tomake during the year in 2014. (To learnmore about balanced investing, read thespecial feature beginning on page 6.)AMBAL portfolio highlightsMost sectors of the S&P 500 advanced in2014, led by a 28.98% rise in utilities.Health care and information technologyrose at notable rates, gaining 25.34%and 20.12%, respectively. But energystocks, hurt by plunging crude oil pricesin the second half of the year, lost 7.78%.AMBAL’s lower-than-index position inenergy companies proved positive forrelative results, and careful investmentselection further helped to lift returns.Similarly, having fewer investments intelecommunication services companieswas additive to the fund’s relative returns.Boeing (–4.77%). On the plus side,Lockheed Martin (+29.54%) andMicrosoft (+24.10%) buoyed results (seepages 10 and 11, respectively). Wecontinue to be enthusiastic about all fourof these securities on a long-term basis.Moving forward, the overall mix of thefund’s portfolio has been adjusted to bemore defensive. We’ve increased ourinvestment in more defensive sectorssuch as consumer staples. Fixed incomehas also been increased, so U.S.Treasury, U.S. agency and agency passthroughsecurities, as well as other highqualitymortgage and investment-gradecorporate bonds, will play an importantrole for our investors, helping to provideincome and mitigating volatility. And thefund’s level of cash is higher as well.Thank you for your supportWe welcome our many new shareholdersto the fund and assure all of our investorsthat we will continue to follow ourprudent, research-driven approach toinvesting that has characterized<strong>American</strong> <strong>Balanced</strong> <strong>Fund</strong> for almost 40years. We look forward to reporting toyou again in six months’ time.While health care companies outpacedthe broader market, AMBAL’s smallerposition dampened returns and becameone of the fund’s largest detractors. Anotable bright spot in our health careinvestment strategy was UnitedHealthGroup (+34.25%), which served as oneof the fund’s top 10 contributors for2014. (See page 11 for more informationabout UnitedHealth.)Two stocks that have helped the fundin the past but detracted from resultsin 2014 were Amazon (–22.18%) andSincerely,Gregory D. JohnsonVice Chairman of the Boardand PresidentFebruary 10, 2015For current information about the fund,visit americanfunds.com.2 <strong>American</strong> <strong>Balanced</strong> <strong>Fund</strong>
The value of along-term perspective<strong>Fund</strong> results shown are for Class Ashares and reflect deduction of themaximum sales charge of 5.75% onthe $10,000 investment.¹ Thus, thenet amount invested was $9,425. 2Results are for past periods and arenot predictive of results for futureperiods. Current and future resultsmay be lower or higher than thoseshown. Share prices and returns willvary, so investors may lose money.For current information and monthendresults, visit americanfunds.com.The results shown are before taxes on funddistributions and sale of fund shares.1As outlined in the prospectus, the salescharge is reduced for accounts (andaggregated investments) of $25,000 ormore and is eliminated for purchases of$1 million or more. There is no salescharge on dividends or capital gaindistributions that are reinvested inadditional shares.2The maximum initial sales charge was8.50% prior to July 1, 1988.3The market indexes are unmanaged and,therefore, have no expenses. Investorscannot invest directly in an index.4Results of the Lipper <strong>Balanced</strong> <strong>Fund</strong>s Indexdo not reflect any sales charges.5Barclays U.S. Aggregate Index representsthe U.S. investment-grade fixed-rate bondmarket. For the period July 31, 1975, toDecember 1, 1975, Barclays Government/Credit Bond Index was used.6For the period July 26, 1975 (when CapitalResearch and Management Companybecame the fund’s investment adviser)through December 31, 1975.$1,000,000400,000200,000100,00040,00020,00010,000Average annual total returns based on a $1,000 investment(for periods ended December 31, 2014)*1 year 5 years 10 yearsClass A shares 2.59% 10.84% 6.34%* Assumes reinvestment of all distributions and payment of themaximum 5.75% sales charge.The total annual fund operating expense ratio is 0.59% for Class Ashares as of the prospectus dated March 1, 2015 (unaudited).Investment results assume all distributions are reinvested and re flectapplicable fees and expenses. When applicable, investment resultsreflect fee waivers, without which results would have been lower. Visitamericanfunds.com for more information.8,000Year ended December 31 1975 6 1976 1977 1978 1979 1980 1981 1982 1983 1984 1985 1986 1987TOTAL VALUE (dollars in thousands)Dividends reinvested $0.3 0.6 0.7 0.7 0.8 1.1 1.3 1.5 1.7 1.9 1.9 2.2 2.7Value at year-end $9.9 12.5 12.6 13.4 14.4 16.5 17.2 22.3 25.9 28.3 36.5 42.7 44.4AMBAL total return (0.5)% 26.0 0.7 6.2 7.6 14.4 4.4 29.4 16.1 9.4 29.1 16.9 4.04 <strong>American</strong> <strong>Balanced</strong> <strong>Fund</strong>
We take an active hand in maintaininga balance of growth and stability.6 <strong>American</strong> <strong>Balanced</strong> <strong>Fund</strong>
Greg JohnsonPortfolio ManagerHilda ApplbaumPortfolio ManagerJim MulallyPortfolio ManagerBalance. We can see it innature. Many of us seek itin our everyday lives. Andinvestment professionalsstress its importance as wepursue our long-termfinancial goals.But when it comes tothe right mix of investments,balance isn’t so muchfound as created. Andonce achieved, it must bemaintained. The portfoliomanagers and analysts of<strong>American</strong> <strong>Balanced</strong> <strong>Fund</strong>(AMBAL) are dedicatedto this task.The role of balanced investing“Our job is to help investors growtheir wealth and generate incomewithout keeping them up all nightworrying about volatility,” says GregJohnson, president and portfoliomanager of AMBAL.<strong>Balanced</strong> funds, like AMBAL, combineequity and fixed-income securitiesto enable investors to mitigatedownside risk while still being ableto take advantage of some upsidemarket potential. By nature, balancedfunds typically lag pure equity fundsin a sharply rising market but tendto hold up better during a decline.The concept of balanced investingisn’t new. The potential benefits ofthis strategy probably first becameclear when the stock market crashof 1929 wiped out 89% of stockmarket value, as measured by theDow Jones Industrial Averageexcluding dividends. Over the years,the popularity of balanced funds hasgrown as more and more investorshave sought relative safety in additionto growth.AMBAL can serve as a completeinvestment program for an investor.It may be particularly attractive tothose who don’t keep up with themarkets and aren’t sure how to createa balanced investment strategy ontheir own. Older investors nearingretirement may find some peaceof mind from a conservative approachdesigned to help them preservetheir hard-earned nest eggs whileseeking growth to last through theirgolden years.Why investors choose AMBAL“AMBAL has proven over time to bean investment vehicle for all seasons,”says Greg.The fund’s objectives — conservation ofcapital, current income and long-termgrowth of capital and income — maynot be so different from other balancedfunds. It’s in the execution of these goalsthat AMBAL can be distinguished.Investors should start by asking “Whatexactly does ‘balanced’ mean?“ suggestsGreg. “At <strong>American</strong> <strong>Fund</strong>s, balance is notonly the allocation between equity andfixed income, though that’s obviouslyone piece of it. To us, balance is alsostrategic diversification of investmentsin both areas.”Portfolio Manager Hilda Applbaumadds, “Diversification isn’t necessarilyabout the number of securities youinvest in. You can hold hundredsof stocks and not be diversified ifthey’re all basically doing the samething. True diversification requiresdifferent ideas working together withinthe fund.” In AMBAL, these ideasare introduced through a diversifiedteam of investment professionalswith different backgrounds, eachowning their best ideas. The fundoperates in a research-drivenenvironment that enables theseportfolio managers and analysts toidentify investment opportunitiesand manage risk.<strong>American</strong> <strong>Balanced</strong> <strong>Fund</strong> 7
AMBAL’s asset allocation in actionAMBAL’s balance of equity and fixed-income investments can be re-alignedto more effectively pursue the fund’s objectives. “If you look at the fund’sallocation over time,” suggests Portfolio Manager Jim Mulally, “you’ll seethat it adjusts to economic and market conditions — not in a daily, tacticalway but as a strategic mix.” Consider these two different points in history:1999: Potentially overvalued market 2013: Strong market growthWall Street closed its books on acentury of unprecedented growthwith the Dow Jones IndustrialAverage, the Nasdaq CompositeIndex and Standard & Poor’s 500Composite Index reaching recordhighs. Already concerned about thesustainability of high stock valuations,AMBAL’s portfolio managers kept thefund’s portfolio close to the levelsthey had set in 1996 — ending the yearjust 57% in equities (with 34% in fixedincome and 9% in cash).9% 3%Five years after a devastating crash,the equity market had not onlyrecovered, it rewarded those whoremained invested with substantialgrowth. The Dow and the S&P 500posted their largest gains since thelate 1990s. The Nasdaq rose almost40% to levels it hadn’t reached since2000. In order to help investorstake advantage of the strong 2013market, AMBAL maintained an equityallocation over 70%, ending the yearalmost 74% invested in equities (23%in fixed income and 3% in cash).23%Two keys to AMBAL’s success are itsasset allocation strategy and time-testedinvestment process called The CapitalSystem ṢMAMBAL’s dynamic asset allocationstrategyMany balanced funds available todayremain at a target asset allocation ofapproximately 60% equities and 40%fixed-income securities, regardless ofmarket environment.In contrast, AMBAL seeks a betterbalance at any given point in timethrough built-in flexibility. “By design,”explains Greg, “equities can accountfor as much as 75% and no less than 50%of the AMBAL portfolio. Sometimes,we’ve found that 65% in equities and35% in fixed-income and cash is wherewe need to be to effectively pursue thefund’s objectives. There are, however,times when it may be more prudent tomove that allocation to one extreme orthe other.”34%57%74%According to Greg, “There are anumber of factors we consider as weassess where AMBAL should be in termsof asset allocation, including equityvaluations, the term structure of interestrates and our fixed-income professionals’forecasts on the direction of rates.”Total equities Total fixed income Cash & equivalentsSource: Capital Group (as of December 31, 2013).A time-tested systemBalance can be a very personalconcept. <strong>American</strong> <strong>Fund</strong>s understandsthe value of individual perspectives,even within the structure of a commonobjective. In AMBAL, as with all of the<strong>American</strong> <strong>Fund</strong>s, a combination of8 <strong>American</strong> <strong>Balanced</strong> <strong>Fund</strong>
John SmetPortfolio ManagerWesley PhoaPortfolio ManagerAndy BarthPortfolio Managerindependence and teamwork definesThe Capital System — a process thathas, over time, benefited investors asit has enabled each of the portfoliomanagers and analysts to invest intheir strongest convictions. Blendedtogether, these holdings create a broadlydiversified portfolio of equity and fixedincomesecurities that the team believesare most likely to succeed.“This philosophy,” says Portfolio ManagerWesley Phoa, “has been tried andtested for decades through many, manydifferent market environments. So whenyou invest in AMBAL, you’re not puttingyour money into something that hasworked well for three or five years. Thisinvestment philosophy was working longago, when the world was totally differentfrom the way it is today. We’re confidentthat it can continue to work over thenext 20 years and beyond, as the worldcontinues to change.”Research is the backbone of TheCapital System. “The amount of deep,fundamental research that goesinto every one of the investments inAMBAL is extraordinarily rigorous,”says Justin Toner, investment analystand coordinator of AMBAL’s researchportfolio. Each of the 23 investmentanalysts in the research portfolio studyindividual industries and companies indepth — actually visiting these companiesin person and meeting with companyexecutives, employees, suppliers,customers and even competitors.Portfolio managers tap this knowledgewhen making investment decisions ontheir portion of the overall fund portfolio.Additionally, AMBAL’s investmentanalysts, led by Justin, use the researchportfolio to invest a portion of the fundbased on the sectors they cover. The goalis to own a stock, for example, alongsideone of the portfolio managers in thefund, although that’s not a requirement.“As coordinator of the researchportfolio, I keep track of what theanalysts are recommending and theirlevel of conviction for each investment,”explains Justin. “If I have an analystwho wants to buy a stock but forsome reason didn’t get a portfoliomanager to buy it with them, I mightHow the fund is managedPortfolio managerstypically encourage them to makea larger investment so that it canhave a meaningful impact on theoverall fund.”It’s all about balanceDeep fundamental research. A dynamicasset allocation strategy that hashistorically added to the fund. And aprocess for investing that has stoodthe test of time. “It’s all about balance,”says Portfolio Manager Andy Barth.“The structure of AMBAL gives us theflexibility to do what we believe is rightfor our investors.” nAMBAL’s 10 portfolio managers have an average of 30 years of investmentexperience.* The knowledge and wisdom they have accumulated over the yearshave helped them manage your fund through many different stock market cycles.Hilda L. ApplbaumAndrew F. BarthAlan N. BerroGregory D. JohnsonJeffrey T. LagerInvestment analysts28 years30 years29 years21 years20 yearsJames R. MulallyDina N. PerryWesley K.-S. PhoaJohn H. SmetEugene P. Stein39 years37 years21 years33 years44 yearsThe analysts invest in their strongest convictions through the research portfolio,which is coordinated by Justin Toner.* List of investment professionals and their years of experience are as of the prospectus datedMarch 1, 2015 (unaudited).<strong>American</strong> <strong>Balanced</strong> <strong>Fund</strong> 9
A closer look at thefixed-income portfolioInside the research portfolio:In 2008, there were few safe harbors forinvestors. In the fixed-income market,many were surprised at the volatilityof high-grade corporate bonds. OnlyTreasuries did well.“Since then, the fixed-income markethas become even more complex,” saysPortfolio Manager John Smet. “Moreinstruments are available and the numberof players, including non-U.S. investors,has grown dramatically.”To effectively cover this market, AMBAL hasfive fixed-income portfolio managers. JohnSmet, Jim Mulally and Hilda Applbaumare generalists who buy U.S. Treasurybonds, investment-grade bonds issuedby governments and corporations, andsecurities backed by home mortgages fromFannie Mae, Freddie Mac and Ginnie Mae.Wesley Phoa and Andy Barth together actas a fourth generalist manager; Wesleyfocuses on Treasuries, governmentagencies and mortgages, while Andyspecializes in credit securities, which areprimarily investment-grade corporatebonds (rated BBB/Baa and above).“One of the main things we all try toremember is that fixed income is meantto be a part of AMBAL that is stable andgenerates income. It’s an importantpart of the balance for our investors,”describes Wesley.Research is a critical component oftheir efforts. Andy explains, “I think ourinvestors are fully aware of the strongresearch capability that Capital bringson the equity side. We’re doing that verysame thing in fixed income as well inorder to make informed decisions.”As part of that initiative, two groupswere introduced, post-2008, to betterleverage the power of The CapitalSystem of investing:Portfolio Strategy Group (PSG):“The PSG is a part of The CapitalSystem that’s unique to fixed income,”explains Jim. “It provides disciplineto the portfolio through top-downguidance, which helps us make moreconsistent investment decisions.”Specifically, the PSG establishesbroad, strategic parameters that actas a guide in the construction ofAMBAL’s fixed-income portfolio. It isthen up to the portfolio managers touse their own creativity within thoseguidelines. The overall goal of thePSG is to promote good investmentresults over full market cycles.Risk and Quantitative Solutions Group(RQS): This team of risk analysts areintegrated into Capital Group’s fixedincomeorganization to contributeto superior long-term investmentresults through rigorous disciplineand quantitative analysis based oncomputer modeling. A “virtual”portfolio of the fund’s holdings issubjected to a variety of simulationsdesigned to mirror the effects ofpotential economic scenarios andmarket movements over time. “Futurerisk is a big challenge for anyone inthe fixed-income market,” says John.“The simulation work done by RQS isan effective way to understand the riskin our portfolios.”Justin TonerSectorsU.S. Aerospace and defenseU.S. and Japanese automobilesWaste services (environmental services)Beyond coordinating the overall researchportfolio, Justin invests in three equitiesin AMBAL, including Lockheed Martin,one of the fund’s top industrial holdings.“This has been a large investment forus for many years, and we invested a lotmore in it fairly recently,” says Justin.“Lockheed Martin is an extremely wellmanaged,cash-generative company.And management returns that cash toshareholders through dividends andshare re-purchases.“It was an extremely cheap equity inearly 2013, when it looked like defensespending was going to be hit hard inWashington. But it’s often when sentimentis most negative that you have theopportunity to invest in a good companyat a great price. Even now, as it appearsdefense spending may rise again, albeitmodestly, the company remainsa reasonably valued investment.”10 <strong>American</strong> <strong>Balanced</strong> <strong>Fund</strong>
Four of our investment analysts describe the conviction behind a key AMBAL investment each holds.Diana Wagner Paul Benjamin Andrei MuresianuSectorsHealth care servicesSemi-conductor equipmentPaper and forest productsUnitedHealth Group is not only Diana’slargest holding, it represents one ofAMBAL’s top holdings in the healthcare sector.Diana explains, “Many worried thatthe Affordable Care Act (ACA) was agovernment takeover of health care, butI think it further promoted the role of theprivate sector. UnitedHealth is already,in many ways, enabling the country’shealth care agenda as the government’scontractor for the federal health insuranceexchange through its Optum subsidiary.Optum is now one-third of profits and alsosells services to help hospitals, doctors,employers and even other insurers adaptto the changing health care environment.“However, the biggest growth opportunityI see for UnitedHealth is the continuedprivatization of Medicare and Medicaid,which is still in the early stages.”SectorsInformation technology hardwareInformation technology softwareOne of Paul’s investments, Microsoft, isAMBAL’s largest holding. “We’ve beenbuilding our position in Microsoft in amaterial way, especially in 2013,” saysPaul. “The stock was downgraded, partlydue to weak investments in the consumerfranchise area — such as the Surface tablet,retail stores and Bing. But that’s only 20%of the picture.“The other 80% of the profits comesfrom a very healthy enterprise businessthat’s growing 8% to 10% a year.Today, Microsoft is the second-largestinfrastructure cloud vendor, after Amazon.As more people turn to these services,I feel confident that Microsoft is theone legacy IT company best positionedto succeed in the cloud — even moreso under the direction of new CEOSatya Nadella and new Chairman JohnThompson, whose background from IBMand Symantec should prove valuable toMicrosoft moving forward.”SectorsTelecommunicationsCable and satelliteTraditional U.S. mediaAndrei invests in Comcast, a top AMBALholding in the consumer discretionaryarea. “In addition to a steady cash flowfrom their core cable TV business, I wasattracted to Comcast’s position as aleader in broadband communications. Alot of <strong>American</strong>s are interested in gettingbroadband at home and upgrading thespeed of their service.“Another reason for my conviction isComcast’s acquisition of NBC/Universalfrom General Electric. This could enableComcast to become a very profitableintegrated media company with themeans to shape the evolution of themedia ecosystem, ranging from videoon-demandto dynamic addressableadvertising to out-of-home TV-everywhererights that can make their product mobileand customizable.”<strong>American</strong> <strong>Balanced</strong> <strong>Fund</strong> 11
Summary investment portfolio December 31, 2014 Percent of net assetsEquity securities 66.90%Bonds, notes & other debtinstruments 27.82%Short-term securities & other assets lessliabilities 5.28%Common stocks 66.90%SharesValue(000)Financials12.36%Wells Fargo & Co. 30,902,000 $1,694,048Berkshire Hathaway Inc., Class A 1 6,580 1,487,080JPMorgan Chase & Co. 20,651,000 1,292,339<strong>American</strong> Express Co. 11,300,000 1,051,352ACE Ltd. 5,095,000 585,314Citigroup Inc. 9,500,000 514,045Weyerhaeuser Co. 1 13,115,242 470,706SunTrust Banks, Inc. 11,000,000 460,900Capital One Financial Corp. 5,569,000 459,721Other securities 1,827,0349,842,539Consumerdiscretionary9.93%Comcast Corp., Class A 36,050,000 2,091,260Home Depot, Inc. 16,929,349 1,777,074Amazon.com, Inc. 1 4,119,500 1,278,487Twenty-First Century Fox, Inc., Class A 25,156,900 966,151Walt Disney Co. 5,220,000 491,672Other securities 1,304,9667,909,610Informationtechnology8.84%Microsoft Corp. 59,655,000 2,770,975Texas Instruments Inc. 11,232,000 600,519ASML Holding NV (New York registered) 4,055,401 437,294ASML Holding NV 2 1,470,405 157,534Cisco Systems, Inc. 18,250,000 507,624TE Connectivity Ltd. 7,805,000 493,666Other securities 2,076,5707,044,182Industrials8.49%Boeing Co. 12,695,000 1,650,096Lockheed Martin Corp. 6,574,037 1,265,962Union Pacific Corp. 7,040,000 838,675General Electric Co. 23,650,000 597,635Parker-Hannifin Corp. 4,100,000 528,695United Technologies Corp. 3,690,000 424,350Other securities 1,459,4116,764,824Consumer staples7.61%Philip Morris International Inc. 14,750,000 1,201,387Coca-Cola Co. 27,663,000 1,167,932Procter & Gamble Co. 9,935,000 904,979PepsiCo, Inc. 8,766,000 828,913Costco Wholesale Corp. 5,677,326 804,7612 12 <strong>American</strong> <strong>Balanced</strong> <strong>Fund</strong>
SharesValue(000)Nestlé SA 2 8,140,000 $ 596,675Nestlé SA (ADR) 1,000,000 72,950Other securities 488,7256,066,322Health care6.71%Merck & Co., Inc. 22,990,000 1,305,602UnitedHealth Group Inc. 9,295,000 939,632Pfizer Inc. 21,905,000 682,341Roche Holding AG 2 2,358,957 639,373Bristol-Myers Squibb Co. 9,950,000 587,348Johnson & Johnson 5,510,000 576,181Other securities 618,7695,349,246Energy4.39%Chevron Corp. 5,244,755 588,357Royal Dutch Shell PLC, Class B (ADR) 8,058,000 560,514Enbridge Inc. 9,795,000 503,561ConocoPhillips 7,169,508 495,126Other securities 1,346,0523,493,610Materials3.07%Potash Corp. of Saskatchewan Inc. 19,850,000 701,102E.I. du Pont de Nemours and Co. 6,750,000 499,095Other securities 1,247,3132,447,510Other0.73%Other securities 579,754Miscellaneous4.77%Other common stocks in initial period of acquisition 3,797,825Total common stocks (cost: $32,600,515,000) 53,295,422Bonds, notes & other debt instruments 27.82%Principal amount(000) 2Financials2.93%<strong>American</strong> Express Co. 6.15% 2017 $ 22,800 25,421<strong>American</strong> Express Credit Co. 1.55% 2017 15,465 15,507Berkshire Hathaway Inc. 2.00%–2.90% 2016–2020 60,840 62,108JPMorgan Chase & Co. 1.35%–3.88% 2017–2024 159,365 159,511JPMorgan Chase & Co., Series S, junior subordinated, perpetual, 6.75% (undated) 3 25,000 26,531Wells Fargo & Co. 1.25%–4.60% 2016–2024 111,300 115,201Other securities 1,929,6472,333,926Consumerdiscretionary1.07%21st Century Fox America, Inc. 3.70% 2024 4 18,420 18,985Amazon.com, Inc. 3.80%–4.95% 2024–2044 109,575 113,343Comcast Corp. 3.60%–6.45% 2017–2044 60,350 70,803Home Depot, Inc. 2.00%–5.95% 2019–2041 77,700 84,241News America Inc. 3.00% 2022 6,000 5,970Other securities 556,200849,542Consumer staples0.98%Coca-Cola Co. 1.50%–1.80% 2015–2016 36,470 36,961PepsiCo, Inc. 7.90% 2018 15,000 18,264Philip Morris International Inc. 3.25%–4.88% 2024–2044 59,800 60,616Procter & Gamble Co. 1.45% 2016 13,460 13,625Other securities 647,716777,182<strong>American</strong> <strong>Balanced</strong> <strong>Fund</strong> 13 3
Bonds, notes & other debt instruments (continued)Principal amount(000)Value(000) Health care0.91%UnitedHealth Group Inc. 1.40%–6.00% 2017–2018 $ 67,170 $ 74,022Other securities 653,041727,063Industrials0.54%Boeing Company 0.95% 2018 12,000 11,743General Electric Capital Corp. 1.00%–6.00% 2015–2024 99,605 103,139General Electric Co. 0.85%–4.50% 2015–2044 44,100 44,881General Electric Corp. 5.25% 2017 16,000 17,758Union Pacific Corp. 5.70% 2018 11,150 12,711Other securities 240,145430,377Other2.83%Other securities 2,258,557Total corporate bonds & notes 7,376,647 U.S. Treasury6.34%U.S. Treasury 0.25% 2015 489,000 489,323U.S. Treasury 0.38%–5.50% 2015–2044 3,128,524 3,297,525U.S. Treasury 0.625% 2018 775,000 759,438U.S. Treasury 1.50% 2019 511,500 508,2015,054,487U.S. Treasuryinflation-protectedsecurities1.56%U.S. Treasury Inflation-Protected Security 0.13%–2.38% 2015–2043 5 729,170 740,096U.S. Treasury Inflation-Protected Security 1.375% 2044 5 438,688 501,4011,241,497Total U.S. Treasury bonds & notes 6,295,984 Federal agencymortgage-backedobligations4.45%Fannie Mae 0.00%–11.01% 2018–2047 3,6,7 2,504,771 2,647,668Freddie Mac 0.00%–6.50% 2023–2044 3,6 200,498 213,297Other securities 683,7713,544,736Other2.22%Other securities 1,771,509Total mortgage-backed obligations 5,316,245 23Fannie Mae 0.38%–6.25% 2015–2029 3,6 759,454 770,848Federal Home Loan Bank 0.38%–5.50% 2016–2036 171,405 174,107Freddie Mac 0.50%–3.53% 2015–2024 3,6 723,416 729,247Other securities 158,9501,833,152 Other securities 1,302,738Other bonds, notes and other debt instruments in initial period of acquisition 39,507Total bonds, notes & other debt instruments (cost: $21,574,677,000) 22,164,273Short-term securities 5.97%Chariot <strong>Fund</strong>ing, LLC 0.25%–0.27% due 5/21/2015–8/26/2015 4 120,600 120,428Coca-Cola Co. 0.13%–0.19% due 1/8/2015–4/23/2015 4 162,100 162,069Fannie Mae 0.06%–0.16% due 1/7/2015–10/1/2015 1,172,994 1,172,609Federal Home Loan Bank 0.07%–0.17% due 1/14/2015–11/4/2015 1,491,397 1,491,012Freddie Mac 0.07%–0.17% due 1/12/2015–8/18/2015 698,400 698,185 14 <strong>American</strong> <strong>Balanced</strong> <strong>Fund</strong>
Principal amount(000)Value(000)General Electric Capital Corp. 0.19%–0.20% due 5/5/2015–5/13/2015 $120,000 $ 119,923JPMorgan Chase & Co. 0.25% due 3/11/2015 4 25,000 24,991Jupiter Securitization Co., LLC 0.21% due 5/5/2015 4 25,000 24,980Procter & Gamble Co. 0.08%–0.15% due 1/5/2015–2/9/2015 4 140,000 139,995Other securities 802,842Total short-term securities (cost: $4,756,675,000) 4,757,034Total investment securities 100.69% (cost: $58,931,867,000) 80,216,729Other assets less liabilities (0.69)% (553,050)Net assets 100.00% $79,663,679This summary investment portfolio is designed to streamline the report and help investors better focus on the fund’s principal holdings. See the inside back coverfor details on how to obtain a complete schedule of portfolio holdings.As permitted by U.S. Securities and Exchange Commission regulations, “Miscellaneous” securities include holdings in their first year of acquisition that have notpreviously been publicly disclosed.“Other securities” includes all issues that are not disclosed separately in the summary investment portfolio, including loan participations and assignments whichmay be subject to legal or contractual restrictions on resale. The total value of all such loans was $5,506,000, which represented .01% of the net assets of the fund.The following footnotes apply to either the individual securities noted or one or more of the securities aggregated and listed as a single line item.1Security did not produce income during the last 12 months.2Valued under fair value procedures adopted by authority of the board of trustees. The total value of all such securities, including those in “Miscellaneous“ and“Other securities,“ was $1,785,370,000, which represented 2.24% of the net assets of the fund. This amount includes $1,773,228,000 related to certain securitiestrading outside the U.S. whose values were adjusted as a result of significant market movements following the close of local trading.3Coupon rate may change periodically.4Acquired in a transaction exempt from registration under Rule 144A or Section 4(2) of the Securities Act of 1933. May be resold in the U.S. in transactions exemptfrom registration, normally to qualified institutional buyers. The total value of all such securities, including those in “Other securities,“ was $3,055,295,000, whichrepresented 3.84% of the net assets of the fund.5 Index-linked bond whose principal amount moves with a government price index.6Principal payments may be made periodically. Therefore, the effective maturity date may be earlier than the stated maturity date.7 A portion or all of the security purchased on a TBA basis.Key to abbreviationsADR = <strong>American</strong> Depository ReceiptsTBA = To be announcedSee Notes to Financial Statements<strong>American</strong> <strong>Balanced</strong> <strong>Fund</strong> 15
Financial statements at December 31, 2014(dollars in thousands)Assets:Investment securities, at value (cost: $58,931,867) $80,216,729Cash 1,163Receivables for:Sales of investments $ 755,690Sales of fund’s shares 337,088Dividends and interest 196,414 1,289,19281,507,084Liabilities:Payables for:Purchases of investments 1,559,586Repurchases of fund’s shares 233,196Investment advisory services 15,589Services provided by related parties 29,073Trustees’ deferred compensation 4,227Other 1,734 1,843,405Net assets at December 31, 2014 $79,663,679Net assets consist of:Capital paid in on shares of beneficial interest $58,078,777Undistributed net investment income 122,668Undistributed net realized gain 178,586Net unrealized appreciation 21,283,648Net assets at December 31, 2014 $79,663,679Shares of beneficial interest issued and outstanding (no stated par value) —unlimited shares authorized (3,220,722 total shares outstanding)Net assets(dollars and shares in thousands, except per-share amounts)SharesoutstandingNet asset valueper shareClass A $46,916,623 1,895,258 $24.75Class B 541,503 21,915 24.71Class C 5,573,575 226,297 24.63Class F-1 2,841,081 114,837 24.74Class F-2 1,869,537 75,555 24.74Class 529-A 2,831,067 114,526 24.72Class 529-B 72,769 2,939 24.76Class 529-C 904,726 36,622 24.70Class 529-E 144,261 5,839 24.71Class 529-F-1 110,888 4,489 24.71Class R-1 157,898 6,417 24.61Class R-2 1,307,723 53,115 24.62Class R-2E 10 —* 24.75Class R-3 3,315,311 134,519 24.65Class R-4 4,384,832 177,399 24.72Class R-5 2,616,255 105,610 24.77Class R-6 6,075,620 245,385 24.76*Amount less than one thousand.See Notes to Financial Statements 16 <strong>American</strong> <strong>Balanced</strong> <strong>Fund</strong>
for the year ended December 31, 2014(dollars in thousands)Investment income:Income:Dividends (net of non-U.S. taxes of $13,991) $1,173,278Interest 486,595 $1,659,873Fees and expenses*:Investment advisory services 173,885Distribution services 227,751Transfer agent services 74,564Administrative services 19,275<strong>Report</strong>s to shareholders 2,326Registration statement and prospectus 1,058Trustees’ compensation 703Auditing and legal 142Custodian 609Other 3,814 504,127Net investment income 1,155,746Net realized gain and unrealized appreciation on investments and currency:Net realized gain (loss) on:Investments 4,942,260Currency transactions (906) 4,941,354Net unrealized appreciation (depreciation) on:Investments (net of non-U.S. taxes of $511) 272,453Currency translations (926) 271,527Net realized gain and unrealized appreciation on investments and currency 5,212,881Net increase in net assets resulting from operations $6,368,627*Additional information related to class-specific fees and expenses is included in the Notes to Financial Statements. (dollars in thousands)Year ended December 312014 2013Operations:Net investment income $ 1,155,746 $ 970,228Net realized gain on investments and currency transactions 4,941,354 1,873,080Net unrealized appreciation on investments and currency translations 271,527 9,504,575Net increase in net assets resulting from operations 6,368,627 12,347,883Dividends and distributions paid to shareholders:Dividends from net investment income (1,089,310) (1,016,591)Distributions from net realized gain on investments (4,365,643) —Total dividends and distributions paid to shareholders (5,454,953) (1,016,591)Net capital share transactions 7,862,108 3,682,825Total increase in net assets 8,775,782 15,014,117Net assets:Beginning of year 70,887,897 55,873,780End of year (including undistributed net investment income:$122,668 and $45,929, respectively) $79,663,679 $70,887,897See Notes to Financial Statements<strong>American</strong> <strong>Balanced</strong> <strong>Fund</strong> 17
Notes to financial statements <strong>American</strong> <strong>Balanced</strong> <strong>Fund</strong> (the “fund”) is registered under the Investment Company Act of 1940 as an open-end, diversified investmentcompany. The fund seeks conservation of capital, current income, and long-term growth of both capital and income.The fund has 17 share classes consisting of five retail share classes (Classes A, B and C, as well as two F share classes, F-1 and F-2), five529 college savings plan share classes (Classes 529-A, 529-B, 529-C, 529-E and 529-F-1) and seven retirement plan share classes(Classes R-1, R-2, R2-E, R-3, R-4, R-5 and R-6). The 529 college savings plan share classes can be used to save for college education. Theretirement plan share classes are generally offered only through eligible employer-sponsored retirement plans. The fund's share classesare described further in the following table:Share classInitial sales chargeContingent deferred sales charge uponredemptionConversion featureClasses A and 529-A Up to 5.75% None (except 1% for certain redemptionswithin one year of purchase without aninitial sales charge)Classes B and 529-B* None Declines from 5% to 0% for redemptionswithin six years of purchaseClass C None 1% for redemptions within one year ofpurchaseClass 529-C None 1% for redemptions within one year ofpurchaseClass 529-E None None NoneClasses F-1, F-2 and 529-F-1 None None NoneClasses R-1, R-2, R-2E, R-3, R-4,R-5 and R-6None None None*Class B and 529-B shares of the fund are not available for purchase.NoneClasses B and 529-B convert toClasses A and 529-A, respectively,after eight yearsClass C converts to Class F-1after 10 yearsNoneOn August 29, 2014, the fund made an additional retirement plan share class (Class R-2E) available for sale pursuant to an amendment toits registration statement filed with the U.S. Securities and Exchange Commission. Refer to the fund’s prospectus for more details.Holders of all share classes have equal pro rata rights to the assets, dividends and liquidation proceeds of the fund. Each share class hasidentical voting rights, except for the exclusive right to vote on matters affecting only its class. Share classes have different fees andexpenses (“class-specific fees and expenses”), primarily due to different arrangements for distribution, transfer agent and administrativeservices. Differences in class-specific fees and expenses will result in differences in net investment income and, therefore, the payment ofdifferent per-share dividends by each share class.2 The fund is an investment company that applies the accounting and reporting guidance issued in Topic 946 by the U.S. FinancialAccounting Standards Board. The fund’s financial statements have been prepared to comply with U.S. generally accepted accountingprinciples (“U.S. GAAP“). These principles require the fund’s investment adviser to make estimates and assumptions that affect reportedamounts and disclosures. Actual results could differ from those estimates. The fund follows the significant accounting policies describedin this section, as well as the valuation policies described in the next section on valuation.Security transactions and related investment income — Security transactions are recorded by the fund as of the date the trades areexecuted with brokers. Realized gains and losses from security transactions are determined based on the specific identified cost of thesecurities. In the event a security is purchased with a delayed payment date, the fund will segregate liquid assets sufficient to meet itspayment obligations. Dividend income is recognized on the ex-dividend date and interest income is recognized on an accrual basis.Market discounts, premiums and original issue discounts on fixed-income securities are amortized daily over the expected life of thesecurity.Class allocations — Income, fees and expenses (other than class-specific fees and expenses) and realized and unrealized gains and lossesare allocated daily among the various share classes based on their relative net assets. Class-specific fees and expenses, such asdistribution, transfer agent and administrative services, are charged directly to the respective share class. 18 <strong>American</strong> <strong>Balanced</strong> <strong>Fund</strong>
Dividends and distributions to shareholders — Dividends and distributions to shareholders are recorded on the ex-dividend date.Currency translation — Assets and liabilities, including investment securities, denominated in currencies other than U.S. dollars aretranslated into U.S. dollars at the exchange rates supplied by one or more pricing vendors on the valuation date. Purchases and sales ofinvestment securities and income and expenses are translated into U.S. dollars at the exchange rates on the dates of such transactions.The effects of changes in exchange rates on investment securities are included with the net realized gain or loss and net unrealizedappreciation or depreciation on investments in the fund’s statement of operations. The realized gain or loss and unrealized appreciationor depreciation resulting from all other transactions denominated in currencies other than U.S. dollars are disclosed separately.3 Capital Research and Management Company (“CRMC”), the fund’s investment adviser, values the fund’s investments at fair value asdefined by U.S. GAAP. The net asset value of each share class of the fund is generally determined as of approximately 4:00 p.m. New Yorktime each day the New York Stock Exchange is open.Methods and inputs — The fund’s investment adviser uses the following methods and inputs to establish the fair value of the fund’s assetsand liabilities. Use of particular methods and inputs may vary over time based on availability and relevance as market and economicconditions evolve.Equity securities are generally valued at the official closing price of, or the last reported sale price on, the exchange or market on whichsuch securities are traded, as of the close of business on the day the securities are being valued or, lacking any sales, at the last availablebid price. Prices for each security are taken from the principal exchange or market on which the security trades.Fixed-income securities, including short-term securities, are generally valued at prices obtained from one or more pricing vendors.Vendors value such securities based on one or more of the inputs described in the following table. The table provides examples of inputsthat are commonly relevant for valuing particular classes of fixed-income securities in which the fund is authorized to invest. However,these classifications are not exclusive, and any of the inputs may be used to value any other class of fixed-income security.Fixed-income classAllCorporate bonds & notes; convertible securitiesBonds & notes of governments & government agenciesMortgage-backed; asset-backed obligationsMunicipal securitiesExamples of standard inputsBenchmark yields, transactions, bids, offers, quotations from dealers andtrading systems, new issues, spreads and other relationships observed inthe markets among comparable securities; and proprietary pricing modelssuch as yield measures calculated using factors such as cash flows, financialor collateral performance and other reference data (collectively referred toas “standard inputs”)Standard inputs and underlying equity of the issuerStandard inputs and interest rate volatilitiesStandard inputs and cash flows, prepayment information, default rates,delinquency and loss assumptions, collateral characteristics, creditenhancements and specific deal informationStandard inputs and, for certain distressed securities, cash flows orliquidation values using a net present value calculation based on inputs thatinclude, but are not limited to, financial statements and debt contractsWhen the fund’s investment adviser deems it appropriate to do so (such as when vendor prices are unavailable or deemed to be notrepresentative), fixed-income securities will be valued in good faith at the mean quoted bid and ask prices that are reasonably and timelyavailable (or bid prices, if ask prices are not available) or at prices for securities of comparable maturity, quality and type.Securities with both fixed-income and equity characteristics, or equity securities traded principally among fixed-income dealers, aregenerally valued in the manner described above for either equity or fixed-income securities, depending on which method is deemedmost appropriate by the fund’s investment adviser.Securities and other assets for which representative market quotations are not readily available or are considered unreliable by the fund’sinvestment adviser are fair valued as determined in good faith under fair valuation guidelines adopted by authority of the fund’s board oftrustees as further described. The investment adviser follows fair valuation guidelines, consistent with U.S. Securities and ExchangeCommission rules and guidance, to consider relevant principles and factors when making fair value determinations. The investmentadviser considers relevant indications of value that are reasonably and timely available to it in determining the fair value to be assigned to<strong>American</strong> <strong>Balanced</strong> <strong>Fund</strong> 19
a particular security, such as the type and cost of the security; contractual or legal restrictions on resale of the security; relevant financial orbusiness developments of the issuer; actively traded similar or related securities; conversion or exchange rights on the security; relatedcorporate actions; significant events occurring after the close of trading in the security; and changes in overall market conditions. Inaddition, the closing prices of equity securities that trade in markets outside U.S. time zones may be adjusted to reflect significant eventsthat occur after the close of local trading but before the net asset value of each share class of the fund is determined. Fair valuations andvaluations of investments that are not actively trading involve judgment and may differ materially from valuations that would have beenused had greater market activity occurred.Processes and structure — The fund’s board of trustees has delegated authority to the fund’s investment adviser to make fair valuedeterminations, subject to board oversight. The investment adviser has established a Joint Fair Valuation Committee (the “Fair ValuationCommittee”) to administer, implement and oversee the fair valuation process, and to make fair value decisions. The Fair ValuationCommittee regularly reviews its own fair value decisions, as well as decisions made under its standing instructions to the investmentadviser’s valuation teams. The Fair Valuation Committee reviews changes in fair value measurements from period to period and may, asdeemed appropriate, update the fair valuation guidelines to better reflect the results of back testing and address new or evolving issues.The Fair Valuation Committee reports any changes to the fair valuation guidelines to the board of trustees with supplemental informationto support the changes. The fund’s board and audit committee also regularly review reports that describe fair value determinations andmethods.The fund’s investment adviser has also established a Fixed-Income Pricing Review Group to administer and oversee the fixed-incomevaluation process, including the use of fixed-income pricing vendors. This group regularly reviews pricing vendor information and marketdata. Pricing decisions, processes and controls over security valuation are also subject to additional internal reviews, including an annualcontrol self-evaluation program facilitated by the investment adviser’s compliance group.Classifications — The fund’s investment adviser classifies the fund’s assets and liabilities into three levels based on the inputs used to valuethe assets or liabilities. Level 1 values are based on quoted prices in active markets for identical securities. Level 2 values are based onsignificant observable market inputs, such as quoted prices for similar securities and quoted prices in inactive markets. Certain securitiestrading outside the U.S. may transfer between Level 1 and Level 2 due to valuation adjustments resulting from significant marketmovements following the close of local trading. Level 3 values are based on significant unobservable inputs that reflect the investmentadviser’s determination of assumptions that market participants might reasonably use in valuing the securities. The valuation levels arenot necessarily an indication of the risk or liquidity associated with the underlying investment. For example, U.S. government securities arereflected as Level 2 because the inputs used to determine fair value may not always be quoted prices in an active market. The followingtable presents the fund’s valuation levels as of December 31, 2014 (dollars in thousands):Investment securitiesLevel 1 Level 2* Level 3 TotalAssets:Common stocks:Financials $ 9,842,539 $ — $— $ 9,842,539Consumer discretionary 7,909,610 — — 7,909,610Information technology 6,886,648 157,534 — 7,044,182Industrials 6,764,824 — — 6,764,824Consumer staples 5,469,647 596,675 — 6,066,322Health care 4,709,873 639,373 — 5,349,246Energy 3,493,610 — — 3,493,610Materials 2,447,510 — — 2,447,510Other 579,754 — — 579,754Miscellaneous 3,418,178 379,647 — 3,797,825Bonds, notes & other debt instruments:Corporate bonds & notes — 7,376,647 — 7,376,647U.S. Treasury bonds & notes — 6,295,984 — 6,295,984Mortgage-backed obligations — 5,316,245 — 5,316,245Federal agency bonds & notes — 1,833,152 — 1,833,152Other — 1,302,738 — 1,302,738Miscellaneous — 39,507 — 39,507Short-term securities — 4,757,034 — 4,757,034Total $51,522,193 $28,694,536 $— $80,216,729*Securities with a value of $1,393,582,000, which represented 1.75% of the net assets of the fund, transferred from Level 1 to Level 2 since the prior fiscalyear-end, primarily due to significant market movements following the close of local trading.20 <strong>American</strong> <strong>Balanced</strong> <strong>Fund</strong>
Investing in the fund may involve certain risks including, but not limited to, those described below.Market conditions — The prices of, and the income generated by, the common stocks, bonds and other securities held by the fund maydecline – sometimes rapidly or unpredictably – due to various factors, including events or conditions affecting the general economy orparticular industries; overall market changes; local, regional or global political, social or economic instability; governmental orgovernmental agency responses to economic conditions; and currency exchange, interest rate and commodity price fluctuations.Issuer risks — The prices of, and the income generated by, securities held by the fund may decline in response to various factors directlyrelated to the issuers of such securities, including reduced demand for an issuer’s goods or services, poor management performance andstrategic initiatives such as mergers, acquisitions or dispositions and the market response to any such initiatives.Investing in growth-oriented stocks — Growth-oriented common stocks and other equity-type securities (such as preferred stocks,convertible preferred stocks and convertible bonds) may involve larger price swings and greater potential for loss than other types ofinvestments.Investing in income-oriented stocks — Income provided by the fund may be reduced by changes in the dividend policies of, and thecapital resources available for dividend payments at, the companies in which the fund invests.Investing in debt instruments — The prices of, and the income generated by, bonds and other debt securities held by the fund may beaffected by changing interest rates and by changes in the effective maturities and credit ratings of these securities.Rising interest rates will generally cause the prices of bonds and other debt securities to fall. Falling interest rates may cause an issuer toredeem, call or refinance a debt security before its stated maturity, which may result in the fund having to reinvest the proceeds in loweryielding securities. Longer maturity debt securities generally have greater sensitivity to changes in interest rates and may be subject togreater price fluctuations than shorter maturity debt securities.Bonds and other debt securities are also subject to credit risk, which is the possibility that the credit strength of an issuer will weakenand/or an issuer of a debt security will fail to make timely payments of principal or interest and the security will go into default. Lowerquality debt securities generally have higher rates of interest and may be subject to greater price fluctuations than higher quality debtsecurities. Credit risk is gauged, in part, by the credit ratings of the debt securities in which the fund invests. However, ratings are only theopinions of the rating agencies issuing them and are not guarantees as to credit quality or an evaluation of market risk. The fund’sinvestment adviser relies on its own credit analysts to research issuers and issues in seeking to mitigate various credit and default risks.Investing in securities backed by the U.S. government — Securities backed by the U.S. Treasury or the full faith and credit of the U.S.government are guaranteed only as to the timely payment of interest and principal when held to maturity. Accordingly, the current marketvalues for these securities will fluctuate with changes in interest rates. Securities issued by government-sponsored entities and federalagencies and instrumentalities that are not backed by the full faith and credit of the U.S. government are neither issued nor guaranteedby the U.S. government.Investing in mortgage-related and other asset-backed securities — Mortgage-related securities, such as mortgage-backed securities, andother asset-backed securities, include debt obligations that represent interests in pools of mortgages or other income-bearing assets,such as consumer loans or receivables. Such securities often involve risks that are different from or more acute than the risks associatedwith investing in other types of debt securities. Mortgage-backed and other asset-backed securities are subject to changes in thepayment patterns of borrowers of the underlying debt. When interest rates fall, borrowers are more likely to refinance or prepay theirdebt before its stated maturity. This may result in the fund having to reinvest the proceeds in lower yielding securities, effectively reducingthe fund’s income. Conversely, if interest rates rise and borrowers repay their debt more slowly than expected, the time in which themortgage-backed and other asset-backed securities are paid off could be extended, reducing the fund’s cash available for reinvestmentin higher yielding securities.Thinly traded securities — There may be little trading in the secondary market for particular bonds or other debt securities, which maymake them more difficult to value, acquire or sell.Investing outside the U.S. — Securities of issuers domiciled outside the U.S., or with significant operations or revenues outside the U.S.,may lose value because of adverse political, social, economic or market developments (including social instability, regional conflicts,terrorism and war) in the countries or regions in which the issuers operate or generate revenue. These securities may also lose value due<strong>American</strong> <strong>Balanced</strong> <strong>Fund</strong> 21 2
to changes in foreign currency exchange rates against the U.S. dollar and/or currencies of other countries. Issuers of these securities maybe more susceptible to actions of foreign governments, such as the imposition of price controls or punitive taxes, that could adverselyimpact revenues. Securities markets in certain countries may be more volatile and/or less liquid than those in the U.S. Investments outsidethe U.S. may also be subject to different accounting practices and different regulatory, legal and reporting standards and practices, andmay be more difficult to value, than those in the U.S. In addition, the value of investments outside the U.S. may be reduced by foreigntaxes, including foreign withholding taxes on interest and dividends. Further, there may be increased risks of delayed settlement ofsecurities purchased or sold by the fund. The risks of investing outside the U.S. may be heightened in connection with investments inemerging markets.Management — The investment adviser to the fund actively manages the fund’s investments. Consequently, the fund is subject to the riskthat the methods and analyses employed by the investment adviser in this process may not produce the desired results. This could causethe fund to lose value or its investment results to lag relevant benchmarks or other funds with similar objectives. Index-linked bonds — The fund has invested in index-linked bonds, which are fixed-income securities whose principal value is periodicallyadjusted to a government price index. Over the life of an index-linked bond, interest is paid on the adjusted principal value. Increases ordecreases in the principal value of index-linked bonds are recorded as interest income in the fund’s statement of operations.Mortgage dollar rolls — The fund has entered into mortgage dollar roll transactions in which the fund sells a mortgage-backed security toa counterparty and simultaneously enters into an agreement with the same counterparty to buy back a similar security on a specific futuredate at a predetermined price. Mortgage dollar rolls are accounted for as purchase and sale transactions, which may increase the fund’sportfolio turnover rate.Loan transactions — The fund has entered into loan transactions in which the fund acquires a loan either through an agent, by assignmentfrom another holder, or as a participation interest in another holder's portion of a loan. The loan is often administered by a financialinstitution that acts as agent for the holders of the loan, and the fund may be required to receive approval from the agent and/orborrower prior to the sale of the investment. The loan’s interest rate and maturity date may change based on the terms of the loan,including potential early payments of principal. Federal income taxation — The fund complies with the requirements under Subchapter M of the Internal Revenue Code applicable tomutual funds and intends to distribute substantially all of its net taxable income and net capital gains each year. The fund is not subject toincome taxes to the extent such distributions are made. Therefore, no federal income tax provision is required.As of and during the period ended December 31, 2014, the fund did not have a liability for any unrecognized tax benefits. The fundrecognizes interest and penalties, if any, related to unrecognized tax benefits as income tax expense in the statement of operations.During the period, the fund did not incur any interest or penalties.The fund is not subject to examination by U.S. federal tax authorities for tax years before 2011 and by state tax authorities for tax yearsbefore 2010.Non-U.S. taxation — Dividend and interest income are recorded net of non-U.S. taxes paid.Distributions — Distributions paid to shareholders are based on net investment income and net realized gains determined on a tax basis,which may differ from net investment income and net realized gains for financial reporting purposes. These differences are due primarilyto different treatment for items such as currency gains and losses; short-term capital gains and losses; capital losses related to sales ofcertain securities within 30 days of purchase; deferred expenses; cost of investments sold; and paydowns on fixed-income securities. Thefiscal year in which amounts are distributed may differ from the year in which the net investment income and net realized gains arerecorded by the fund for financial reporting purposes. The fund may also designate a portion of the amount paid to redeemingshareholders as a distribution for tax purposes.During the year ended December 31, 2014, the fund reclassified $53,000 from undistributed net investment income to capital paid in onshares of beneficial interest, $10,356,000 from undistributed net realized gain to undistributed net investment income and $330,520,000from undistributed net realized gain to capital paid in on shares of beneficial interest to align financial reporting with tax reporting.22 <strong>American</strong> <strong>Balanced</strong> <strong>Fund</strong>
As of December 31, 2014, the tax-basis components of distributable earnings, unrealized appreciation (depreciation) and cost ofinvestment securities were as follows (dollars in thousands):Undistributed ordinary income $ 126,541Undistributed long-term capital gains 293,489Gross unrealized appreciation on investment securities 21,786,135Gross unrealized depreciation on investment securities (616,538)Net unrealized appreciation on investment securities 21,169,597Cost of investment securities 59,047,132The tax character of distributions paid to shareholders was as follows (dollars in thousands):Year ended December 31, 2014 Year ended December 31, 2013Share classOrdinaryincomeLong-termcapital gainsTotaldistributionspaidOrdinaryincomeLong-termcapital gainsTotaldistributionspaidClass A $ 682,770 $2,574,901 $3,257,671 $ 652,292 $— $ 652,292Class B 4,570 30,111 34,681 8,009 — 8,009Class C 39,424 306,922 346,346 43,012 — 43,012Class F-1 40,381 156,238 196,619 33,091 — 33,091Class F-2 23,275 100,875 124,150 11,288 — 11,288Class 529-A 39,082 155,378 194,460 37,869 — 37,869Class 529-B 507 4,036 4,543 894 — 894Class 529-C 5,839 49,737 55,576 6,380 — 6,380Class 529-E 1,657 7,925 9,582 1,684 — 1,684Class 529-F-1 1,791 6,088 7,879 1,669 — 1,669Class R-1 1,139 8,714 9,853 1,279 — 1,279Class R-2 10,014 72,266 82,280 12,038 — 12,038Class R-2E* — † 1 1Class R-3 38,877 183,868 222,745 40,498 — 40,498Class R-4 63,239 242,446 305,685 61,020 — 61,020Class R-5 45,017 146,814 191,831 45,056 — 45,056Class R-6 91,728 319,323 411,051 60,512 — 60,512Total $1,089,310 $4,365,643 $5,454,953 $1,016,591 $— $1,016,591*Class R-2E shares were offered beginning August 29, 2014.†Amount less than one thousand. CRMC, the fund’s investment adviser, is the parent company of <strong>American</strong> <strong>Fund</strong>s Distributors,® Inc. (“AFD”), the principal underwriter ofthe fund’s shares, and <strong>American</strong> <strong>Fund</strong>s Service Company® (“AFS”), the fund’s transfer agent. CRMC, AFD and AFS are considered relatedparties to the fund.Investment advisory services — The fund has an investment advisory and service agreement with CRMC that provides for monthly feesaccrued daily. These fees are based on a series of decreasing annual rates beginning with 0.420% on the first $500 million of daily netassets and decreasing to 0.210% on such assets in excess of $71 billion. For the year ended December 31, 2014, the investment advisoryservices fee was $173,885,000, which was equivalent to an annualized rate of 0.232% of average daily net assets.Class-specific fees and expenses — Expenses that are specific to individual share classes are accrued directly to the respective share class.The principal class-specific fees and expenses are further described below:Distribution services — The fund has plans of distribution for all share classes, except Class F-2, R-5 and R-6 shares. Under the plans,the board of trustees approves certain categories of expenses that are used to finance activities primarily intended to sell fund sharesand service existing accounts. The plans provide for payments, based on an annualized percentage of average daily net assets,ranging from 0.25% to 1.00% as noted in this section. In some cases, the board of trustees has limited the amounts that may be paidto less than the maximum allowed by the plans. All share classes with a plan may use up to 0.25% of average daily net assets to pay<strong>American</strong> <strong>Balanced</strong> <strong>Fund</strong> 23
service fees, or to compensate AFD for paying service fees, to firms that have entered into agreements with AFD to provide certainshareholder services. The remaining amounts available to be paid under each plan are paid to dealers to compensate them for theirsales activities.For Class A and 529-A shares, distribution-related expenses include the reimbursement of dealer and wholesaler commissions paidby AFD for certain shares sold without a sales charge. These share classes reimburse AFD for amounts billed within the prior 15months but only to the extent that the overall annual expense limit of 0.25% is not exceeded. As of December 31, 2014, there wereno unreimbursed expenses subject to reimbursement for Class A or 529-A shares.Share class Currently approved limits Plan limitsClass A 0.25% 0.25%Class 529-A 0.25 0.50Classes B and 529-B 1.00 1.00Classes C, 529-C and R-1 1.00 1.00Class R-2 0.75 1.00Class R-2E 0.60 0.85Classes 529-E and R-3 0.50 0.75Classes F-1, 529-F-1 and R-4 0.25 0.50Transfer agent services — The fund has a shareholder services agreement with AFS under which the fund compensates AFS forproviding transfer agent services to each of the fund’s share classes. These services include recordkeeping, shareholder communicationsand transaction processing. In addition, the fund reimburses AFS for amounts paid to third parties for performing transfer agentservices on behalf of fund shareholders.Administrative services — The fund has an administrative services agreement with CRMC under which the fund compensates CRMCfor providing administrative services to Class A, C, F, 529 and R shares. These services include, but are not limited to, coordinating,monitoring, assisting and overseeing third parties that provide services to fund shareholders. Under the agreement, Class A sharespay an annual fee of 0.01% and Class C, F, 529 and R shares pay an annual fee of 0.05% of their respective average daily net assets.529 plan services — Each 529 share class is subject to service fees to compensate the Virginia College Savings Plan ("Virginia529") forits oversight and administration of the 529 college savings plan. During the period January 1, 2014, to March 31, 2014, the quarterlyfee was based on a series of decreasing annual rates beginning with 0.10% on the first $30 billion of the net assets invested in Class529 shares of the <strong>American</strong> <strong>Fund</strong>s and decreasing to 0.06% on such assets between $120 billion and $150 billion. Effective April 1,2014, the quarterly fee was amended to provide for reduced annual rates of 0.07%, 0.06% and 0.05% over $30 billion, $50 billionand $70 billion, respectively, of the net assets invested in Class 529 shares of the <strong>American</strong> <strong>Fund</strong>s. The fee for any given calendarquarter is accrued and calculated on the basis of the average net assets of Class 529 shares of the <strong>American</strong> <strong>Fund</strong>s for the last monthof the prior calendar quarter. The fee is included in other expenses in the fund’s statement of operations. Virginia529 is notconsidered a related party to the fund.24 <strong>American</strong> <strong>Balanced</strong> <strong>Fund</strong>
For the year ended December 31, 2014, class-specific expenses under the agreements were as follows (dollars in thousands):Share classDistributionservicesTransfer agentservicesAdministrativeservices529 planservicesClass A $106,617 $46,310 $ 4,456 Not applicableClass B 6,538 675 Not applicable Not applicableClass C 53,412 5,419 2,677 Not applicableClass F-1 6,702 3,025 1,343 Not applicableClass F-2 Not applicable 1,238 630 Not applicableClass 529-A 6,081 2,136 1,355 $2,470Class 529-B 872 80 44 80Class 529-C 8,641 724 435 793Class 529-E 691 77 70 127Class 529-F-1 — 83 54 98Class R-1 1,522 149 76 Not applicableClass R-2 9,664 4,155 648 Not applicableClass R-2E* — — † — † Not applicableClass R-3 16,385 4,918 1,641 Not applicableClass R-4 10,626 4,286 2,126 Not applicableClass R-5 Not applicable 1,266 1,276 Not applicableClass R-6 Not applicable 23 2,444 Not applicableTotal class-specific expenses $227,751 $74,564 $19,275 $3,568*Class R-2E shares were offered beginning August 29, 2014.† Amount less than one thousand.Trustees’ deferred compensation — Trustees who are unaffiliated with CRMC may elect to defer the cash payment of part or all of theircompensation. These deferred amounts, which remain as liabilities of the fund, are treated as if invested in shares of the fund or other<strong>American</strong> <strong>Fund</strong>s. These amounts represent general, unsecured liabilities of the fund and vary according to the total returns of theselected funds. Trustees’ compensation of $703,000 in the fund’s statement of operations includes $359,000 in current fees (either paid incash or deferred) and a net increase of $344,000 in the value of the deferred amounts.Affiliated officers and trustees — Officers and certain trustees of the fund are or may be considered to be affiliated with CRMC, AFD andAFS. No affiliated officers or trustees received any compensation directly from the fund. Capital share transactions in the fund were as follows (dollars and shares in thousands):Sales 1Reinvestments ofdividends and distributions Repurchases 1 Net increase(decrease)Share class Amount Shares Amount Shares Amount Shares Amount SharesYear ended December 31, 2014Class A $ 5,744,075 229,172 $3,208,616 128,744 $ (5,334,850) (212,761) $3,617,841 145,155Class B 11,642 468 34,382 1,383 (339,367) (13,639) (293,343) (11,788)Class C 1,264,417 50,711 340,638 13,740 (1,346,464) (54,047) 258,591 10,404Class F-1 1,131,467 45,255 191,675 7,698 (991,786) (39,337) 331,356 13,616Class F-2 1,221,630 48,341 117,423 4,710 (225,168) (8,954) 1,113,885 44,097Class 529-A 349,840 13,993 194,398 7,813 (347,878) (13,849) 196,360 7,957Class 529-B 3,128 125 4,542 183 (44,288) (1,773) (36,618) (1,465)Class 529-C 127,469 5,097 55,560 2,235 (130,776) (5,210) 52,253 2,122Class 529-E 18,259 729 9,582 386 (19,879) (791) 7,962 324Class 529-F-1 21,845 874 7,877 317 (21,674) (865) 8,048 326Class R-1 33,513 1,347 9,788 395 (37,993) (1,530) 5,308 212Class R-2 282,068 11,333 82,235 3,318 (378,716) (15,212) (14,413) (561)Class R-2E 2 10 — 3 — — — — 10 — 3Class R-3 774,249 31,058 222,561 8,971 (939,199) (37,601) 57,611 2,428Class R-4 1,019,955 40,816 305,651 12,284 (990,090) (39,478) 335,516 13,622Class R-5 698,623 27,924 191,801 7,691 (800,550) (32,002) 89,874 3,613Class R-6 2,191,350 87,519 411,051 16,488 (470,534) (18,714) 2,131,867 85,293Total net increase(decrease) $14,893,540 594,762 $5,387,780 216,356 $(12,419,212) (495,763) $7,862,108 315,355<strong>American</strong> <strong>Balanced</strong> <strong>Fund</strong> 25 2
Sales 1Reinvestments ofNet increasedividends and distributions Repurchases 1 (decrease)Share class Amount Shares Amount Shares Amount Shares Amount SharesYear ended December 31, 2013Class A $ 5,771,710 257,019 $638,399 28,228 $ (4,829,974) (215,037) $1,580,135 70,210Class B 28,456 1,275 7,915 353 (512,404) (23,120) (476,033) (21,492)Class C 1,085,377 48,422 41,910 1,864 (1,071,709) (47,809) 55,578 2,477Class F-1 953,519 42,210 32,319 1,425 (359,799) (15,964) 626,039 27,671Class F-2 339,973 15,053 9,980 440 (103,614) (4,571) 246,339 10,922Class 529-A 353,333 15,775 37,862 1,677 (314,364) (14,003) 76,831 3,449Class 529-B 4,298 192 894 40 (54,165) (2,423) (48,973) (2,191)Class 529-C 125,242 5,596 6,377 283 (122,695) (5,469) 8,924 410Class 529-E 18,834 840 1,684 75 (20,477) (909) 41 6Class 529-F-1 20,468 910 1,669 74 (18,738) (840) 3,399 144Class R-1 45,246 2,057 1,273 57 (41,530) (1,868) 4,989 246Class R-2 305,186 13,736 12,032 536 (392,794) (17,617) (75,576) (3,345)Class R-3 809,579 36,322 40,465 1,798 (780,292) (34,843) 69,752 3,277Class R-4 1,267,150 57,206 61,018 2,703 (984,030) (43,663) 344,138 16,246Class R-5 551,314 24,580 45,053 1,991 (561,872) (24,996) 34,495 1,575Class R-6 1,519,961 67,390 60,512 2,664 (347,726) (15,363) 1,232,747 54,691Total net increase(decrease) $13,199,646 588,583 $999,362 44,208 $(10,516,183) (468,495) $3,682,825 164,2961 Includes exchanges between share classes of the fund.2 Class R-2E shares were offered beginning August 29, 2014.3Amount less than one thousand. The fund made purchases and sales of investment securities, excluding short-term securities and U.S. government obligations, if any, of$38,349,712,000 and $36,945,803,000, respectively, during the year ended December 31, 2014.2 26 <strong>American</strong> <strong>Balanced</strong> <strong>Fund</strong>
Financial highlightsIncome (loss) frominvestment operations 1Dividends and distributionsNet assetvalue,beginningof periodNetinvestmentincome(loss) 2Net gains(losses) onsecurities(bothrealized andunrealized)Total frominvestmentoperationsDividends(from netinvestmentincome)Distributions(from capitalgains)TotaldividendsanddistributionsNet assetvalue,endof periodTotalreturn 3,4Net assets,end of period(in millions)Ratio ofexpenses toaveragenet assetsRatio ofnet income(loss) toaveragenet assets 2Class A:Year ended 12/31/2014 $24.42 $.41 $1.75 $2.16 $(.39) $(1.44) $(1.83) $24.75 8.85% $46,917 .59% 1.62%Year ended 12/31/2013 20.40 .36 4.04 4.40 (.38) — (.38) 24.42 21.73 42,735 .61 1.62Year ended 12/31/2012 18.21 .38 2.19 2.57 (.38) — (.38) 20.40 14.19 34,272 .63 1.94Year ended 12/31/2011 17.93 .36 .32 .68 (.40) — (.40) 18.21 3.82 30,716 .62 1.97Year ended 12/31/2010 16.21 .40 1.68 2.08 (.36) — (.36) 17.93 13.02 31,409 .63 2.42Class B:Year ended 12/31/2014 24.37 .22 1.74 1.96 (.18) (1.44) (1.62) 24.71 8.05 541 1.34 .87Year ended 12/31/2013 20.35 .19 4.03 4.22 (.20) — (.20) 24.37 20.81 821 1.36 .86Year ended 12/31/2012 18.16 .23 2.19 2.42 (.23) — (.23) 20.35 13.35 1,123 1.38 1.17Year ended 12/31/2011 17.87 .22 .33 .55 (.26) — (.26) 18.16 3.08 1,745 1.38 1.21Year ended 12/31/2010 16.16 .28 1.66 1.94 (.23) — (.23) 17.87 12.12 2,573 1.38 1.66Class C:Year ended 12/31/2014 24.30 .21 1.75 1.96 (.19) (1.44) (1.63) 24.63 8.03 5,574 1.39 .83Year ended 12/31/2013 20.31 .19 4.00 4.19 (.20) — (.20) 24.30 20.72 5,247 1.41 .83Year ended 12/31/2012 18.13 .22 2.18 2.40 (.22) — (.22) 20.31 13.30 4,334 1.42 1.14Year ended 12/31/2011 17.85 .21 .32 .53 (.25) — (.25) 18.13 3.00 4,247 1.42 1.17Year ended 12/31/2010 16.14 .27 1.67 1.94 (.23) — (.23) 17.85 12.11 4,576 1.43 1.61Class F-1:Year ended 12/31/2014 24.41 .39 1.75 2.14 (.37) (1.44) (1.81) 24.74 8.80 2,841 .65 1.57Year ended 12/31/2013 20.39 .36 4.03 4.39 (.37) — (.37) 24.41 21.70 2,471 .66 1.58Year ended 12/31/2012 18.21 .38 2.18 2.56 (.38) — (.38) 20.39 14.13 1,500 .64 1.94Year ended 12/31/2011 17.92 .36 .33 .69 (.40) — (.40) 18.21 3.87 1,014 .63 1.96Year ended 12/31/2010 16.21 .40 1.67 2.07 (.36) — (.36) 17.92 12.95 895 .63 2.41Class F-2:Year ended 12/31/2014 24.41 .46 1.75 2.21 (.44) (1.44) (1.88) 24.74 9.08 1,869 .39 1.83Year ended 12/31/2013 20.39 .41 4.04 4.45 (.43) — (.43) 24.41 21.99 768 .41 1.83Year ended 12/31/2012 18.21 .43 2.18 2.61 (.43) — (.43) 20.39 14.40 419 .40 2.18Year ended 12/31/2011 17.92 .40 .33 .73 (.44) — (.44) 18.21 4.12 277 .40 2.19Year ended 12/31/2010 16.21 .44 1.67 2.11 (.40) — (.40) 17.92 13.21 228 .40 2.63Class 529-A:Year ended 12/31/2014 24.39 .38 1.75 2.13 (.36) (1.44) (1.80) 24.72 8.76 2,831 .68 1.53Year ended 12/31/2013 20.38 .34 4.03 4.37 (.36) — (.36) 24.39 21.60 2,599 .70 1.53Year ended 12/31/2012 18.19 .36 2.19 2.55 (.36) — (.36) 20.38 14.12 2,101 .71 1.86Year ended 12/31/2011 17.91 .34 .33 .67 (.39) — (.39) 18.19 3.75 1,751 .70 1.89Year ended 12/31/2010 16.19 .39 1.68 2.07 (.35) — (.35) 17.91 12.97 1,589 .69 2.35Class 529-B:Year ended 12/31/2014 24.41 .19 1.75 1.94 (.15) (1.44) (1.59) 24.76 7.94 73 1.46 .75Year ended 12/31/2013 20.39 .17 4.02 4.19 (.17) — (.17) 24.41 20.63 108 1.49 .74Year ended 12/31/2012 18.19 .21 2.19 2.40 (.20) — (.20) 20.39 13.24 134 1.50 1.05Year ended 12/31/2011 17.90 .20 .33 .53 (.24) — (.24) 18.19 2.95 180 1.49 1.09Year ended 12/31/2010 16.19 .26 1.66 1.92 (.21) — (.21) 17.90 11.99 244 1.48 1.56<strong>American</strong> <strong>Balanced</strong> <strong>Fund</strong> 27 2
Financial highlights (continued)Income (loss) frominvestment operations 1Dividends and distributionsNet assetvalue,beginningof periodNetinvestmentincome(loss) 2Net gains(losses) onsecurities(bothrealized andunrealized)Total frominvestmentoperationsDividends(from netinvestmentincome)Distributions(from capitalgains)TotaldividendsanddistributionsNet assetvalue,endof periodTotalreturn 3,4Net assets,end of period(in millions)Ratio ofexpenses toaveragenet assetsRatio ofnet income(loss) toaveragenet assets 2Class 529-C:Year ended 12/31/2014 $24.38 $.19 $1.74 $1.93 $(.17) $(1.44) $(1.61) $24.70 7.90% $ 905 1.46% .76%Year ended 12/31/2013 20.37 .17 4.03 4.20 (.19) — (.19) 24.38 20.68 841 1.48 .76Year ended 12/31/2012 18.19 .21 2.18 2.39 (.21) — (.21) 20.37 13.19 694 1.49 1.08Year ended 12/31/2011 17.90 .20 .33 .53 (.24) — (.24) 18.19 3.00 607 1.48 1.11Year ended 12/31/2010 16.19 .26 1.67 1.93 (.22) — (.22) 17.90 12.03 583 1.48 1.57Class 529-E:Year ended 12/31/2014 24.38 .32 1.75 2.07 (.30) (1.44) (1.74) 24.71 8.50 144 .93 1.28Year ended 12/31/2013 20.37 .29 4.02 4.31 (.30) — (.30) 24.38 21.31 134 .95 1.29Year ended 12/31/2012 18.18 .31 2.19 2.50 (.31) — (.31) 20.37 13.84 112 .97 1.60Year ended 12/31/2011 17.90 .30 .32 .62 (.34) — (.34) 18.18 3.47 98 .97 1.62Year ended 12/31/2010 16.19 .35 1.66 2.01 (.30) — (.30) 17.90 12.59 92 .97 2.07Class 529-F-1:Year ended 12/31/2014 24.37 .44 1.76 2.20 (.42) (1.44) (1.86) 24.71 9.05 111 .46 1.76Year ended 12/31/2013 20.36 .39 4.03 4.42 (.41) — (.41) 24.37 21.88 101 .48 1.76Year ended 12/31/2012 18.18 .41 2.18 2.59 (.41) — (.41) 20.36 14.32 82 .49 2.09Year ended 12/31/2011 17.90 .38 .33 .71 (.43) — (.43) 18.18 3.98 61 .48 2.11Year ended 12/31/2010 16.19 .43 1.67 2.10 (.39) — (.39) 17.90 13.15 57 .47 2.57Class R-1:Year ended 12/31/2014 24.28 .21 1.75 1.96 (.19) (1.44) (1.63) 24.61 8.05 158 1.38 .83Year ended 12/31/2013 20.29 .19 4.01 4.20 (.21) — (.21) 24.28 20.76 151 1.39 .84Year ended 12/31/2012 18.12 .23 2.17 2.40 (.23) — (.23) 20.29 13.28 121 1.40 1.16Year ended 12/31/2011 17.83 .22 .33 .55 (.26) — (.26) 18.12 3.09 126 1.40 1.19Year ended 12/31/2010 16.13 .27 1.66 1.93 (.23) — (.23) 17.83 12.10 135 1.40 1.65Class R-2:Year ended 12/31/2014 24.30 .21 1.74 1.95 (.19) (1.44) (1.63) 24.62 8.03 1,308 1.36 .86Year ended 12/31/2013 20.30 .20 4.02 4.22 (.22) — (.22) 24.30 20.87 1,304 1.34 .90Year ended 12/31/2012 18.13 .23 2.18 2.41 (.24) — (.24) 20.30 13.31 1,158 1.37 1.20Year ended 12/31/2011 17.85 .22 .32 .54 (.26) — (.26) 18.13 3.05 1,079 1.38 1.21Year ended 12/31/2010 16.14 .27 1.67 1.94 (.23) — (.23) 17.85 12.14 1,128 1.40 1.64Class R-2E:Period from 8/29/2014to 12/31/2014 5,6 25.81 .15 .41 .56 (.21) (1.41) (1.62) 24.75 2.17 — 7 .16 4,8 .58 4,8Class R-3:Year ended 12/31/2014 24.32 .32 1.75 2.07 (.30) (1.44) (1.74) 24.65 8.51 3,315 .94 1.28Year ended 12/31/2013 20.32 .29 4.02 4.31 (.31) — (.31) 24.32 21.33 3,212 .94 1.30Year ended 12/31/2012 18.14 .32 2.18 2.50 (.32) — (.32) 20.32 13.83 2,617 .95 1.62Year ended 12/31/2011 17.86 .30 .32 .62 (.34) — (.34) 18.14 3.50 2,331 .95 1.64Year ended 12/31/2010 16.15 .35 1.67 2.02 (.31) — (.31) 17.86 12.64 2,408 .94 2.1028 2 <strong>American</strong> <strong>Balanced</strong> <strong>Fund</strong>
Income (loss) frominvestment operations 1Dividends and distributionsNet assetvalue,beginningof periodNetinvestmentincome(loss) 2Net gains(losses) onsecurities(bothrealized andunrealized)Total frominvestmentoperationsDividends(from netinvestmentincome)Distributions(from capitalgains)TotaldividendsanddistributionsNet assetvalue,endof periodTotalreturn 3,4Net assets,end of period(in millions)Ratio ofexpenses toaveragenet assetsRatio ofnet income(loss) toaveragenet assets 2Class R-4:Year ended 12/31/2014 $24.38 $.40 $1.75 $2.15 $(.37) $(1.44) $(1.81) $24.72 8.85% $4,385 .64% 1.58%Year ended 12/31/2013 20.37 .36 4.02 4.38 (.37) — (.37) 24.38 21.68 3,994 .65 1.60Year ended 12/31/2012 18.19 .38 2.18 2.56 (.38) — (.38) 20.37 14.14 3,006 .64 1.94Year ended 12/31/2011 17.91 .35 .33 .68 (.40) — (.40) 18.19 3.80 2,152 .65 1.94Year ended 12/31/2010 16.19 .40 1.68 2.08 (.36) — (.36) 17.91 13.01 2,007 .65 2.39Class R-5:Year ended 12/31/2014 24.43 .47 1.76 2.23 (.45) (1.44) (1.89) 24.77 9.16 2,616 .34 1.88Year ended 12/31/2013 20.41 .43 4.03 4.46 (.44) — (.44) 24.43 22.04 2,492 .34 1.89Year ended 12/31/2012 18.22 .44 2.19 2.63 (.44) — (.44) 20.41 14.51 2,050 .35 2.23Year ended 12/31/2011 17.94 .41 .32 .73 (.45) — (.45) 18.22 4.11 1,544 .35 2.24Year ended 12/31/2010 16.22 .45 1.68 2.13 (.41) — (.41) 17.94 13.32 1,545 .35 2.69Class R-6:Year ended 12/31/2014 24.42 .49 1.75 2.24 (.46) (1.44) (1.90) 24.76 9.22 6,076 .29 1.93Year ended 12/31/2013 20.40 .44 4.03 4.47 (.45) — (.45) 24.42 22.12 3,910 .29 1.95Year ended 12/31/2012 18.21 .45 2.19 2.64 (.45) — (.45) 20.40 14.57 2,151 .30 2.28Year ended 12/31/2011 17.93 .42 .32 .74 (.46) — (.46) 18.21 4.16 1,486 .30 2.30Year ended 12/31/2010 16.21 .46 1.67 2.13 (.41) — (.41) 17.93 13.38 1,063 .30 2.75Portfolio turnover rate for all share classes 9 Year ended December 312014 2013 2012 2011 2010Including mortgage dollar roll transactions 68% 55% 54% 47% 37%Excluding mortgage dollar roll transactions 48% Not available1 Based on average shares outstanding.2 For the year ended December 31, 2010, this column reflects the impact of a corporate action event that resulted in a one-time increase to net investment income.If the corporate action event had not occurred, the Class A net investment income per share and ratio of net income to average net assets would have been lowerby $.04 and .25 percentage points, respectively. The impact to the other share classes would have been similar.3Total returns exclude any applicable sales charges, including contingent deferred sales charges.4 Not annualized.5Based on operations for the period shown and, accordingly, is not representative of a full year.6Class R-2E shares were offered beginning August 29, 2014.7Amount less than $1 million.8 Class R-2E assets consisted solely of seed capital invested by CRMC; therefore, certain fees were not accrued.9Refer to Note 5 for further information on mortgage dollar rolls.See Notes to Financial Statements<strong>American</strong> <strong>Balanced</strong> <strong>Fund</strong> 29 2
<strong>Report</strong> of Independent Registered Public Accounting FirmTo the Shareholders and Board of Trustees of <strong>American</strong> <strong>Balanced</strong> <strong>Fund</strong>:We have audited the accompanying statement of assets and liabilities of <strong>American</strong> <strong>Balanced</strong> <strong>Fund</strong> (the “<strong>Fund</strong>”), including the summaryinvestment portfolio, as of December 31, 2014, and the related statement of operations for the year then ended, the statements ofchanges in net assets for each of the two years in the period then ended, and the financial highlights for each of the periods presented.These financial statements and financial highlights are the responsibility of the <strong>Fund</strong>’s management. Our responsibility is to express anopinion on these financial statements and financial highlights based on our audits.We conducted our audits in accordance with the standards of the Public Company Accounting Oversight Board (United States). Thosestandards require that we plan and perform the audit to obtain reasonable assurance about whether the financial statements and financialhighlights are free of material misstatement. The <strong>Fund</strong> is not required to have, nor were we engaged to perform, an audit of its internalcontrol over financial reporting. Our audits included consideration of internal control over financial reporting as a basis for designingaudit procedures that are appropriate in the circumstances, but not for the purpose of expressing an opinion on the effectiveness of the<strong>Fund</strong>’s internal control over financial reporting. Accordingly, we express no such opinion. An audit also includes examining, on a testbasis, evidence supporting the amounts and disclosures in the financial statements, assessing the accounting principles used andsignificant estimates made by management, as well as evaluating the overall financial statement presentation. Our procedures includedconfirmation of securities owned as of December 31, 2014, by correspondence with the custodian and brokers; where replies were notreceived from brokers, we performed other auditing procedures. We believe that our audits provide a reasonable basis for our opinion.In our opinion, such financial statements and financial highlights referred to above present fairly, in all material respects, the financialposition of <strong>American</strong> <strong>Balanced</strong> <strong>Fund</strong> as of December 31, 2014, the results of its operations for the year then ended, the changes in its netassets for each of the two years in the period then ended, and the financial highlights for each of the periods presented, in conformitywith accounting principles generally accepted in the United States of America.Deloitte & Touche LLPCosta Mesa, CaliforniaFebruary 10, 201530 3 <strong>American</strong> <strong>Balanced</strong> <strong>Fund</strong>
Expense exampleunauditedAs a fund shareholder, you incur two typesof costs: (1) transaction costs, such as initialsales charges on purchase payments andcontingent deferred sales charges onredemptions (loads), and (2) ongoing costs,including management fees, distributionand service (12b-1) fees, and otherexpenses. This example is intended to helpyou understand your ongoing costs (indollars) of investing in the fund so you cancompare these costs with the ongoingcosts of investing in other mutual funds.The example is based on an investment of$1,000 invested at the beginning of theperiod and held for the entire six-monthperiod (July 1, 2014, throughDecember 31, 2014).Actual expenses:The first line of each share class in the table on the following page provides informationabout actual account values and actual expenses. You may use the information in this line,together with the amount you invested, to estimate the expenses that you paid over theperiod. Simply divide your account value by $1,000 (for example, an $8,600 account valuedivided by $1,000 = 8.6), then multiply the result by the number in the first line under theheading entitled “Expenses paid during period” to estimate the expenses you paid onyour account during this period.Hypothetical example for comparison purposes:The second line of each share class in the table on the following page providesinformation about hypothetical account values and hypothetical expenses based on theactual expense ratio for the share class and an assumed rate of return of 5.00% per yearbefore expenses, which is not the actual return of the share class. The hypothetical accountvalues and expenses may not be used to estimate the actual ending account balance orexpenses you paid for the period. You may use this information to compare the ongoingcosts of investing in the fund and other funds. To do so, compare this 5.00% hypotheticalexample with the 5.00% hypothetical examples that appear in the shareholder reports ofthe other funds.Notes:Retirement plan participants may be subject to certain fees charged by the plan sponsor,and Class F-1, F-2 and 529-F-1 shareholders may be subject to fees charged by financialintermediaries, typically ranging from 0.75% to 1.50% of assets annually depending onservices offered. You can estimate the impact of these fees by adding the amount of thefees to the total estimated expenses you paid on your account during the period ascalculated above. In addition, your ending account value would be lower by the amount ofthese fees.Note that the expenses shown in the table on the following page are meant to highlightyour ongoing costs only and do not reflect any transactional costs, such as sales charges(loads). Therefore, the second line of each share class in the table is useful in comparingongoing costs only and will not help you determine the relative total costs of owningdifferent funds. In addition, if these transactional costs were included, your costs wouldhave been higher.<strong>American</strong> <strong>Balanced</strong> <strong>Fund</strong> 31 3
Beginningaccount value7/1/2014Endingaccount value12/31/2014Expenses paidduring period*<strong>Annual</strong>izedexpense ratioClass A - actual return $1,000.00 $1,037.74 $3.03 .59%Class A - assumed 5% return 1,000.00 1,022.23 3.01 .59Class B - actual return 1,000.00 1,034.09 6.82 1.33Class B - assumed 5% return 1,000.00 1,018.50 6.77 1.33Class C - actual return 1,000.00 1,033.82 7.07 1.38Class C - assumed 5% return 1,000.00 1,018.25 7.02 1.38Class F-1 - actual return 1,000.00 1,037.87 3.34 .65Class F-1 - assumed 5% return 1,000.00 1,021.93 3.31 .65Class F-2 - actual return 1,000.00 1,038.86 1.95 .38Class F-2 - assumed 5% return 1,000.00 1,023.29 1.94 .38Class 529-A - actual return 1,000.00 1,037.72 3.49 .68Class 529-A - assumed 5% return 1,000.00 1,021.78 3.47 .68Class 529-B - actual return 1,000.00 1,033.71 7.48 1.46Class 529-B - assumed 5% return 1,000.00 1,017.85 7.43 1.46Class 529-C - actual return 1,000.00 1,033.35 7.43 1.45Class 529-C - assumed 5% return 1,000.00 1,017.90 7.37 1.45Class 529-E - actual return 1,000.00 1,036.46 4.77 .93Class 529-E - assumed 5% return 1,000.00 1,020.52 4.74 .93Class 529-F-1 - actual return 1,000.00 1,038.88 2.31 .45Class 529-F-1 - assumed 5% return 1,000.00 1,022.94 2.29 .45Class R-1 - actual return 1,000.00 1,034.28 7.08 1.38Class R-1 - assumed 5% return 1,000.00 1,018.25 7.02 1.38Class R-2 - actual return 1,000.00 1,033.99 6.87 1.34Class R-2 - assumed 5% return 1,000.00 1,018.45 6.82 1.34Class R-2E - actual return † 1,000.00 1,021.66 1.68 .49Class R-2E - assumed 5% return † 1,000.00 1,022.74 2.50 .49Class R-3 - actual return 1,000.00 1,036.48 4.77 .93Class R-3 - assumed 5% return 1,000.00 1,020.52 4.74 .93Class R-4 - actual return 1,000.00 1,037.92 3.29 .64Class R-4 - assumed 5% return 1,000.00 1,021.98 3.26 .64Class R-5 - actual return 1,000.00 1,039.37 1.75 .34Class R-5 - assumed 5% return 1,000.00 1,023.49 1.73 .34Class R-6 - actual return 1,000.00 1,039.67 1.49 .29Class R-6 - assumed 5% return 1,000.00 1,023.74 1.48 .29*The “expenses paid during period” are equal to the “annualized expense ratio,” multiplied by the average account value over the period, multiplied by thenumber of days in the period, and divided by 365 (to reflect the one-half year period).† The period for the ”annualized expense ratio” and ”actual return” line is based on the number of days since the initial sale of the share class on August 29, 2014.The ”assumed 5% return” line is based on 184 days.Tax informationunauditedWe are required to advise you of the federal tax status of certain distributions received by shareholders during the fiscal year. The fundhereby designates the following amounts for the fund’s fiscal year ended December 31, 2014:Long-term capital gains $4,365,643,000Qualified dividend income 100%Corporate dividends received deduction $994,887,000U.S. government income that may be exempt from state taxation $68,054,000Individual shareholders should refer to their Form 1099 or other tax information, which was mailed in January 2015, to determine thecalendar year amounts to be included on their 2014 tax returns. Shareholders should consult their tax advisors.32 <strong>American</strong> <strong>Balanced</strong> <strong>Fund</strong>
Approval of Investment Advisory and Service AgreementThe <strong>American</strong> <strong>Balanced</strong> <strong>Fund</strong>‘s boardhas approved the fund’s InvestmentAdvisory and Service Agreement (the“agreement”) with Capital Researchand Management Company (“CRMC”)for an additional period throughJanuary 31, 2016. The agreement wasamended to add additional advisoryfee breakpoints if and when thefund’s net assets exceed $89 billion.The board approved the agreementfollowing the recommendation ofthe fund’s Contracts Committee (the“committee”), which is composedof all of the fund’s independentboard members. The board and thecommittee determined that the fund’sadvisory fee structure was fair andreasonable in relation to the servicesprovided, and that approving theagreement was in the best interestsof the fund and its shareholders.In reaching this decision, the boardand the committee took into accountinformation furnished to themthroughout the year and otherwiseprovided to them, as well as informationprepared specifically in connection withtheir review of the agreement, and wereadvised by their independent counsel.They considered the following factors,among others, but did not identifyany single issue or particular piece ofinformation that, in isolation, was thecontrolling factor, and each board andcommittee member did not necessarilyattribute the same weight to each factor.1. Nature, extent and quality of servicesThe board and the committee considered the depth and quality of CRMC’s investmentmanagement process, including its global research capabilities; the experience,capability and integrity of its senior management and other personnel; the low turnoverrates of its key personnel; the overall financial strength and stability of CRMC andthe Capital Group organization; and the ongoing evolution of CRMC’s organizationalstructure designed to maintain and strengthen these qualities. The board and thecommittee also considered the nature, extent and quality of administrative, complianceand shareholder services provided by CRMC to the fund under the agreement andother agreements, as well as the benefits to fund shareholders from investing in a fundthat is part of a large family of funds. The board and the committee concluded that thenature, extent and quality of the services provided by CRMC have benefited and shouldcontinue to benefit the fund and its shareholders.2. Investment resultsThe board and the committee considered the investment results of the fund in light ofits objectives of providing conservation of capital, current income and long-term growthof capital and income. They compared the fund’s investment results with those of otherrelevant funds (including funds that form the basis of the Lipper index for the categoryin which the fund is included), and data such as relevant market and fund indexes, overvarious periods through June 30, 2014. This report, including the letter to shareholdersand related disclosures, contains certain information about the fund’s investment results.The board and the committee reviewed the fund’s investment results measured againstvarious indexes, including the Lipper <strong>Balanced</strong> <strong>Fund</strong>s Index, the S&P 500 Index, theBarclays U.S. Aggregate Index and a customized index that is 60% S&P 500 Index and40% Barclays U.S. Aggregate Index (adjusted for <strong>Fund</strong> expenses). They noted that theinvestment results of the fund generally exceeded those of these indexes for the lifetime,20-year, 10-year and five-year periods, except for the S&P 500 Index. They also notedthat the volatility of the fund’s monthly returns for such periods was at or near that of theLipper <strong>Balanced</strong> <strong>Fund</strong>s Index and less than that of the S&P 500 Index. The board andthe committee concluded that the fund’s investment results have been satisfactory forrenewal of the agreement and that CRMC’s record in managing the fund indicated thatits continued management should benefit the fund and its shareholders.3. Advisory fees and total expensesThe board and the committee compared the advisory fees and total expense levels ofthe fund to those of other relevant funds. They observed that the fund’s advisory feesand expenses generally compared favorably to those of other similar funds includedin the Lipper <strong>Balanced</strong> <strong>Fund</strong>s category. The board and the committee also consideredthe breakpoint discounts in the fund’s advisory fee structure that reduce the level offees charged by CRMC to the fund as fund assets increase. In addition, they reviewedinformation regarding the effective advisory fees charged to non-mutual fund clientsby CRMC and its affiliates. They noted that, to the extent there were differencesbetween the advisory fees paid by the fund and the advisory fees paid by those clients,the differences appropriately reflected the investment, operational and regulatorydifferences between advising the fund and the other clients. The board and thecommittee concluded that the fund’s cost structure was fair and reasonable in relationto the services provided, and that the fund’s shareholders receive reasonable value inreturn for the advisory fees and other amounts paid to CRMC by the fund.<strong>American</strong> <strong>Balanced</strong> <strong>Fund</strong> 33
4. Ancillary benefitsThe board and the committee considered a variety of other benefits that CRMC and itsaffiliates receive as a result of CRMC’s relationship with the fund and the other <strong>American</strong><strong>Fund</strong>s, including fees for administrative services provided to certain share classes; feespaid to CRMC’s affiliated transfer agent; sales charges and distribution fees receivedand retained by the fund’s principal underwriter, an affiliate of CRMC; and possibleancillary benefits to CRMC and its institutional management affiliates in managingother investment vehicles. The board and the committee reviewed CRMC’s portfoliotrading practices, noting that while CRMC received the benefit of research provided bybroker-dealers executing portfolio transactions on behalf of the fund, it did not obtainthird-party research or other services in return for allocating brokerage to such brokerdealers.The board and the committee took these ancillary benefits into account inevaluating the reasonableness of the advisory fees and other amounts paid to CRMCby the fund.5. Adviser financial informationThe board and the committee reviewed information regarding CRMC’s costs ofproviding services to the <strong>American</strong> <strong>Fund</strong>s, including personnel, systems and resourcesof investment, compliance, trading, accounting and other administrative operations.They considered CRMC’s costs and willingness to invest in technology, infrastructureand staff to maintain and expand services and capabilities, respond to industry andregulatory developments, and attract and retain qualified personnel. They notedinformation regarding the compensation structure for CRMC’s investment professionals.The board and the committee also compared CRMC’s profitability and compensationdata to the reported results and data of several large, publicly held investmentmanagement companies. The board and the committee noted the competitiveness andcyclicality of both the mutual fund industry and the capital markets, and the importancein that environment of CRMC’s long-term profitability for maintaining its independence,company culture and management continuity. They further considered the breakpointdiscounts in the fund’s advisory fee structure. The board and the committee concludedthat the fund’s advisory fee structure reflected a reasonable sharing of benefits betweenCRMC and the fund’s shareholders.34 <strong>American</strong> <strong>Balanced</strong> <strong>Fund</strong>
Board of trustees and other officersIndependent trustees 1 <strong>American</strong> <strong>Balanced</strong> <strong>Fund</strong> 35Year firstNumber ofelectedportfolios in funda trustee complex overseen Other directorships 3Name and year of birth of the fund 2 Principal occupation(s) during past five years by trustee held by trusteeWilliam H. Baribault, 1945 2012 CEO and President, Richard Nixon Foundation; former 72 NoneChairman of the Board and CEO, Oakwood Enterprises(private investment and consulting)Vanessa C. L. Chang, 1952 2012 Director, EL & EL Investments (real estate) 7 Edison International;Transocean Ltd.Linda Griego, 1947 2012 President and CEO, Griego Enterprises, Inc. 4 AECOM Technology(business management company)Corporation;CBS CorporationLeonade D. Jones, 1947 1993 Retired; former Treasurer, The Washington Post 10 NoneCompany (retired 1996)William D. Jones, 1955 2008 Real estate developer/owner, President and CEO, 8 Sempra EnergyCityLink Investment Corporation (acquires, developsand manages real estate ventures in selected urbancommunities) and City Scene Management Company(provides commercial asset and property managementservices)James J. Postl, 1946 2007 Retired; former President and CEO, Pennzoil-Quaker 4 Pulte, Inc.State Company (automotive products and services)(retired 2002)Margaret Spellings, 1957 2012 President, George W. Bush Foundation; former 72 NonePresident and CEO, Margaret Spellings & Company(public policy and strategic consulting); formerPresident, U.S. Chamber Foundation and SeniorAdvisor to the President and CEO, U.S. Chamber ofCommerceIsaac Stein, 1946 2004 President, Waverley Associates (private investment 4 Alexza Pharmaceuticals, Inc.;Chairman of the Board fund); Chairman Emeritus of the Board of Trustees, Maxygen, Inc.(Independent and Non-Executive)Stanford UniversityInterested trustee 4,5 Year firstelectedNumber ofa trustee Principal occupation(s) during past five years portfolios in fundName, year of birth and or officer and positions held with affiliated entities or complex overseen Other directorships 3position with fund of the fund 2 the principal underwriter of the fund by trustee held by trusteeGregory D. Johnson, 1963 2003 Partner — Capital World Investors, Capital Research and 1 NoneVice Chairman of the BoardManagement Companyand PresidentThe fund’s statement of additional information includes further details about fund trustees and is available without charge upon request by calling<strong>American</strong> <strong>Fund</strong>s Service Company at (800) 421-4225 or by visiting the <strong>American</strong> <strong>Fund</strong>s website at americanfunds.com. The address for all trusteesand officers of the fund is 333 South Hope Street, Los Angeles, CA 90071, Attention: Secretary.See page 36 for footnotes.
Other officers 5Year firstelectedName, year of birth and an officer Principal occupation(s) during past five years and positions held with affiliated entitiesposition with fund of the fund 2 or the principal underwriter of the fundHilda L. Applbaum, 1961 1999 Partner — Capital World Investors, Capital Research and Management CompanySenior Vice PresidentJeffrey T. Lager, 1968 2002 Partner — Capital World Investors, Capital Research and Management Company;Senior Vice President Director, <strong>American</strong> <strong>Fund</strong>s Service Company 6James R. Mulally, 1952 2009 Partner — Capital Fixed Income Investors, Capital Research and Management CompanySenior Vice PresidentPaul F. Roye, 1953 2007 Senior Vice President — <strong>Fund</strong> Business Management Group, Capital Research and Management Company;Senior Vice President Director, <strong>American</strong> <strong>Fund</strong>s Service Company 6John H. Smet, 1956 2000 Partner — Capital Fixed Income Investors, Capital Research and Management Company;Senior Vice PresidentDirector, Capital Research and Management CompanyPaul R. Benjamin, 1979 2014 Vice President — Capital World Investors, Capital Research and Management CompanyVice PresidentAlan N. Berro, 1960 2010 Partner — Capital World Investors, Capital Research and Management CompanyVice PresidentDonald H. Rolfe, 1972 2012 Chief Compliance Officer, Capital Research Company 6 ; Chief Compliance Officer, Capital Research andVice PresidentManagement Company; Vice President and Senior Counsel — <strong>Fund</strong> Business Management Group,Capital Research and Management CompanyRichmond A. Wolf, 1970 2014 Vice President — Capital World Investors, Capital Research and Management CompanyVice PresidentMichael W. Stockton, 1967 2014 Vice President — <strong>Fund</strong> Business Management Group, Capital Research and Management CompanySecretaryJeffrey P. Regal, 1971 2011 Vice President — Investment Operations, Capital Research and Management CompanyTreasurerViviane T. Russo, 1981 2014 Associate — <strong>Fund</strong> Business Management Group, Capital Research and Management CompanyAssistant SecretaryDori Laskin, 1951 2011 Vice President — Investment Operations, Capital Research and Management CompanyAssistant TreasurerAri M. Vinocor, 1974 2012 Vice President — Investment Operations, Capital Research and Management CompanyAssistant Treasurer1The term independent trustee refers to a trustee who is not an “interested person” of the fund within the meaning of the Investment Company Act of 1940.2Trustees and officers of the fund serve until their resignation, removal or retirement.3This includes all directorships/trusteeships (other than those in the <strong>American</strong> <strong>Fund</strong>s or other funds managed by Capital Research and ManagementCompany or its affiliates) that are held by each trustee as a trustee or director of a public company or a registered investment company.4The term interested trustee refers to a trustee who is an “interested person” within the meaning of the Investment Company Act of 1940, on the basisof their affiliation with the fund’s investment adviser, Capital Research and Management Company, or affiliated entities (including the fund’s principalunderwriter).5All of the directors/trustees and/or officers listed, except Paul R. Benjamin, James R. Mulally and Richmond A. Wolf, are officers and/or directors/trustees ofone or more of the other funds for which Capital Research and Management Company serves as investment adviser.6Company affiliated with Capital Research and Management Company.36 <strong>American</strong> <strong>Balanced</strong> <strong>Fund</strong>
Office of the fund6455 Irvine Center DriveIrvine, CA 92618-4518Investment adviserCapital Research and Management Company333 South Hope StreetLos Angeles, CA 90071-14066455 Irvine Center DriveIrvine, CA 92618-4518Transfer agent for shareholder accounts<strong>American</strong> <strong>Fund</strong>s Service Company(Write to the address near you.)P.O. Box 6007Indianapolis, IN 46206-6007P.O. Box 2280Norfolk, VA 23501-2280Custodian of assetsJPMorgan Chase Bank270 Park AvenueNew York, NY 10017-2070CounselMorgan, Lewis & Bockius LLP355 South Grand Avenue, Suite 4400Los Angeles, CA 90071-3106Independent registered publicaccounting firmDeloitte & Touche LLP695 Town Center DriveSuite 1200Costa Mesa, CA 92626-7188Principal underwriter<strong>American</strong> <strong>Fund</strong>s Distributors, Inc.333 South Hope StreetLos Angeles, CA 90071-1406Investors should carefully consider investment objectives, risks, chargesand expenses. This and other important information is contained in the fundprospectus and summary prospectus, which can be obtained from your financialprofessional and should be read carefully before investing. You may also call<strong>American</strong> <strong>Fund</strong>s Service Company (AFS) at (800) 421-4225 or visit the <strong>American</strong><strong>Fund</strong>s website at americanfunds.com.“<strong>American</strong> <strong>Fund</strong>s Proxy Voting Procedures and Principles” — which describes how we voteproxies relating to portfolio securities — is available on the <strong>American</strong> <strong>Fund</strong>s website orupon request by calling AFS. The fund files its proxy voting record with the U.S. Securitiesand Exchange Commission (SEC) for the 12 months ended June 30 by August 31. Theproxy voting record is available free of charge on the SEC website at sec.gov and on the<strong>American</strong> <strong>Fund</strong>s website.A complete December 31, 2014, portfolio of <strong>American</strong> <strong>Balanced</strong> <strong>Fund</strong>’s investmentsis available free of charge by calling AFS or visiting the SEC website (where it is part ofForm N-CSR).<strong>American</strong> <strong>Balanced</strong> <strong>Fund</strong> files a complete list of its portfolio holdings with the SEC forthe first and third quarters of each fiscal year on Form N-Q. This filing is available freeof charge on the SEC website. You may also review or, for a fee, copy this filing at theSEC’s Public Reference Room in Washington, D.C. Additional information regarding theoperation of the Public Reference Room may be obtained by calling the SEC’s Office ofInvestor Education and Advocacy at (800) SEC-0330. Additionally, the list of portfolioholdings is available by calling AFS.This report is for the information of shareholders of <strong>American</strong> <strong>Balanced</strong> <strong>Fund</strong>, but italso may be used as sales literature when preceded or accompanied by the currentprospectus or summary prospectus, which gives details about charges, expenses,investment objectives and operating policies of the fund. If used as sales material afterMarch 31, 2015, this report must be accompanied by an <strong>American</strong> <strong>Fund</strong>s statisticalupdate for the most recently completed calendar quarter.
The <strong>American</strong> <strong>Fund</strong>s AdvantageSince 1931, <strong>American</strong> <strong>Fund</strong>s, part of Capital Group, has helpedinvestors pursue long-term investment success. Our consistentapproach — in combination with The Capital System SM — hasresulted in a superior long-term track record.Aligned withinvestor successWe base our decisions ona long-term perspective,which we believe alignsour goals with theinterests of our clients.Our portfolio managersaverage 27 years ofinvestment experience,including 22 years at ourcompany, reflecting acareer commitment to ourlong-term approach. 1The CapitalSystem SMOur investment process,The Capital System,combines individualaccountability withteam work. Each fund isdivided into portions thatare managed independentlyby investmentprofessionals with diversebackgrounds, ages andinvestment approaches.An extensive globalresearch effort is thebackbone of our system.Superior long-termtrack recordOur equity funds havebeaten their Lipper peerindexes in 91% of 10-yearperiods and 96% of20-year periods. Ourfixed-income funds havebeaten their Lipperindexes in 54% of 10-yearperiods and 57% of20-year periods. 2 Ourfund management feeshave been among thelowest in the industry. 31Portfolio manager experience as of December 31, 2014.2Based on Class A share results for rolling periods through December 31, 2014. Periods coveredare the shorter of the fund’s lifetime or since the comparable Lipper index inception date(except SMALLCAP World <strong>Fund</strong>, for which the Lipper average was used).3On average, our management fees were in the lowest quintile 70% of the time, based on the20-year period ended December 31, 2014, versus comparable Lipper categories, excludingfunds of funds.Printed on paper containing 10% post-consumer waste Printed with inks containing soy and/or vegetable oilLit. No. MFGEARX-011-0215P Litho in USA AGD/Q/8050-S42847