NSP System: 10-Year Transmission Plan / 20-Year ... - Xcel Energy
NSP System: 10-Year Transmission Plan / 20-Year ... - Xcel Energy
NSP System: 10-Year Transmission Plan / 20-Year ... - Xcel Energy

You also want an ePaper? Increase the reach of your titles
YUMPU automatically turns print PDFs into web optimized ePapers that Google loves.
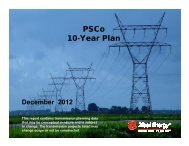
<strong>NSP</strong> <strong>System</strong>:<strong>10</strong>-<strong>Year</strong><strong>Transmission</strong> <strong>Plan</strong> /<strong>20</strong>-<strong>Year</strong> ScenarioAssessmentDecember <strong>20</strong>11This report contains transmission planning datathat may be conceptual in nature and is subjectto change. The transmission projects listed maychange scope or not be constructed
Purpose and Scope• The purpose of this document is to present thetransmission plans and needs on the <strong>NSP</strong>M/<strong>NSP</strong>Wintegrated transmission system (<strong>NSP</strong> <strong>System</strong>) lookingforward <strong>10</strong>-<strong>20</strong> years• Scope of work:• Perform an annual assessment and update of the <strong>NSP</strong><strong>System</strong> transmission assets– NERC reliability standards compliance requirements– Load forecast (<strong>20</strong>11) ( including wholesale)– Resource plan (<strong>20</strong>11)– MN Renewable <strong>Energy</strong> Standard– Regional Delivery of Wind Generation• Stakeholder input• Input on needs and responsive plans are encouraged fromstakeholders• <strong>Plan</strong> Subject to Midwest ISO stakeholder process
Executive Summary• <strong>10</strong>-<strong>Year</strong> <strong>Transmission</strong> <strong>Plan</strong>• Core Reliability projects assessed (<strong>20</strong>12-16)• States Renewable <strong>Energy</strong> Standards– MN RES 30 % renewables by <strong>20</strong><strong>20</strong>– Wisc RES <strong>10</strong>% renewables by <strong>20</strong>15– ND RES <strong>10</strong>% renewables by <strong>20</strong>15– SD RES <strong>10</strong>% renewables by <strong>20</strong>15– Western MN, eastern ND & SD wind generation major driver• Significant sub-regional and regional transmissioninvolvement– CAPX <strong>20</strong><strong>20</strong> group 1 completion by <strong>20</strong>16– La Crosse-Eastern Wisconsin 345 kV projects <strong>20</strong>18-<strong>20</strong>28 inservice– Second Manitoba Hydro 500 kV in MISO TSR for <strong>20</strong><strong>20</strong> inservice– MISO MVP Group 1 Portfolio projects
Executive Summary, cont.• Regional studies and proposals• Potential with national RES policy development• Wind generation purchases primary driver• Regional 765 kV proposals• Eastern Interconnection <strong>Plan</strong>ning Collaborative (EIPC)• Projects under study proposed by regional entities– MISO Regional Generation Outlet Study (RGOS 1 and 2)– Phase 1 MVP portfolio– MH Expansion <strong>Plan</strong>– Green Power Express 765 kV project– SMAR<strong>Transmission</strong> StudyNote: <strong>NSP</strong> is participating in these studies to ensure the <strong>NSP</strong><strong>System</strong> and local area are properly represented and to ensurecustomer focus, cost effectiveness, operational reliability andregional policymaker alignment.
Key Messages• <strong>10</strong>-<strong>Year</strong> <strong>Plan</strong>• New load peak in July <strong>20</strong>11 shows growth• Wind generation continues to be a driver oftransmission although development slower than inrecent past• CAPX <strong>20</strong><strong>20</strong> projects support Minnesota RenewableGoals• MISO MVP Group 1 Portfolio expected to be approvedin by the end of <strong>20</strong>11• <strong>20</strong>-<strong>Year</strong> <strong>Transmission</strong> Scenario Assessment• <strong>20</strong>-year scenario assessment is a conceptual vision forthe <strong>NSP</strong> area• <strong>NSP</strong> evaluated 3 unique transmission scenarios• Scenarios include various levels of renewable energy,and varying potential upper Midwest environmentalpolicies
Key Messages• Regional Studies and Proposals• Wind potential in Dakotas, Iowa and Minnesota is onedriver for interest in regional transmission overlaydevelopment• <strong>NSP</strong> engaged in regional and national efforts tobroaden policy considerations– Support for renewable energy– Incorporate potential climate change policy impacts– Evaluation of various export strategies– Assure coordination with <strong>NSP</strong> transmission systemNote: <strong>NSP</strong> is participating in these studies to ensure the <strong>NSP</strong>system and local area are properly represented and to ensurecustomer focus, cost effectiveness, operational reliability andregional policymaker alignment.
Major Changes from <strong>20</strong><strong>10</strong>• Corridor Update Project Removed from proposedprojects– The need for the Corridor Updateproject has pushed the potential in-service dateout past the current planning horizon due toamounts of generation needed for meeting RESrequirements• <strong>NSP</strong>/<strong>NSP</strong>W reached a new system peak summer<strong>20</strong>11, as did the MISO footprint
Updates to NERC Requirements• FERC/NERC ongoing investigations ofdisturbances• TPL-001-2, update to existing TPL-001throughTPL-004 standards• TPL-001-2 may increase the scope of annualassessment due to new performance requirements• Ongoing compliance studies may identify newnetwork upgrade projects• FAC-008-3, pending FERC approval• Continued prior outage studies• Ongoing Standards development
NERC <strong>20</strong>11 Long-Term ReliabilityAssessment<strong>NSP</strong>MISO Area - MRO Region• Reliability Assessment• <strong>20</strong>11 39.6 % reserve margin in the MISO Area (<strong>NSP</strong>) versus NERCreference margin of 15 %• <strong>20</strong><strong>20</strong> 33.4 % reserve margin in the MISO Area (<strong>NSP</strong>) versus NERCreference margin of 15 %• Emerging Reliability issues• Integration of Variable generation, <strong>Plan</strong>ning Reserve margin• <strong>System</strong> Modeling improvement and Coordination• Environmental Regulations and impacts to BES• MRO highlights• 1) Peak load increase at 1.0 % (MRO) , matching <strong>NSP</strong> around 1.0 %• 2) Changing membership – Joining: Big River Electric Corporation12/1/<strong>20</strong><strong>10</strong>; Leaving: First <strong>Energy</strong> and Cleveland Public Power exited June1, <strong>20</strong>11 and Duke <strong>Energy</strong> Ohio and Duke <strong>Energy</strong> Kentucky exit January 1,<strong>20</strong>12• Key Finding - <strong>Transmission</strong>• <strong>Transmission</strong> is responding to increased plans for integrating and deliverynew generation (renewable); construction is on pace with projections.
<strong>NSP</strong> <strong>System</strong> Statistics: <strong>20</strong>11• 7,2<strong>10</strong> miles of transmission (34.5 kVand above)• 477 substations served• 7,570 MW <strong>Xcel</strong> <strong>Energy</strong>-ownedgeneration• 1,292 MW Wind generation• <strong>NSP</strong> <strong>System</strong> Previous Peak Load:9,131 MW (Actual) (August <strong>20</strong><strong>10</strong>)• <strong>NSP</strong> <strong>System</strong> Peak Load 9,544 MW(Actual) (July <strong>20</strong>11)
<strong>NSP</strong> <strong>Transmission</strong> <strong>System</strong>• <strong>NSP</strong>’s transmission assets are located in MN, WI,ND, SD, and MI• Under operational control of the Midwest Independent<strong>Transmission</strong> <strong>System</strong> Operator, Inc. (MISO)• Major Utility Interconnections• Dairyland Power Cooperative, Great River <strong>Energy</strong>,Minnesota Power, Manitoba Hydro Electric Board, OtterTail Power, ITC Midwest, Western Area PowerAdministration, American <strong>Transmission</strong> Company LLCand others• Under Functional control of MISO. <strong>NSP</strong> <strong>System</strong>planning subject to MISO <strong>Transmission</strong>Expansion <strong>Plan</strong> (MTEP) process
<strong>NSP</strong> Companies Retail Service Territory
MISO Service Territory
Upper Midwest<strong>Transmission</strong> Grid
<strong>Plan</strong>ning Principles• Principles• Focus on customers and affordability• Ensure alignment with policy makers• Ensure cost recovery support from regulators• Coordinate with local regional utilities• Actively participate in regional plan development
<strong>NSP</strong> <strong>System</strong> <strong>Plan</strong>ning process• Reliability planning and other studies• Annual NERC assessments• Make extensive use of regional planning groupsand the MISO MTEP process• Participate in the <strong>NSP</strong> Area Sub-Regional <strong>Plan</strong>ningGroup meetings• Issues and proposals submitted to MTEP process• Issues and Proposals also aired at the MTO & submittalin the Minnesota Biennial <strong>Transmission</strong> <strong>Plan</strong>ning Report
Generation Interconnection<strong>Plan</strong>ning Process• <strong>Plan</strong>ning for Generation Additions Performed byMISO• All requests to interconnect with the <strong>NSP</strong> transmissionsystem must be made with MISO• For further information go to:– www.midwestiso.org
Regional <strong>Plan</strong>ning Process• <strong>NSP</strong> internal reliabilityannual reviews• MN <strong>Transmission</strong>Assessment andCompliance Team(MNTACT)• Minnesota joint utility annualNERC assessment• <strong>NSP</strong> Area Sub-Regional<strong>Plan</strong>ning Group’s (SPG)• Coordination of studies andplans• MISO <strong>Transmission</strong>Expansion <strong>Plan</strong> (MTEP)• MISO annual plan andFERC order 890 compliance• MISO Initiated studies• Interconnection-wideplanning such as theEastern Interconnection<strong>Plan</strong>ning Collaborative(EIPC)• Special purpose studies• State ordered studies• Renewable <strong>Energy</strong> Standard(RES)– <strong>20</strong>16 RES• Distributed RenewableGeneration (DRG)• MN Biennial <strong>Plan</strong>
Regional <strong>Plan</strong>ning Process
Economic <strong>Plan</strong>ning• Economic planning involves• Various resource scenario evaluations• Economic impact of market congestion on transmissionelements• <strong>Energy</strong> and demand loss evaluation on transmissionelements• Benefits frequently not large enough to justifystand alone transmission investment• Economic Benefits coupled with other benefits(reliability, local or regional policy, etc) togetherenter into transmission alternative evaluation
Economic <strong>Plan</strong>ning• <strong>NSP</strong> reviews studies by others and is activelyinvolved in regional and Sub-Regional economicplanning efforts such as:• The Department <strong>Energy</strong> (DOE) national transmissioncongestion studies• MTEP process• <strong>NSP</strong> Area SPG’s• MNTACT Study Group• MISO MVP
MISO MVP Candidate Projects
MISO Top CongestedFlowgates
Stakeholder Input• MISO MTEP process sub-regional meetings• MISO posts these SPM meetings on their publicwebsite• MISO sends out an email to the <strong>Transmission</strong>Customers list• http://www.midwestiso.org/page/Expansion+<strong>Plan</strong>ning• MN Biennial <strong>Plan</strong> Annual public meetings• Local and regional newspaper ad• http://www.minnelectrans.com
<strong>20</strong>11 <strong>Plan</strong>ning Process CalendarJan Feb Mar Apr May Jun Jul Aug Sep Oct NovDec5 year capitalbudget studies<strong>NSP</strong> Load InterconnectionStudies5 year budgetapproved<strong>NSP</strong> <strong>10</strong> year plan and5 year Budget StudiesMinnesota <strong>Transmission</strong>Assessment ComplianceMTO Public Hearings &Biennial <strong>Plan</strong>Generation Interconnection and<strong>Transmission</strong> Service Studies (MISOProcess)Northern MapSubregional<strong>Plan</strong>ning GroupMTEP13 Submittalsand FERC 890MTEP13PublicmeetingsMISO MTEP12Study and <strong>Plan</strong>ningGroup MeetingFinal <strong>Plan</strong>DevelopedMTEP12 MISOBoard Approval
<strong>Plan</strong>ning CriteriaSteady State <strong>Plan</strong>ning CriteriaLimits<strong>System</strong> IntactConditionPost-ContingencyCondition<strong>Transmission</strong> LineLoading<strong>10</strong>0% of Rating 1<strong>10</strong>% of rating for singlecontingency, unless limited byterminal equipment or lineclearanceTransformer Loading <strong>10</strong>0% of Rating Summer 115% postcontingencyif precontingencyloading is below90%Generator BusVoltage0.95 to 1.05 per unit 0.95 to 1.05 per unitLoad Bus VoltageTwin Cities metro0.92 to 1.05 per unit.Outside TC Metro0.90 to 1.<strong>10</strong> per unitTwin Cities Metro0.92 to 1.05 per unit.Outside TC Metro0.90 to 1.<strong>10</strong> per unit.
<strong>Plan</strong>ning CriteriaDynamic Stability CriteriaNERCCategoriesTransient VoltageDeviation LimitsRotor Angle OscillationDamping Ratio LimitsANothing in addition to NERC RequirementsBCMinimum 0.70 p.u. atany busMinimum 0.70 p.u. atany busNot to be less than0.0081633 for disturbanceswith faults or less than0.0167660 for line trips.Not to be less than0.0081633 for disturbanceswith faults or less than0.0167660 for line trips.DNothing in addition to NERC Requirements
Drivers<strong>Transmission</strong> DevelopmentLoad growthState renewableportfoliostandardsRegional andNationalRenewablePolicy• Load forecast (9,544 MW in <strong>20</strong>11)• Wholesale/retail load serving interconnections• NERC Reliability compliance and planning criteria• MN RES 30 % renewables by <strong>20</strong><strong>20</strong>• Wisc RES <strong>10</strong>% renewables by <strong>20</strong>15• ND RES <strong>10</strong>% (RPS Goal) renewables by <strong>20</strong>15• SD RES <strong>10</strong>% (RPS Goal) renewables by <strong>20</strong>15• Western MN, Eastern ND & SD major windresources• National <strong>Energy</strong> policy• Potential national Renewable <strong>Energy</strong> Standard• Carbon Emissions Reduction ( Cap and Trade?)• Intermittent renewable resource reliability andoperations criteria
<strong>20</strong>11Historic Load Growth (<strong>NSP</strong> Native)1<strong>20</strong>00<strong>10</strong>000800060004000<strong>20</strong>000<strong>20</strong>051981198319851987198919911993199519971999<strong>20</strong>01<strong>20</strong>03Actual Demand MW<strong>20</strong>09<strong>20</strong>07
<strong>20</strong>31<strong>20</strong>30<strong>20</strong>29DriversLow but continuing load growth (<strong>NSP</strong> Native)<strong>10</strong>,400<strong>10</strong>,<strong>20</strong>0<strong>10</strong>,000<strong>20</strong>-<strong>Year</strong> GrowthRate = 0.58%9,8009,6009,4009,<strong>20</strong>09,000<strong>20</strong>11<strong>20</strong>12<strong>20</strong>13<strong>20</strong>14<strong>20</strong>15<strong>20</strong>16<strong>20</strong>17<strong>20</strong>18<strong>20</strong>19<strong>20</strong><strong>20</strong><strong>20</strong>21<strong>20</strong>22<strong>20</strong>23<strong>20</strong>24<strong>20</strong>25<strong>20</strong>26<strong>20</strong>27<strong>20</strong>28*Forecast November <strong>20</strong>11
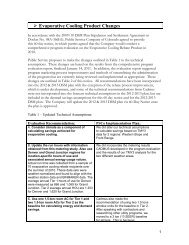
DriverState Renewable Generation PolicyRenewable <strong>Energy</strong> MW Gap Analysis -- MN RES UtilitiesAcquired Capacity and MW Needed for RES Compliance700060006240500045314959484151454608Megawatts4000300030454069Acquired MWNeeded MW MN RESNeeded MW Other Jurisdictions<strong>20</strong>00<strong>10</strong>003901158130515560<strong>20</strong>12 <strong>20</strong>16 <strong>20</strong><strong>20</strong> <strong>20</strong>25RES Milestone <strong>Year</strong>sSource: <strong>20</strong>11 Biennial <strong>Transmission</strong>Projects Report Nov. 1 st , <strong>20</strong>11
DriverGeneration Additions
DriverNational Renewable PolicyMidwest wind for national RES?
<strong>NSP</strong> <strong>System</strong> Sub-regional <strong>Plan</strong>
CAPX<strong>20</strong><strong>20</strong>Group 1 ProjectsNearly 700 miles and $1.7 billion• Upsizing adds about $<strong>20</strong>0 millionFargo-St. Cloud-MonticelloBrookings County-HamptonHampton-Rochester-La CrosseBemidji-Grand Rapids250-miles, 345-kV240-miles, 345-kV150-miles, 345-kV70-miles, 230-kV• Alleviates emerging community servicereliability concerns around the state• Critical foundation for future transmission andgeneration• Provide needed transmission capacity tosupport new generation outlet• In-service dates from <strong>20</strong>11-<strong>20</strong>15• CAPX <strong>20</strong><strong>20</strong> Group 1 projects resulted from Vision plan
Post CapX <strong>20</strong><strong>20</strong>Potential Projects44*21431. Corridor (Granite Falls-Twin Cities345 kV) Project• Reviewing in light of MISO MVPGroup 1 projects• Increase Western MN- MISOmarket transfer <strong>10</strong>00 MW• Support wind generationdevelopment2. Manitoba- Minnesota 500 kV• Increase MH to US transfer 1<strong>10</strong>0MW• MISO Manitoba Hydro Group TSRStudy3. La Crosse-Madison 345 kV• Multiple purpose line• Increase Western MN- MISOmarket transfer <strong>20</strong>00 MW4. Other potential projects furthersupport wind generationdevelopment
<strong>NSP</strong> CORE<strong>10</strong>-<strong>Year</strong> <strong>Transmission</strong> <strong>Plan</strong>
5-<strong>Year</strong> Expansion <strong>Plan</strong> (<strong>20</strong><strong>10</strong>-<strong>20</strong>14)<strong>Plan</strong>ning ZonesZone 1Zone 2Zone 3Twin Cities MetroAreaSoutheastMinnesotaSt Cloud and WestCentral MinnesotaZone 4 South Dakota /Sioux FallsZone 5Zone 6Zone 7NorthernWisconsinSouthernWisconsinNorth DakotaZone 8 Minnesota Valley /SW Minnesota
Proposed <strong>Transmission</strong> ProjectsZone 1: Twin Cites Metro Area• Twin Cities metro made up ofMinneapolis/St. Paul andsurrounding suburbs• Max Generation: 3518 MW• Peak Load: 5388 MW (60% of <strong>NSP</strong><strong>System</strong> load)• CAPX <strong>20</strong><strong>20</strong> Brookings 345 kV linebegins development of an outer 345kV transmission ring of the metroarea.• Issues• 345 kV transformer capacitymaxed out• Impact of reduced 115 kVgeneration due to high windgeneration conditions• Inner city/suburbs require newdistribution substations withassociated transmission• Expansion of metro growthoutside the US 694/494 freewayloop
Proposed <strong>Transmission</strong> ProjectsZone 1: Twin Cites Metro Area (<strong>20</strong><strong>10</strong>-<strong>20</strong>14)# Project Comments ISD Drivers1 Eden Prairie345/115 kVtransformerReplace existing 448 MVAtransformers with two new672 MVA transformersTBDReliability2 Upgrade RedRocktransformersUpgrade Red Rock 115/345kV transformers to 672 MVATBDReliability53 New 115kVsubstationsHiawatha and Midtown new115kV Substations<strong>20</strong>13 Distribution67813&424 Hiawatha –Midtown 115kV5 HollydaleDistributionInterconnection6 Scott Co.-Augusta–West Waconiaconversion7 Glencoe – WestWaconiaconversionNew double circuit 115kVline from Hiawatha toMidtownUpgrade distributionsubstation to 115 kV andincrease loadingConvert the existing 69 kV linealong with the distributionsubstations to 115 kVConvert the 69 kV line betweenGlencoe and West Waconia to 115kV<strong>20</strong>13 Distribution<strong>20</strong>13 Distribution<strong>20</strong>13 Reliability<strong>20</strong>13 Reliability8 Scott County-WestgateconversionConvert the 69 kV line betweenWestgate – Scott County to 115 kValong with Excelsior andDeephaven substations<strong>20</strong>14 ReliabilityNote: Project scope andtiming subject to change
Proposed <strong>Transmission</strong> ProjectsZone 1: Twin Cites Metro Area (<strong>20</strong><strong>10</strong>-<strong>20</strong>14)12&15# Project Comments ISD Drivers9 KohlmanLake –Goose Lake2 nd circuitConvert existing single circuitto double circuit.<strong>20</strong>14 Reliability169&<strong>10</strong>13<strong>10</strong> KohlmanLake – LongLake 2 ndcircuit11 Lake Marion– Burnsville115 kV lineupgradeConvert existing bifurcatedline into double circuitUpgrade existing 115 kV lineto higher capacity.<strong>20</strong>14 Reliability<strong>20</strong>14 Cap Xunderlyingsystemupgrade1412 ChisagoCounty 2 nd345/115 kVtransformer13 KohlmanLake reactorprojectInstall 2 nd Chisago County345/115 kV transformerInstall 30 MVAR reactor onKohlman Lake 345/115 kVtransformer tertiary<strong>20</strong>14 Reliability<strong>20</strong>14 TC Highvoltagemitigation14 Red Rockreactor projectInstall 30 MVAR reactor on RedRock 345/115 kV transformer tertiary<strong>20</strong>14 TC Highvoltagemitigation1115 Chisago Countyreactor projectInstall 40 MVAR reactor on ChisagoCounty 345//115 kV transformertertiary<strong>20</strong>14 TC highvoltagemitigation16 Riverside –Apache upgradeUpgrade the existing Riverside –Apache 115 kV line to highercapacity.<strong>20</strong>14 ReliabilityNote: Project scope andtiming subject to change
Potential <strong>Transmission</strong> ProjectsZone 1: Twin Cites Metro Area (<strong>20</strong>15-<strong>20</strong>19)# Project Comments ISD Drivers1 Red Rock – Afton115 kVRebuild existing RedRock – Afton 115kV lineto 795 ACSSReliability32 Parkers Lake345/115 kVtransformerReplace existing 448MVA transformers withtwo new 672 MVAtransformersReliability23 Meadow LakeDistributionInterconnectionNew 115 kVdistributionsubstation and line<strong>20</strong>15 Distribution1
Proposed <strong>Transmission</strong> ProjectsZone 2: South East Minnesota• Rochester is the majorload center. RPU owned.• Increased interest inrenewable generation inthis area.• Max Generation: 2422MW• Except in the vicinity ofRochester this area isprimarily rural withminimal load growth• CAPX <strong>20</strong><strong>20</strong> La Crosse345 kV line will addsubstantial capability toserve Rochester• Issues• Wind generationpotential• Aging 69 kVinfrastructure
Proposed <strong>Transmission</strong> ProjectsZone 2: South East Minnesota (<strong>20</strong><strong>10</strong>-<strong>20</strong>14)# Project Comments ISD Drivers1 Prescott Capbank2 PleasantValley – Byron161kVAdd a new <strong>10</strong> MVARcapacitor bankNew 161kV line fromPleasant Valley –Byron (RIGO)<strong>20</strong>14 Reliability<strong>20</strong>13 GenerationOutletNote: Project scope andtiming subject to change
Potential <strong>Transmission</strong> ProjectsZone 2: South East Minnesota (<strong>20</strong>15-<strong>20</strong>19)# Project Comments ISD Drivers1 SpringCreek –Lake City161 kVlineBuild 161 kV linealong existing69kV line corridor(double circuit).<strong>20</strong>17-<strong>20</strong>19ReliabilityNote: Project scope andtiming subject to change
Proposed <strong>Transmission</strong> ProjectsZone 3: West Central Area• St. Cloud is the largest loadcenter in the area.• CAPX <strong>20</strong><strong>20</strong> Fargo-Monticelloline will help support the area.• Max Generation: 2976 MW• CAPX <strong>20</strong><strong>20</strong> Fargo line willprovide the bulk powertransmission anchor for thereliability of the wholeplanning zone.• Issues• St. Cloud transmissionmaxed out• Minimal growth in the west• Small wind development inthe west
Proposed <strong>Transmission</strong> ProjectsZone 3: West Central Area (<strong>20</strong><strong>10</strong>-<strong>20</strong>14)# Project Comments ISD Drivers1 Benton Co. –Mayhew Lake115kV2 St. Cloud –Granite City115kV3 Maple Lake –Watkins 69kVRe-Terminate one of theBenton – Granite City circuitinto Mayhew Lakesubstation, by building 4miles of new 115 kV line.Eliminate the 3 terminal linebetween Granite City,Benton County and St.CloudRebuild Maple Lake toWatkins 69kV line to 477ACSR<strong>20</strong>12 Reliability<strong>20</strong>12 Reliability<strong>20</strong>12 Reliability4 Sherco DataCenterAdd new data center to theSherco SubstationTBDLoad5 Paynesville –Belgrade 69kVRebuild existing 69 kV lineto 477 ACSR<strong>20</strong>15 Reliability6 Douglas County69 kV work2 nd 115/69 kV transformer atDouglas County<strong>20</strong>11 ReliabilityNote: Project scope andtiming subject to change
Potential <strong>Transmission</strong> ProjectsZone 3: West Central Area (<strong>20</strong>15-<strong>20</strong>19)• Possible 69 kVcondition upgradesoutside of the St. Cloudarea.• Possible winddevelopment coulddrive upgrades in thewest.
Proposed <strong>Transmission</strong> ProjectsZone 4: Sioux Falls Area• Sioux Falls is the largestload center in this area.• Close proximity to theBuffalo Ridge area.• Wind generation is heavilylocated around this area.• Issues• Expansion of medicalcampus planned incentral and west SiouxFalls• Large amounts of windgeneration potential westof the city.• At western edge of <strong>NSP</strong><strong>System</strong>/MISO
Proposed <strong>Transmission</strong> ProjectsZone 4: Sioux Falls Area (<strong>20</strong><strong>10</strong>-<strong>20</strong>14)# Project Comments ISD Drivers1 New 115 kVLawrencesubstation2 New 115 kVsubstation called“Falls”3 West Sioux Falls –Falls – Lawrence69 kV LineConversion to 115kVConvert existing Lawrence115/69/34.5 kV substationto 115/34.5 kV, breakerand a half configurationBuild new Falls substationto replace existing SiouxFalls substation andconvert from 69/13.8 kV to115/13.8 kVConvert existing WestSioux Falls – Sioux Falls –Lawrence 69 kV line to115 kV (959/TW ACSS)and minimal substationtermination work at WestSioux Falls<strong>20</strong>14 Reliability<strong>20</strong>14 Reliability<strong>20</strong>14 ReliabilityNote: Project scope andtiming subject to change
Proposed <strong>Transmission</strong> ProjectsZone 4: Sioux Falls Area (<strong>20</strong>15-<strong>20</strong>19)# Project Comments ISD Drivers1 Falls substation115 kVterminationAdd termination at Fallssubstation for new 115 kVline<strong>20</strong>15-<strong>20</strong>19Reliability2 Convert SouthSioux Fallssubstation to 115kVBuild new South SiouxFalls substation to replaceexisting South Sioux Fallssubstation and convertfrom 69/13.8 kV to115/13.8 kV<strong>20</strong>15-<strong>20</strong>19Reliability3 West Sioux Falls –Falls – LincolnCounty 69 kV LineConversion to 115kVConvert existing WestSioux Falls – South SiouxFalls – Lincoln Co. 69 kVline to 115 kV (959/TWACSS) and minimalsubstation terminationwork at West Sioux Falls<strong>20</strong>15-<strong>20</strong>19Reliability• Potential need for bulk supply source onthe west side of the city of Sioux Fallssometime after <strong>20</strong>19• Growing load around the 115 kV loop• Wind development may accelerate needfor additional bulk supply sources aroundSioux Falls in the future
Proposed <strong>Transmission</strong> ProjectsZone 5: Northern Wisconsin Area• Eau Claire is the largestload center in the area.• Primarily rural load.• Minimal small customerload growth• Major transmissionexpansion underconstruction in Eau Claire• Issues• Northern Wisconsintransmission maxed out• Substantial majorindustrial expansion underconsideration in northernWisconsin
Proposed <strong>Transmission</strong> ProjectsZone 5: Northern Wisconsin Area (<strong>20</strong><strong>10</strong>-<strong>20</strong>14)# Project Comments ISD Drivers1 Weber lakeSubstationA new 115/34.5 kVsubstation on 115 kV linebetween Park falls andIronwood.<strong>20</strong>12 Reliability2 Stone Lake-Couderay161 kV lineNew 161 kV substation andline from Stone Lake-CouderayReliability13 Osprey –Park FallsRebuild4 Park FallsBio-RefineryconnectionRebuild 1922 latticestructures and string largerconductor115 kV radial line from ParkFalls sub to substantial newcustomer<strong>20</strong>12 Reliability<strong>20</strong>12 Reliability45 Couderay –Osprey 161kV lineExtension of Stone Lake –Couderay to supportincreased pumping loads<strong>20</strong>14 Reliability253Note: Project scope andtiming subject to change
Proposed <strong>Transmission</strong> ProjectsZone 5: Northern Wisconsin Area (<strong>20</strong>15-<strong>20</strong>19)# Project Comments Drivers1 BayfieldLoop 115 kV2 Pokegama161/69kVSubstation3 Withee115/69 kVTransformerRebuild existing Iron River –Gingles 34.5 kV loop to 115 kVwith some DistributionunderbuildBuild a new 161/69kV substationat Pokegama and build a linefrom BarronInstall a 1<strong>20</strong> MVA transformer atWitheeLoadShedReliabilityReliabilityNote: Project scope and timing subject to change
Proposed <strong>Transmission</strong> ProjectsZone 6: Southern Wisconsin Area• Lacrosse is the largestload center in the area• Made up of agriculturaland smaller communities• CAPX <strong>20</strong><strong>20</strong> creates a bulksupply source to the cityof La Crosse in <strong>20</strong>15• <strong>NSP</strong> <strong>System</strong> highlyinterconnected withDairyland Power Coop inthis area
Proposed <strong>Transmission</strong> ProjectsZone 6: Southern Wisconsin Area (<strong>20</strong><strong>10</strong>-<strong>20</strong>14)# Project Comments ISD Drivers1 New transformerat MonroeCounty2 Camp McCoy –Cataract 69 kVline rebuild3 Couleetransformerupgrade and ringbusMonroe County new 70MVA 161/69kVtransformer, includingnew breakersRebuild 4 miles of 1/0ACSR 69 kV line to 477ACSRReplace Coulee161/69kV transformer#5 with 112 MVA unit<strong>20</strong>11 Reliability<strong>20</strong>11 Reliability<strong>20</strong>12 ReliabilityNote: Project scope andtiming subject to change
Proposed <strong>Transmission</strong> ProjectsZone 6: Southern Wisconsin Area (<strong>20</strong>15-<strong>20</strong>19)# Project Comments ISD Drivers1 La Crosse–WestSalem69kVRebuild La Crosseto West Salem 69kVline to 477 ACSS<strong>20</strong>15-<strong>20</strong>19Reliability2 La CrossetransformerupgradeReplace La Crosse161/69kVtransformer #2 with112 MVA unit<strong>20</strong>15-<strong>20</strong>19ReliabilityNote: Project scope andtiming subject to change
Proposed <strong>Transmission</strong> ProjectsZone 7: North Dakota Area• Fargo and Grand Forks arethe primary load centers• New Bison substation forthe CAPX Group 1 projects• Issues• Large amounts of windproposed west of Fargoin North Dakota
Proposed <strong>Transmission</strong> ProjectsZone 7: North Dakota Area (<strong>20</strong><strong>10</strong>-<strong>20</strong>14)# Project Comments ISD Drivers21 Maple River –Cass County345kVMaple River – CassCounty, new 345kVline (operated at230kV) and CassCounty 230/115kVtransformerReliability2 Prairie 3 rdtransformerInstall 3 rd 230/115 kVtransformer at Prairiesubstation<strong>20</strong>14 ReliabilityNote: Project scope andtiming subject to change
Proposed <strong>Transmission</strong> ProjectsZone 7: North Dakota Area (<strong>20</strong>15-<strong>20</strong>19)# Project Comments Drivers1 Maple River –Cass County345kVextension2 Cass County– Red River115kV3 Maple River –Cass County– Flint 230kVExtend Maple River –Cass County 345 kVLine to FlintSubstation (viadouble-circuit withMaple River –Sheyenne 230 kV line)Cass County to RedRiver 115kV, upgradeto 795 ACSSMaple River – CassCounty – Flint 230 kVline, convert to 345 kVReliabilityReliabilityReliabilityNote: Project scope and timing subject to change
Proposed <strong>Transmission</strong> ProjectsZone 8: Minnesota Valley Area• Mankato is the primary loadcenter• New Helena substation for theCAPX <strong>20</strong><strong>20</strong> Group 1 projects• Issues- Local load serving- Wind interconnectioninterest• New 345/115/69 kV substationis planned between Wilmarthand Helena substations forload serving purposes. Theproposed in-service date forthis project is <strong>20</strong>12
Proposed <strong>Transmission</strong> ProjectsZone 8: Minnesota Valley Area (<strong>20</strong><strong>10</strong>-<strong>20</strong>14)# Project Comments ISD Drivers1 Fenton 69 kVinterconnectionNew 69 kV in andout at Fenton<strong>20</strong>11 ReliabilityNote: Project scope andtiming subject to change
Proposed <strong>Transmission</strong> ProjectsZone 8: Minnesota Valley Area (<strong>20</strong>15-<strong>20</strong>19)# Project Comments Drivers1 WorthingtonLoadservingPossible new 161/115kV or 115/69 kV sourceat NoblesReliabilityNote: Project scope and timing subject to change
Minnesota Valley Area• This area is mostlyimpacted by high flowsdue to proximity of windresources• The existing loads in thisarea would need to beshed after n-1 conditionsto meet NERC TPL-003standard• The proposed plan is toupgrade 27 miles ofMinnesota Valley –Maynard – Kerkhoven tapline to higher capacity by<strong>20</strong>14
Fargo Area• The largest loads in this areaare Red River, Cass Countyand Moderow substationsserved by the 115 kV lines inthe area• Several transmissioncontingencies would requireshedding load during peakand off peak conditions tomeet NERC TPL-003standard• The proposed plan is to builda new 5 mile 115 kV line fromMaple River substation toRed River substation, toprovide the redundancyneeded to mitigate anyviolations during Category Ccontingencies
Sioux Falls Area• Largest loads served by 115kV lines in the area:• West Sioux Falls• Cherry Creek substations• Peak load shed required forseveral transmissioncontingencies to meet NERCTPL-003 standard• Distribution need for a newsubstation in the city toaccommodate load growthbeyond the capabilities of 69kV• Rebuild <strong>10</strong> miles of 69 kV to115 kV, including 6 miles ofdouble circuit 115/69 kV• Sioux Falls substation will berelocated to accommodatethe larger lines anddistribution needs
<strong>20</strong>-<strong>Year</strong> Scenario Assessment
<strong>20</strong>-<strong>Year</strong> Scenario Assessment• Assessment of transmission needs in <strong>NSP</strong> areafor potential future renewable policies• Three scenarios based on possible upperMidwest renewable energy policies andgeneration patterns• EHV overlay address potential nationalrenewable policy
<strong>20</strong>-<strong>Year</strong> Scenario AssessmentAnalysis• Resource availability• Variety of potential locations for new generationresources– Most likely to develop outside the Twin Cities metropolitanarea.• Assumed that new nuclear power plants on <strong>NSP</strong>system unlikely during next <strong>20</strong> years• Assumed that small scale distributed generation willcontinue in their present role in the resource plan or fortransmission needs.• Solar technology is starting to be installed, but will likelydevelop in the sunnier American southwest
<strong>20</strong><strong>10</strong> <strong>20</strong>-<strong>Year</strong> Vision <strong>Plan</strong>• <strong>20</strong><strong>10</strong> Vision Study waslocalized to the <strong>NSP</strong>region• For the <strong>20</strong>-<strong>Year</strong> Vision<strong>Plan</strong> the facilities shownwere verified to still be thenext likely transmissionbuildout.• The facilities werecommon to all generationscenarios studied• The following slidesdescribe the <strong>20</strong>09 BridgeStudy analysis which wasa broad regional <strong>20</strong>-yearvision plan
<strong>20</strong>09 Bridge Study Strategic Vision: Scenario 1High Internal Renewable• Scenario 1-- High Minnesota onlyrenewable development• Normal load growth• Minnesota will continue RES obligation• Surrounding states do not expand abovetheir present minimal RES obligations, ordevelop internally and require no deliveryfrom Minnesota or North and SouthDakota• Statistics• 1,<strong>10</strong>0 miles of 345 kV double circuit• 1<strong>10</strong> miles of 500 kV• Total estimated cost of: ~$4 billion
<strong>20</strong>09 Bridge Study Strategic Vision : Scenario 2Sub-Regional Renewable• Scenario 2-- Sub-Regional renewabledevelopment• Normal load growth• Upper Midwest (MN, WI, IA, ND, SD) alldevelop an obligation similar to the MNRES• States outside the Upper Midwest alsoexpand on or initiate their presentrenewable obligations• Statistics• 1,<strong>20</strong>0 miles of 345 kV double circuit• 1<strong>10</strong> miles of 500 kV• 730 miles of 765 kV– Total estimated cost of: ~$6.7billion
<strong>20</strong>09 Bridge Study Strategic Vision : Scenario 3Non Renewable Long Range• Scenario 3 -- Non-renewable long-rangefuture• Scenario 1, with the same renewableexpansion through the year <strong>20</strong>16• Beginning in <strong>20</strong>17, assume RPSrequirements in Western MISO andthroughout Eastern Interconnect arescaled back• US does not initiate a carbon reductioninitiative, Minnesota will repeal its coalplant moratorium• Statistics• 1,000 miles of 345 kV double circuit• 1<strong>10</strong> miles of 500 kV• <strong>10</strong>0 miles of 765 kV– Total Estimated Cost of: ~ $4 billion
<strong>20</strong>09 Bridge Study Strategic Vision : Scenario 4Low Load Growth• Scenario 4 — Low load growth• Flat load growth• Upper Midwest (MN, WI, IA, ND, SD) alldevelop an obligation similar to the MNRES• States outside the Upper Midwest alsoexpand on or initiate their presentrenewable obligations• <strong>Transmission</strong> similar to Scenario 2 dueto the similar regional renewableexpansion• Statistics• 1,<strong>10</strong>0 miles of 345 kV double circuit• 1<strong>10</strong> miles of 500 kV• 570 miles of 765 kV• Total Estimated Cost of: ~ $6 billion
Regional
Extra-High Voltage<strong>Transmission</strong> Overlays• <strong>NSP</strong> <strong>System</strong> situated between some of thenations best wind and potential central Midwestand Eastern load serving entities• Potential National Renewable <strong>Energy</strong> Standard• Potential “interstate highways” to ship greatplains wind generation under study
<strong>Transmission</strong> OverlayProposals• Various study/proposals• MISO Renewable Generation Outlet Study (RGOS 1and 2)www.midwestiso.org/home• Green Power Expresswww.itctransco.com/projects/thegreenpowerexpress.html• SMAR<strong>Transmission</strong> Studywwwqa.smartstudy.biz/• Joint Coordinated <strong>System</strong> <strong>Plan</strong> (JCSP)www.nyiso.com/public/services/planning/crpp.jsp• Eastern Interconnection <strong>Plan</strong>ning Collaborative (EIPC)www.eipconline.com
<strong>Transmission</strong> OverlayProposals• <strong>NSP</strong> Involvement• <strong>NSP</strong> is participating in the overlay studies– To ensure the <strong>NSP</strong> system and local area are properlyrepresented– To ensure customer focus, cost effectiveness, operationalreliability and regional policymaker alignment– <strong>NSP</strong> believes it can best look out for these interests bydirectly participating in these studies.
RGOS (MISO) Study Scope• Develop regional transmission system to supportrenewable portfolio standards• Phase I – Minnesota, Wisconsin, Illinois, and Iowa(approximately 15,000 MW)• Phase II – RPS increases in Phase I states andremaining MISO states not in Phase I (approximately22,000 MW)• www.midwestiso.org/page/Expansion+<strong>Plan</strong>ning
RGOS Wind Scenarios• Zones• <strong>20</strong> energy zones withinUMTDI plus additional9 zones added in IL• UMTDI zones to serveUMTDI states, noexport• IL zones to serve IL(Ameren, ComEd)• Zones established at750MW-1500MWcapacity each• Indicative scenariosused 18-22 zones• Two primarytransmission build outsdeveloped for eachscenario based onindicative work• 345 kV and 765 kV (with345)Scenario A• Scenario hashigherconcentrationof zones in theND/SDcompared to BScenario B• Scenario hashigherconcentrationof zones inMN/IAcompared to A
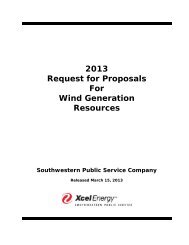
* MISO RGOS Phase I Study15 GW Scenario A
* MISO RGOS Phase I Study15 GW Scenario B
* MISO RGOS Phase I Study25 GW Scenario A
* MISO RGOS Phase I Study25 GW Scenario B
Green Power Express Proposal* ITC’s Green Power Express
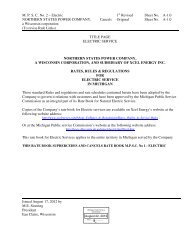
Joint Coordinated <strong>System</strong> <strong>Plan</strong>Figure 1-3: <strong>20</strong>% Wind <strong>Energy</strong> Scenario Conceptual <strong>Transmission</strong> Overlay
(The Strategic Midwest Area <strong>Transmission</strong> Study)SMAR<strong>Transmission</strong> Study• Sponsors: American <strong>Transmission</strong> Company,Electric <strong>Transmission</strong> America, LLC (AmericanElectric Power and MidAmerican <strong>Energy</strong> HoldingCo), Exelon, MidAmerican <strong>Energy</strong>, <strong>Xcel</strong> <strong>Energy</strong>and NorthWestern <strong>Energy</strong>• Purpose: examine transmission infrastructureneeded to support renewable energydevelopment and transport to consumers in theUpper Midwest, the Ohio River Valley, and fartherEast.• Status: Study report has been published.• www.smartstudy.biz
Links to additional information on<strong>Transmission</strong> <strong>Plan</strong>s• The Minnesota <strong>Transmission</strong>Owners• www.minnelectrans.com• The CAPX <strong>20</strong><strong>20</strong> projects• www.capx<strong>20</strong><strong>20</strong>.com• The Midwest Independent<strong>Transmission</strong> <strong>System</strong> Operator,Inc. (MISO)• www.midwestiso.org• Green Power Express• www.itctransco.com/projects/thegreepowerexpress.html• MN renewable <strong>Energy</strong> standardstudies• www.minnelectrans.com/reports.html• Regional Generation OutletStudies• www.midwestmarket.org/publish/folder/6871db_117a25bcaa6_-798d048324a• Joint Coordinated <strong>System</strong> <strong>Plan</strong>• www.jcspstudy.org• SMAR<strong>Transmission</strong>• wwwqa.smartstudy.biz/