Automated DPX process - Gerstel
Automated DPX process - Gerstel
Automated DPX process - Gerstel

You also want an ePaper? Increase the reach of your titles
YUMPU automatically turns print PDFs into web optimized ePapers that Google loves.
Oliver Lerch, Ph.D., The user can specify<br />
Application Specialist, whether a new trap is<br />
GERSTEL<br />
used for each sample<br />
GmbH & Co. KG<br />
and of course which<br />
adsorbent is used,<br />
the tubes are available<br />
with any standard<br />
adsorbent. Following dynamic headspace<br />
extraction and analyte concentration,<br />
the adsorbent tube is transferred to<br />
the GERSTEL Thermal Desorption Unit<br />
(TDU). Analytes are desorbed in the TDU,<br />
transferred to the Cooled Injection System<br />
(CIS), where they are again focused, and finally<br />
transferred in a narrow band to the<br />
GC/MS system for identification and quantification.<br />
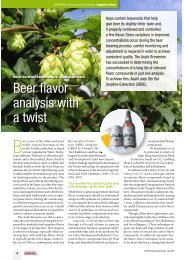
Fatty acid decomposition<br />
provides a clear picture of<br />
product quality<br />
Many samples were analyzed using the<br />
GERSTEL DHS in order to prove its usefulness<br />
over the entire concentration range<br />
of decomposition products (generally from<br />
1 to 100 ng/g) that represents fresh, aged or<br />
slightly rancid product.<br />
As an example, Lerch mentions rapeseed<br />
oil products, which were analyzed as<br />
described above and categorized: Fresh oils<br />
mostly had a very low concentration of decomposition<br />
products. When such oil had<br />
been stored under normal household conditions<br />
for six months, however, levels had<br />
increased significantly (cf. table 1). Apart<br />
from the aspect of aging, large differences<br />
in freshly purchased oils from different<br />
producers were demonstrated (cf. table 2).<br />
“The statistics supported our findings nicely”,<br />
says Lerch, “the standard addition calibration<br />
curves ranged up to 500 ng/g with<br />
excellent linearity; most correlation coefficients<br />
were at 0.999”. Standard deviation<br />
6<br />
GERSTEL Solutions Worldwide Application<br />
Analyte RT [min] m/z rapseed oil No.1 rapseed oil No.1<br />
(fresh) in ng/g (aged) in ng/g<br />
1-Pentene-3-one 7.530 55 1.1 5<br />
2-(E)-Pentenal 10.432 83 1.5 15.7<br />
Hexanal 11.892 56 26.1 244.7<br />
2-(E)-Hexenal 14.532 83 0.4 19.9<br />
4-(Z)-Heptenal 16.010 94 0.2 4.9<br />
2-Pentylfurane 18.858 81 0.5 0.3<br />
1-Octen-3-one 19.304 70 nd 2.3<br />
2,4-(E,E)-Heptadienal 21.484 81 12 90<br />
2,6-(E,Z)-Nonadienal 26.900 70 nd nd<br />
2,4-(E,E)-Nonadienal 29.364 81 0.9 6.9<br />
2,4-(E,E)-Decadienal 32.964 81 5.9 52.6<br />
nd = not detected<br />
Table 1: Comparison of fresh and aged rapeseed oil, which had been stored for 6 months<br />
under normal household conditions.<br />
Analyte RT [min] m/z rapseed oil No.1 rapseed oil No.2<br />
(fresh) in ng/g (fresh) in ng/g<br />
1-Penten-3-one 7.530 55 1.1 17.5<br />
2-(E)-Pentenal 10.432 83 1.5 13.0<br />
Hexanal 11.892 56 26.1 > 500<br />
2-(E)-Hexenal 14.532 83 0.4 17.9<br />
4-(Z)-Heptenal 16.010 94 0.2 nd<br />
2-Pentylfurane 18.858 81 0.5 35.6<br />
1-Octen-3-one 19.304 70 nd 16.8<br />
2,4-(E,E)-Heptadienal 21.484 81 12 14.7<br />
2,6-(E,Z)-Nonadienal 26.900 70 nd 4.3<br />
2,4-(E,E)-Nonadienal 29.364 81 0.9 63.7<br />
2,4-(E,E)-Decadienal 32.964 81 5.9 9.2<br />
nd = not detected<br />
Table 2: Comparison of two fresh rapeseed oils from different producers.<br />
The standard addition calibration curves for the different compounds in an oil sample are linear<br />
up to 500 ng/g. The correlation coefficients were around 0.999 for almost all compounds.<br />
GERSTEL Solutions Worldwide – March 2009