Urban form analysis - technical report - ACT Planning and Land ...
Urban form analysis - technical report - ACT Planning and Land ...
Urban form analysis - technical report - ACT Planning and Land ...

You also want an ePaper? Increase the reach of your titles
YUMPU automatically turns print PDFs into web optimized ePapers that Google loves.
June 2010<br />
<strong>ACT</strong> <strong>Planning</strong> <strong>and</strong> L<strong>and</strong> Authority<br />
<strong>Planning</strong> Services Branch<br />
Enquiries phone 02 6205 9872<br />
V3 26/08/2010
Executive summary<br />
<strong>ACT</strong>PLA June 2010<br />
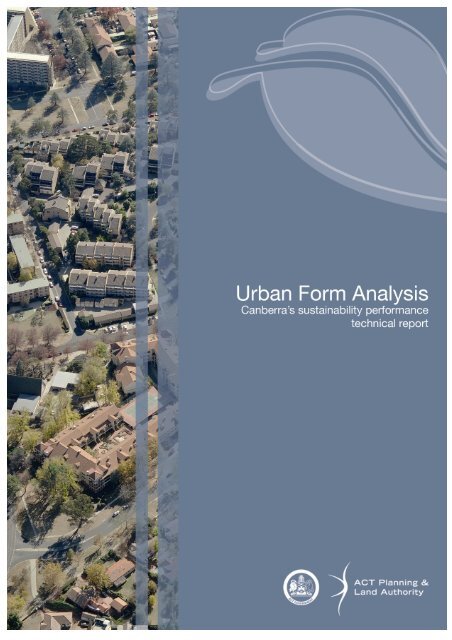
<strong>Urban</strong> Form Analysis<br />
As part of <strong>ACT</strong>PLA’s sustainable future program, the urban <strong>form</strong> <strong>analysis</strong> project has<br />
measured <strong>and</strong> compared the social <strong>and</strong> environmental per<strong>form</strong>ance of seven case study<br />
areas.<br />
These were four Canberra suburbs – Reid, Kingston, Gungahlin <strong>and</strong> Weston, <strong>and</strong> three<br />
overseas residential developments that are sustainability exemplars - Kronsberg in<br />
Hannover <strong>and</strong> Vauban in Freiburg, Germany plus Dockside Green in Victoria, Canada.<br />
The case study areas are 15 to 22 hectares, <strong>and</strong> in Canberra census districts within the<br />
suburbs were used. The Canberra places were chosen because they are representative of<br />
the changing planning trends over time for suburban living <strong>and</strong> demonstrate different types<br />
of urban <strong>form</strong>s <strong>and</strong> patterns.<br />
Sustainability per<strong>form</strong>ance was measured with a range of indicators covering four main<br />
themes:<br />
1. L<strong>and</strong> use – compact layout <strong>and</strong> efficient l<strong>and</strong> use<br />
2. Resource use – efficient energy <strong>and</strong> water use<br />
3. Diversity – housing choice <strong>and</strong> socio-demographic mix<br />
4. Connectivity – movement <strong>and</strong> amenity.<br />
The summarised results are shown in the table below.<br />
Indicators<br />
People per hectare<br />
of urban area<br />
L<strong>and</strong>-take per per<br />
person (m 2 )<br />
Canberra <strong>and</strong> international case study areas<br />
Reid<br />
<strong>ACT</strong><br />
Kingston<br />
<strong>ACT</strong><br />
Gungahlin<br />
<strong>ACT</strong><br />
Weston<br />
<strong>ACT</strong><br />
Hannover<br />
Kronsberg<br />
Freiburg<br />
Vauban<br />
Dockside<br />
Green<br />
48 47 33 13 85 134 288<br />
206 214 303 796 117 75 35<br />
Public open space<br />
per person (m 2 ) 14 9 13 204 27 34 14<br />
Road per person<br />
(m 2 )<br />
Water use per<br />
person (kL)<br />
CO2 emissions per<br />
person (tonnes/yr)<br />
Low income<br />
households (%)<br />
32 71 36 70 11 3 4<br />
86 66 76 111 51 29 37<br />
5.4 3.6 3.6 6.4 0.9 0.5 0.2<br />
9 2 12 0 37 10 10
Key insights from the comparison with international examples are:<br />
1. L<strong>and</strong> use<br />
The overseas examples have two to ten times more l<strong>and</strong>-efficient neighbourhood design<br />
than the Kingston case study area, the most l<strong>and</strong>-efficient of the Canberra studies.<br />
Freiburg Vauban <strong>and</strong> Dockside Green reduce the l<strong>and</strong> used for transport by having<br />
perimeter roads <strong>and</strong> minimising car traffic in development.<br />
2. Resource use – energy <strong>and</strong> water<br />
District scale co-generation power plants <strong>and</strong> low-energy building design for low<br />
operational energy use, reduces carbon emissions from dwellings to a level significantly<br />
below the Canberra examples. And in the overseas examples, publicly visible<br />
stormwater management <strong>and</strong> rainwater retention infrastructure was applied across all<br />
scales of the developments (block, street, section, estate).<br />
3. Diversity<br />
Hannover Kronsberg showcases diversity in design by offering a mix of housing types,<br />
tenures <strong>and</strong> sizes, thus achieving a balanced social mix. Freiburg Vauban is dominated<br />
by two to four storey row-houses <strong>and</strong> apartments for families with children. Dockside<br />
Green achieves a narrower social mix with four to ten storey buildings with one <strong>and</strong> two<br />
bedroom apartments.<br />
4. Connectivity<br />
Car dependency in the international areas is reduced by providing rapid public transport<br />
in combination with neighbourhoods that have walkable distances to local essential<br />
services <strong>and</strong> quality design of the public realm, where pedestrian friendly spaces are<br />
linked <strong>and</strong> buildings have a diversity of <strong>form</strong>s <strong>and</strong> sizes.<br />
A comparison of the four Canberra areas showed:<br />
o There is no ‘average’ Canberra suburb, with each area reflecting the planning<br />
philosophy at the time.<br />
o None of the four areas per<strong>form</strong>s outst<strong>and</strong>ingly across all per<strong>form</strong>ance indicators.<br />
o The Kingston case study area is the most l<strong>and</strong>-efficient.<br />
o Higher density areas in Kingston <strong>and</strong> Reid use less l<strong>and</strong>, water <strong>and</strong> energy per<br />
person to provide housing, open space, pedestrian networks <strong>and</strong> other amenities.<br />
o The predominant <strong>and</strong> built-in use of electricity from the grid to heat apartment<br />
buildings in Kingston <strong>and</strong> Reid results in comparatively high greenhouse gas<br />
emissions, as well as potentially decreasing living affordability as power costs rise.<br />
o All study areas lack diversity in terms of design <strong>and</strong> social mix, mix of dwelling types,<br />
tenures <strong>and</strong> household types.<br />
To improve the sustainability of Canberra’s neighbourhoods, the following goals need to be<br />
considered throughout planning, design <strong>and</strong> implementation.<br />
1. L<strong>and</strong> use<br />
o Reduce the l<strong>and</strong>-take per person by minimising building footprints, paved road<br />
corridors <strong>and</strong> impervious surfaces in open spaces.<br />
o Encourage compact building designs with smaller building footprints, in low density<br />
residential areas in particular.<br />
o Use road verges more efficiently as a shared community zone that has high visual<br />
amenity to attract people’s use of them.<br />
<strong>ACT</strong>PLA June 2010
2. Resource use<br />
o Provide sustainable infrastructure on a district scale, such as waste recovery, power<br />
co-generation, <strong>and</strong> renewable energy provision.<br />
o Improve the thermal per<strong>form</strong>ance of buildings <strong>and</strong> reduce reliance on electricity from<br />
the grid to heat the dwelling.<br />
o Provide for rainwater harvesting <strong>and</strong> stormwater management infrastructure across<br />
all scales (block, street, section <strong>and</strong> estate).<br />
o Conserve natural resources in open spaces <strong>and</strong> improve urban ecological functions.<br />
o Use road verges as safe, convenient <strong>and</strong> interactive spines of green open space.<br />
3. Diversity<br />
o Ensure social diversity <strong>and</strong> equity in the community by providing small <strong>and</strong> internally<br />
differentiated neighbourhood areas instead of larger undifferentiated ones.<br />
o Create a suitable mix of semi-public, public <strong>and</strong> private open space on a<br />
street/section scale to support diverse community activities.<br />
o Provide a mix of housing types, sizes <strong>and</strong> tenures in development at section scale.<br />
4. Connectivity<br />
o Provide connections for pedestrians <strong>and</strong> cyclists to essential facilities such as public<br />
transport, places of employment, community facilities <strong>and</strong> local shops.<br />
o Promote connection of smaller private spaces to multi-faceted public spaces to<br />
encourage stewardship <strong>and</strong> community interaction.<br />
o Provide pedestrians <strong>and</strong> cyclists with well designed public spaces <strong>and</strong> paths that<br />
provide safe <strong>and</strong> pleasant places for the community.<br />
<strong>ACT</strong>PLA June 2010
Contents<br />
<strong>Urban</strong> Form Analysis<br />
A. Places – comparing different patterns of subdivision...................................................1<br />
B. Per<strong>form</strong>ance indicators – measuring sustainability ......................................................2<br />
C. Findings – How Canberra per<strong>form</strong>s ................................................................................3<br />
1. L<strong>and</strong> use .................................................................................................................3<br />
Density of people <strong>and</strong> dwellings .....................................................................................3<br />
Density of buildings <strong>and</strong> spaces.....................................................................................3<br />
L<strong>and</strong> use <strong>and</strong> density .....................................................................................................5<br />
2. Natural resources....................................................................................................6<br />
Combining energy <strong>and</strong> water..........................................................................................6<br />
Energy ...........................................................................................................................7<br />
Water use.......................................................................................................................7<br />
Water recharge ..............................................................................................................8<br />
Open space....................................................................................................................8<br />
3. Diversity ..................................................................................................................9<br />
4. Connectivity.............................................................................................................9<br />
E. Suggestions for improved sustainability .......................................................................10<br />
References to data sources .........................................................................................11<br />
<strong>ACT</strong>PLA June 2010 V3 26/08/2010
<strong>ACT</strong>PLA June 2010 1<br />
<strong>Urban</strong> Form Analysis<br />
A. Places – comparing different patterns of subdivision<br />
Parts of four of Canberra’s residential suburbs were compared using a range of sustainability<br />
indicators. This <strong>analysis</strong> improves our underst<strong>and</strong>ing of existing places with different urban<br />
<strong>form</strong> patterns <strong>and</strong> their sustainability per<strong>form</strong>ance. The findings give a current baseline <strong>and</strong><br />
enable more in<strong>form</strong>ed decisions about how to develop Canberra in the future.<br />
The chosen areas are census collector districts <strong>and</strong> are 15 to 22 hectares in size. They<br />
reflect the diversity of Canberra’s urban <strong>form</strong> <strong>and</strong> show how areas have been designed <strong>and</strong><br />
developed differently over time.<br />
Type A Reid, Canberra central — Historic low to recent medium density residential<br />
development.<br />
Type B Kingston, Canberra central — Historic low to recent medium high density<br />
mixed-use development.<br />
Type C Gungahlin (near Yerrabi Pond), Gungahlin — Recent greenfield low to<br />
medium density residential development.<br />
Type D Weston, Weston Creek — low density residential development from the<br />
1960s <strong>and</strong> 1970s (was greenfield).<br />
The Canberra case study areas were also compared with three international developments<br />
that are ‘showcases’ in terms of urban sustainability:<br />
Type E Hannover Kronsberg, Germany<br />
o an area of 80 hectares with 3000 dwellings <strong>and</strong> nearly 7000 residents<br />
o building heights of four to five storeys along a light rail corridor<br />
o high quality open spaces <strong>and</strong> affordable living options.<br />
Type F Freiburg Vauban, Germany<br />
o an area of 41 hectares with 1800 dwellings <strong>and</strong> 5000 residents<br />
o three to four storey apartments or row houses<br />
o 70 per cent of households have chosen to live without a car.<br />
Type G Dockside Green in Victoria, Canada<br />
o an area of six hectares with 1100 dwellings <strong>and</strong> 2200 residents<br />
o designed to be a carbon neutral<br />
o mix between medium <strong>and</strong> high rise buildings achieves a high density in a<br />
modest site area with a high ratio of public open space.
<strong>ACT</strong>PLA June 2010 2<br />
<strong>Urban</strong> Form Analysis<br />
B. Per<strong>form</strong>ance indicators – measuring sustainability<br />
The case study areas were analysed <strong>and</strong> compared according to per<strong>form</strong>ance indicators<br />
related to four main themes:<br />
1. L<strong>and</strong> use – compact layout <strong>and</strong> efficient l<strong>and</strong> use<br />
o How many people are accommodated in different urban areas?<br />
Key indicator: population density (people per hectare of urban area)<br />
o How many people are accommodated on average in a dwelling?<br />
Key indicator: Occupancy rate (people per dwelling)<br />
o How efficient is the use of l<strong>and</strong> to develop buildings, roads <strong>and</strong> open space?<br />
Key indicator: l<strong>and</strong>-take (m 2 per person)<br />
2. Natural resource use – efficient energy <strong>and</strong> water use<br />
o What is the impact on climate change from operating buildings?<br />
Key indicator: annual residential greenhouse gas emissions (tonnes of CO2 per<br />
person)<br />
o What is the average consumption of electricity <strong>and</strong> gas per person?<br />
Key indicator: annual residential energy use (gigajoules per person)<br />
o How much potable water is used by private households?<br />
Key indicator: annual residential potable water use (kilolitres per person)<br />
o How does the amount of open space affect water retention or run off?<br />
Key indicator: ratio of pervious to impervious surfaces<br />
3. Diversity – housing choice <strong>and</strong> socio-demographic mix<br />
o What type of housing options are available including type, tenure <strong>and</strong> size?<br />
Key indicators: dwelling types (percentage of each in overall dwellings)<br />
tenure types (percentage of each in overall dwellings)<br />
dwelling sizes by number of bedrooms (percentage of each in overall<br />
dwellings)<br />
o What is the social mix of the residential population including age, household<br />
composition <strong>and</strong> income?<br />
Key indicators: population by age cohort (percentgage of overall population)<br />
single, couple <strong>and</strong> family households (percentage of overall households)<br />
low income households (percentage of overall households)<br />
4. Connectivity - movement <strong>and</strong> amenity<br />
o How easy is it for people to access <strong>and</strong> use various means of transport?<br />
Key indicator: nearest rapid bus stop in kilometres of walking distance<br />
o What is the availability of green open space <strong>and</strong> community facilities?<br />
Key indicator: nearest green open space in kilometres walking distance<br />
o How readily can people access retail facilities?<br />
Key indicator: nearest local shop in kilometres walking distance
C. Findings – How Canberra per<strong>form</strong>s<br />
1. L<strong>and</strong> use<br />
<strong>ACT</strong>PLA June 2010 3<br />
<strong>Urban</strong> Form Analysis<br />
Density of people <strong>and</strong> dwellings<br />
Table 1 shows a comparison of different density indicators for each area of the study.<br />
Density<br />
Indicator<br />
People per<br />
hectare of urban<br />
area<br />
Dwellings per<br />
hectare of urban<br />
area<br />
Dwellings per<br />
hectare of<br />
developable l<strong>and</strong><br />
Occupancy<br />
rates<br />
Reid <strong>ACT</strong><br />
Canberra <strong>and</strong> international case study areas<br />
Kingston<br />
<strong>ACT</strong><br />
Gungahlin<br />
<strong>ACT</strong><br />
Weston<br />
<strong>ACT</strong><br />
Hannover<br />
Kronsberg<br />
Freiburg<br />
Vauban<br />
Dockside<br />
Green<br />
48 47 33 13 85 134 288<br />
36 36 13 5 38 44 144<br />
60 83 20 10 73 79 302<br />
1.3 1.3 2.7 2.4 2.3 3.1 2.0<br />
o Reid <strong>and</strong> Kingston have higher densities <strong>and</strong> are closer to the city centre.<br />
o Reid <strong>and</strong> Kingston dwellings are predominantly one <strong>and</strong> two-bedroom apartments with<br />
fewer occupants than those in Gungahlin <strong>and</strong> Weston, which are bigger homes at<br />
lower density.<br />
o Population densities of the international examples are considerably higher than<br />
Canberra.<br />
o Hannover Kronsberg <strong>and</strong> Freiburg Vauban implemented densities that are considered<br />
the maximum ‘socially acceptable’ with two to four storey row-houses <strong>and</strong> walk-up<br />
apartments for families.<br />
o Dockside Green provides predominantly one <strong>and</strong> two bedroom apartments in buildings<br />
ranging from four to ten stories.<br />
Density of buildings <strong>and</strong> spaces<br />
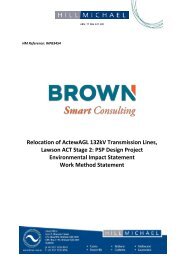
Table 2 <strong>and</strong> Figure 1 compare the amount of l<strong>and</strong> that is used per person for buildings,<br />
roads <strong>and</strong> open space in the study areas.
L<strong>and</strong>-take<br />
per capita<br />
in m 2<br />
Reid<br />
<strong>ACT</strong><br />
<strong>ACT</strong>PLA June 2010 4<br />
<strong>Urban</strong> Form Analysis<br />
Canberra <strong>and</strong> international case study areas<br />
Kingston<br />
<strong>ACT</strong><br />
Gungahlin<br />
<strong>ACT</strong><br />
Weston<br />
<strong>ACT</strong><br />
Hannover<br />
Kronsberg<br />
Freiburg<br />
Vauban<br />
Dockside<br />
Green<br />
Building<br />
footprint 38 38 83 112 18 15 9<br />
Private open<br />
spaces 73 28 105 315 27 19 4<br />
Semi-public<br />
open spaces 14 7 0 0 15 7 3<br />
Road verges 49 48 66 95 34 4 3<br />
Roads 32 71 36 70 11 3 4<br />
Parkl<strong>and</strong> 0 2 13 204 11 27 11<br />
Overall in m 2 206 214 303 796 117 75 35<br />
900<br />
800<br />
700<br />
600<br />
500<br />
400<br />
300<br />
200<br />
100<br />
0<br />
Per capita l<strong>and</strong>-take in m2<br />
Reid Kingston Gungahlin Weston<br />
Parkl<strong>and</strong><br />
Roads <strong>and</strong> Parking<br />
Verges<br />
Semi-Public Open Space<br />
Private Open Space<br />
Building Footprint<br />
Data: <strong>ACT</strong>PLA 2010<br />
o The amount of l<strong>and</strong> used per person for buildings, open space <strong>and</strong> roads is highest in<br />
Weston <strong>and</strong> lowest in Reid <strong>and</strong> Kingston.<br />
o The private l<strong>and</strong> use per person (incorporating the building footprint, private <strong>and</strong> semiprivate<br />
open spaces per resident) is highest in Weston, followed by Gungahlin <strong>and</strong><br />
Reid.<br />
o Weston has more than 20 times the public open space available per person than<br />
Kingston but there are longer distances to local services, a dependency on cars <strong>and</strong><br />
less housing choice.<br />
o Reid <strong>and</strong> Gungahlin show more efficient road pattern <strong>and</strong> parking design than Kingston<br />
<strong>and</strong> Weston.<br />
o The international developments were found to have two to ten times more l<strong>and</strong>-efficient<br />
neighbourhood design than the Kingston case study, the most l<strong>and</strong>-efficient of the<br />
Canberra studies.
<strong>ACT</strong>PLA June 2010 5<br />
<strong>Urban</strong> Form Analysis<br />
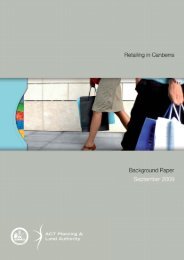
Figure 2 shows the amount of private l<strong>and</strong> per dwelling including the building footprint,<br />
private <strong>and</strong> semi-public open spaces (e.g. shared courtyards of apartment buildings).<br />
1,200<br />
1,000<br />
800<br />
600<br />
400<br />
200<br />
0<br />
Average private l<strong>and</strong>-take by dwelling in metres squared2<br />
Data: <strong>ACT</strong>PLA 2010<br />
o In Gungahlin <strong>and</strong> in Weston the mainly single residential building blocks take up<br />
considerably more private l<strong>and</strong> than in Reid <strong>and</strong> Kingston.<br />
o The average building footprint per dwelling is 270 m2 for the Weston case study area<br />
<strong>and</strong> 215 m2 in Gungahlin.<br />
o Weston has the largest average private open space at 760 m2.<br />
o Gungahlin has much smaller average private yards of 280 m2 per dwelling.<br />
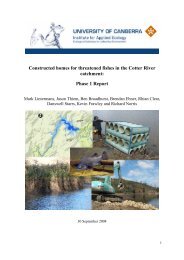
L<strong>and</strong> use <strong>and</strong> density<br />
Figure 3 shows the l<strong>and</strong> use pattern in each of the case study areas for various population<br />
densities.<br />
100%<br />
90%<br />
80%<br />
70%<br />
60%<br />
50%<br />
40%<br />
30%<br />
20%<br />
10%<br />
0%<br />
Reid Kingston Gungahlin Weston<br />
Reid<br />
Kingston<br />
L<strong>and</strong> Use in Percentage of <strong>Urban</strong> Area<br />
Gungahlin<br />
Weston<br />
Hannover<br />
Freiburg<br />
Dockside<br />
Semi-private open space<br />
Private open space<br />
Building footprint<br />
Parkl<strong>and</strong><br />
Road<br />
Road Verge<br />
Semi Public Open Space<br />
Private Open Space<br />
Building Footprint<br />
Data: <strong>ACT</strong>PLA 2010
<strong>ACT</strong>PLA June 2010 6<br />
<strong>Urban</strong> Form Analysis<br />
o In all case study areas, the building footprints account for less than one third of the<br />
total l<strong>and</strong> use of the urban area.<br />
o In the Canberra areas, a higher proportion of l<strong>and</strong> is dedicated to private, semi-public<br />
<strong>and</strong> public open spaces, creating the residential areas with lowest density.<br />
o The road <strong>and</strong> public surface parking represents about one third of the urban area in<br />
higher densities (Kingston) <strong>and</strong> nine per cent in lower densities (Weston).<br />
o In the Canberra areas, road verges take up 12 to 24 percent of the urban area.<br />
o Freiburg Vauban <strong>and</strong> Dockside Green have an efficient road pattern with perimeter<br />
collector roads <strong>and</strong> traffic-calmed residential areas <strong>and</strong> maximise green open space.<br />
o Hannover Kronsberg applies the concept ‘city as a habitat’ by using road verges as<br />
decentralised green corridors.<br />
2. Natural resources<br />
Combining energy <strong>and</strong> water<br />
Table 3 shows energy consumption, carbon emissions <strong>and</strong> water use in residential areas.<br />
Building<br />
Per<strong>form</strong>ance<br />
CO2<br />
Emissions per<br />
person (t/a)<br />
CO2<br />
Emissions per<br />
dwelling (t/a)<br />
Reid<br />
<strong>ACT</strong><br />
Canberra <strong>and</strong> international case study areas<br />
Kingston<br />
<strong>ACT</strong><br />
Gungahlin<br />
<strong>ACT</strong><br />
Weston<br />
<strong>ACT</strong><br />
Hannover<br />
Kronsberg<br />
Freiburg<br />
Vauban<br />
Dockside<br />
Green<br />
5.4 3.6 3.6 6.4 0.9 0.5 0.2<br />
7.3 4.7 9.5 15.4 2.0 1.5 0.4<br />
Energy use per<br />
person (GJ/a) 10 5 20 26 16 9 7<br />
Water use per<br />
person (kL/a) 86 66 76 111 51 29 37<br />
The international case studies have significantly lower carbon emissions <strong>and</strong> water use,<br />
despite greater heating requirements in those colder climate zones. Key features of all the<br />
international case studies are:<br />
o Lowest energy building st<strong>and</strong>ards with quality assurance, monitoring <strong>and</strong> skills<br />
qualification measures.<br />
o Decentralised district heating with gas or biomass-boosted cogeneration plants to<br />
provide heat <strong>and</strong> electrical power.<br />
o Renewable energy sources are used – solar collectors for warm water <strong>and</strong> hydronic<br />
heating <strong>and</strong> photovoltaic <strong>and</strong> wind turbine facilities for producing electricity.<br />
o Innovative technology such as solar passive houses, solar district heating, waste<br />
recovery, onsite sewage treatment <strong>and</strong> water re-use, rainwater retention areas <strong>and</strong><br />
water harvesting.
<strong>ACT</strong>PLA June 2010 7<br />
<strong>Urban</strong> Form Analysis<br />
Energy<br />
Figure 4 shows the residential energy use in comparison to greenhouse gas emissions per<br />
person.<br />
30.0<br />
25.0<br />
20.0<br />
15.0<br />
10.0<br />
5.0<br />
0.0<br />
Residential Energy Use <strong>and</strong> Greenhouse Gas Emissions<br />
Reid Kingston Gungahlin Weston<br />
annual CO2-emissions per<br />
resident (t)<br />
annual residential energy use<br />
per person (GJ)<br />
Data: ActewAGL 2009, Kinesis 2010<br />
o Weston showed the highest CO2 emissions <strong>and</strong> energy consumption per person due<br />
to the low density residential buildings which are older <strong>and</strong> less energy efficient.<br />
o Kingston <strong>and</strong> Gungahlin have the lowest CO2 emissions per person followed by Reid.<br />
o Gungahlin residents produce less CO2 emissions due to the predominant use of<br />
natural gas for space heating.<br />
o The predominant use of electricity for space heating, hot water <strong>and</strong> reverse-cycle air<br />
conditioning in apartments in Reid <strong>and</strong> Kingston increases their greenhouse gas<br />
emissions.<br />
Water use<br />
Figure 5 compares the mains water use per person per year.<br />
120<br />
100<br />
80<br />
60<br />
40<br />
20<br />
0<br />
Domestic Potable Water Use<br />
Reid Kingston Gungahlin Weston<br />
kL potable w ater use per resident<br />
<strong>and</strong> year<br />
Data: ActewAGL 2009
<strong>ACT</strong>PLA June 2010 8<br />
<strong>Urban</strong> Form Analysis<br />
o The water use rates in Reid <strong>and</strong> Weston are likely to be the result of garden watering<br />
requirements in private open space.<br />
o Water-sensitive urban design <strong>and</strong> l<strong>and</strong>scape practices considerably influence the<br />
outcomes for water use per person.<br />
Water recharge<br />
The ability of water to soak into the ground is desirable <strong>and</strong> necessary for plants to grow.<br />
Figure 6 shows the ratio of pervious surfaces per unit of impervious surface.<br />
2.5<br />
2<br />
1.5<br />
1<br />
0.5<br />
0<br />
Ratio impervious to pervious open space<br />
Reid Kingston Gungahlin Weston<br />
impervious open space<br />
pervious open space<br />
Data: CSIRO Remote Sensing 2009<br />
o Pervious ground surfaces allow for rainwater to penetrate the soil <strong>and</strong> reduce<br />
stormwater run-off. This is usually easier to provide in lower density residential areas<br />
with greater amounts of open space.<br />
o Weston per<strong>form</strong>s best with more than double the ratio of pervious to impervious open<br />
space.<br />
o Kingston <strong>and</strong> Gungahlin both per<strong>form</strong> similarly due mainly to impervious, sealed<br />
surfaces.<br />
Open space<br />
Open or ‘green’ spaces were compared by assessing both the quantity of public <strong>and</strong> private<br />
open spaces <strong>and</strong> the area of overall tree canopy (cover) within public <strong>and</strong> private open<br />
spaces.<br />
o Weston had 70 percent green open spaces with generous front <strong>and</strong> back yards. The<br />
tree canopy covers 37 percent of the area.<br />
o Reid had 64 per cent green open space with wide street verges, generous backyards<br />
on single-dwelling blocks <strong>and</strong> semi-public open spaces for apartment blocks. The tree<br />
canopy was 36 percent of the urban area.<br />
o Kingston had 37 percent green open space due to the commercial zones <strong>and</strong> extended<br />
parking requirements. The tree canopy was 20 per cent of the urban area.<br />
o Gungahlin has only 30 percent green open spaces <strong>and</strong> 9 percent tree canopy. These<br />
results are due to the lack of mature trees in this newer suburb, combined with smaller<br />
block sizes <strong>and</strong> low water-use yards with paved not planted surfaces.
3. Diversity<br />
<strong>ACT</strong>PLA June 2010 9<br />
<strong>Urban</strong> Form Analysis<br />
Table 5 gives an overview of the types of dwellings, tenures <strong>and</strong> the composition of<br />
households.<br />
Indicators Reid Kingston Gungahlin Weston<br />
Predominant dwelling type 90%<br />
apartment<br />
94%<br />
apartment<br />
75%<br />
detached<br />
96%<br />
detached<br />
Predominant dwelling size 60% 2BR 73% 2BR 64% 4BR+ 63% 4BR+<br />
Predominant households 55% singles 40% singles 51%<br />
families<br />
Predominant tenure type 76% rented 73% rented 70%<br />
owners<br />
43%<br />
families<br />
96%<br />
owners<br />
Low income households 9% 2% 12% 0%<br />
High income households 9% 50% 22% 42%<br />
0-19 age cohort 12% 6% 32% 16%<br />
40+ age cohort 39% 26% 25% 61%<br />
Each area was found to have a narrow range of dwelling type <strong>and</strong> size. This has an impact<br />
on the socio-demographic mix of the residents.<br />
o Reid <strong>and</strong> Kingston showed mainly two-bedroom apartment buildings rented by singles,<br />
couples without children or group households.<br />
o Reid <strong>and</strong> Kingston both have fewer families with children, indicated by the low<br />
numbers of people below 19 years of age.<br />
o Kingston caters more for high income households, whereas Reid is more affordable<br />
with social housing <strong>and</strong> apartments for medium income households.<br />
o Gungahlin represents an affordable housing option for young, low to medium income<br />
families buying their first home. It has a balanced mix of youth <strong>and</strong> families.<br />
o Weston offers mainly detached four bedroom houses, <strong>and</strong> the majority of the<br />
population was 40 years <strong>and</strong> older with medium to high income households.<br />
4. Connectivity<br />
The <strong>analysis</strong> of each of the four study areas compared a number of quantitative indicators:<br />
walking distance from the centre of the study area to various local amenities,<br />
length of bicycle <strong>and</strong> pedestrian networks,<br />
number of intersections per hectare of urban area.<br />
The main findings were:<br />
o Kingston was the only area with a major transport node accessible by foot in less than<br />
400 metres.<br />
o The proximity of schools <strong>and</strong> shops is closer for Reid <strong>and</strong> Kingston residents.<br />
o Access to open space is very good for all areas.<br />
o Weston provides the highest density of bike paths but also longer distances to travel.<br />
o Reid has the most generous pedestrian path network <strong>and</strong> shortest distances to local<br />
services.<br />
o Gungahlin residents have a better provision of paths than Kingston but further to walk<br />
to access services.
<strong>ACT</strong>PLA June 2010 10<br />
<strong>Urban</strong> Form Analysis<br />
E. Suggestions for improved sustainability<br />
Achieving the following goals throughout planning, design <strong>and</strong> implementation could<br />
substantially improve the sustainability of Canberra’s neighbourhoods.<br />
1. L<strong>and</strong> use<br />
o Reduce the l<strong>and</strong>-take per person by minimising building footprints, paved road<br />
corridors <strong>and</strong> impervious open spaces.<br />
o Encourage compact building designs with smaller building footprints in particular in<br />
low residential areas.<br />
o Use road verges more efficiently as an evenly distributed shared community zone of<br />
high visual amenity that attracts people to use them.<br />
2. Resource use<br />
o Provide sustainable infrastructure on a district scale such as waste recovery, cogeneration<br />
or renewable energy sources.<br />
o Improve the thermal per<strong>form</strong>ance of buildings <strong>and</strong> reduce the reliance on electricity<br />
from the grid to heat the dwelling.<br />
o Provide for cross-scale rainwater harvesting <strong>and</strong> stormwater management.<br />
o Conserve natural resources in open spaces <strong>and</strong> improve urban ecological functions.<br />
o Use road verges as safe, convenient <strong>and</strong> interactive spines of green open space.<br />
3. Diversity<br />
o Ensure social diversity <strong>and</strong> equity in the community by providing small <strong>and</strong> internally<br />
differentiated neighbourhood areas instead of larger undifferentiated ones.<br />
o Create a suitable mix of semi-public, public <strong>and</strong> private open space on a<br />
street/section scale to support diverse activities of the community.<br />
o Provide a mix of housing types, sizes <strong>and</strong> tenures in a finer grain (section scale).<br />
4. Connectivity<br />
o Apply the proximity principle in subdivision design <strong>and</strong> provide connections for<br />
pedestrians <strong>and</strong> cyclists to important services such as public transport, places of<br />
employment, community facilities <strong>and</strong> local shops.<br />
o Connect smaller private spaces to multi-faceted public spaces that encourage<br />
stewardship <strong>and</strong> community interaction.<br />
o Provide pedestrians <strong>and</strong> cyclists with well designed public spaces <strong>and</strong> paths that<br />
provide safe <strong>and</strong> pleasant places for the community.
References to data sources<br />
<strong>ACT</strong>PLA June 2010 11<br />
<strong>Urban</strong> Form Analysis<br />
Cycle <strong>and</strong> pedestrian paths: TaMS asset management data (2010)<br />
L<strong>and</strong> use: Cadastral Series spatial data (<strong>ACT</strong>PLA 2009)<br />
Population <strong>and</strong> dwellings: most recent ABS Census data (2006)<br />
Public transport networks: TaMS Transport for Canberra (2010)<br />
Resource use (electricity, gas, water): Household consumption data (ActewAGL 2009)<br />
Tree canopy cover <strong>and</strong> pervious/impervious groundcover: GIS Remote Sensing (CSIRO<br />
2009)<br />
Walking <strong>and</strong> cycling mapping: CSIRO Integrated Sustainability Assessment Plat<strong>form</strong> (2010)