Monthy Prison Population - England & Wales - 2012 ... - Inside Time
Monthy Prison Population - England & Wales - 2012 ... - Inside Time
Monthy Prison Population - England & Wales - 2012 ... - Inside Time

Create successful ePaper yourself
Turn your PDF publications into a flip-book with our unique Google optimized e-Paper software.
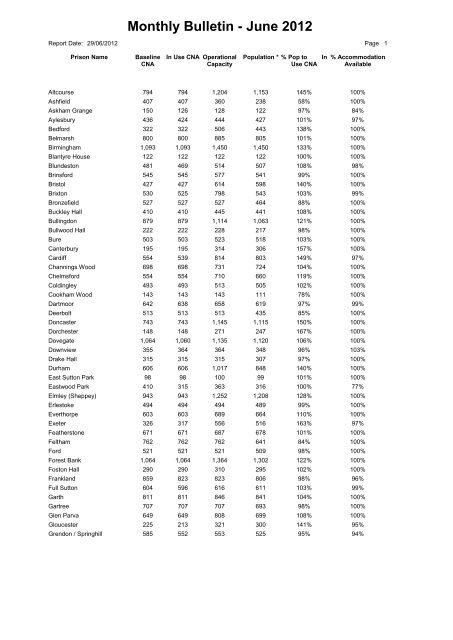
Monthly Bulletin - June <strong>2012</strong>Report Date: 29/06/<strong>2012</strong> Page 1<strong>Prison</strong> Name Baseline In Use CNA Operational <strong>Population</strong> * % Pop to In % AccommodationCNA Capacity Use CNA AvailableAltcourse 794 794 1,204 1,153 145% 100%Ashfield 407 407 360 238 58% 100%Askham Grange 150 126 128 122 97% 84%Aylesbury 436 424 444 427 101% 97%Bedford 322 322 506 443 138% 100%Belmarsh 800 800 885 805 101% 100%Birmingham 1,093 1,093 1,450 1,450 133% 100%Blantyre House 122 122 122 122 100% 100%Blundeston 481 469 514 507 108% 98%Brinsford 545 545 577 541 99% 100%Bristol 427 427 614 598 140% 100%Brixton 530 525 798 543 103% 99%Bronzefield 527 527 527 464 88% 100%Buckley Hall 410 410 445 441 108% 100%Bullingdon 879 879 1,114 1,063 121% 100%Bullwood Hall 222 222 228 217 98% 100%Bure 503 503 523 518 103% 100%Canterbury 195 195 314 306 157% 100%Cardiff 554 539 814 803 149% 97%Channings Wood 698 698 731 724 104% 100%Chelmsford 554 554 710 660 119% 100%Coldingley 493 493 513 505 102% 100%Cookham Wood 143 143 143 111 78% 100%Dartmoor 642 638 658 619 97% 99%Deerbolt 513 513 513 435 85% 100%Doncaster 743 743 1,145 1,115 150% 100%Dorchester 148 148 271 247 167% 100%Dovegate 1,064 1,060 1,135 1,120 106% 100%Downview 355 364 364 348 96% 103%Drake Hall 315 315 315 307 97% 100%Durham 606 606 1,017 848 140% 100%East Sutton Park 98 98 100 99 101% 100%Eastwood Park 410 315 363 316 100% 77%Elmley (Sheppey) 943 943 1,252 1,208 128% 100%Erlestoke 494 494 494 489 99% 100%Everthorpe 603 603 689 664 110% 100%Exeter 326 317 556 516 163% 97%Featherstone 671 671 687 678 101% 100%Feltham 762 762 762 641 84% 100%Ford 521 521 521 509 98% 100%Forest Bank 1,064 1,064 1,364 1,302 122% 100%Foston Hall 290 290 310 295 102% 100%Frankland 859 823 823 806 98% 96%Full Sutton 604 596 616 611 103% 99%Garth 811 811 846 841 104% 100%Gartree 707 707 707 693 98% 100%Glen Parva 649 649 808 699 108% 100%Gloucester 225 213 321 300 141% 95%Grendon / Springhill 585 552 553 525 95% 94%
Report Date: 29/06/<strong>2012</strong> Page 2<strong>Prison</strong> Name Baseline In Use CNA Operational <strong>Population</strong> * % Pop to In % AccommodationCNA Capacity Use CNA AvailableGuys Marsh 520 452 509 500 111% 87%Haverigg 622 622 644 638 103% 100%Hewell 1,003 1,003 1,261 1,208 120% 100%High Down 999 999 1,103 1,100 110% 100%Highpoint (North and South) 1,299 1,272 1,323 1,275 100% 98%Hindley 506 506 506 264 52% 100%Hollesley Bay 380 380 380 379 100% 100%Holloway 540 533 591 544 102% 99%Holme House 1,034 1,034 1,212 1,063 103% 100%Hull 723 723 1,044 895 124% 100%Huntercombe 370 370 430 390 105% 100%Isis 478 478 622 579 121% 100%Isle of Wight 1,578 1,550 1,698 1,621 105% 98%Kennet 175 175 342 334 191% 100%Kingston 199 199 200 199 100% 100%Kirkham 632 632 630 622 98% 100%Kirklevington Grange 283 283 283 277 98% 100%Lancaster Farms 484 480 530 458 95% 99%Leeds 826 786 1,123 1,076 137% 95%Leicester 210 200 400 340 170% 95%Lewes 624 624 722 600 96% 100%Leyhill 527 527 527 517 98% 100%Lincoln 431 427 729 654 153% 99%Lindholme 1,054 1,054 920 874 83% 100%Littlehey 1,142 1,142 1,206 1,181 103% 100%Liverpool 1,190 1,186 1,462 1,228 104% 100%Long Lartin 629 622 622 615 99% 99%Low Newton 314 298 336 281 94% 95%Lowdham Grange 900 900 920 914 102% 100%Maidstone 565 565 600 594 105% 100%Manchester 965 917 1,220 1,155 126% 95%Moorland / Hatfield 1,209 1,209 1,272 1,244 103% 100%Mount 747 747 768 751 101% 100%New Hall 395 371 425 350 94% 94%North Sea Camp 378 378 420 402 106% 100%Northallerton 146 146 252 231 158% 100%Northumberland 1,354 1,297 1,348 1,233 95% 96%Norwich 623 623 769 725 116% 100%Nottingham 723 723 1,060 1,049 145% 100%Oakwood 492 363 363 330 91% 74%Onley 742 742 742 626 84% 100%Parc 1,170 1,170 1,474 1,443 123% 100%Pentonville 915 915 1,310 1,180 129% 100%Peterborough (Male & Female) 840 840 1,008 953 113% 100%Portland 464 464 530 511 110% 100%Preston 455 455 842 714 157% 100%Ranby 893 892 1,098 1,062 119% 100%Reading 190 190 320 228 120% 100%Risley 1,050 1,050 1,095 1,080 103% 100%Rochester 756 658 658 575 87% 87%Rye Hill 600 600 625 603 101% 100%Send 282 262 262 256 98% 93%Shepton Mallet 165 165 189 187 113% 100%Shrewsbury 182 170 340 335 197% 93%
Report Date: 29/06/<strong>2012</strong> Page 3<strong>Prison</strong> Name Baseline In Use CNA Operational <strong>Population</strong> * % Pop to In % AccommodationCNA Capacity Use CNA AvailableStafford 741 741 741 733 99% 100%Standford Hill (Sheppey) 464 464 464 454 98% 100%Stocken 967 967 1,056 952 98% 100%Stoke Heath 634 634 750 623 98% 100%Styal 461 450 459 423 94% 98%Sudbury 581 581 581 571 98% 100%Swaleside (Sheppey) 1,112 1,112 1,112 1,073 96% 100%Swansea 248 240 435 434 181% 97%Swinfen Hall 604 604 654 639 106% 100%Thameside 600 600 600 598 100% 100%Thorn Cross 322 322 322 293 91% 100%Usk / Prescoed 352 352 496 476 135% 100%Verne 572 572 607 600 105% 100%Wakefield 751 749 749 743 99% 100%Wandsworth 1,101 730 1,284 1,181 162% 66%Warren Hill 232 192 192 137 71% 83%Wayland 958 958 1,017 1,001 104% 100%Wealstun 810 810 832 807 100% 100%Wellingborough 638 580 588 576 99% 91%Werrington 160 160 160 136 85% 100%Wetherby 396 381 381 336 88% 96%Whatton 779 776 841 837 108% 100%Whitemoor 473 458 458 452 99% 97%Winchester 499 499 706 652 131% 100%Wolds 320 320 360 346 108% 100%Woodhill 661 656 819 772 118% 99%Wormwood Scrubs 1,171 1,170 1,279 1,180 101% 100%Wymott 1,102 1,102 1,176 1,157 105% 100%Sub total 79,975 78,582 91,238 85,617 109% 98%NOMS Operated Immigration Removal Centres (IRCs)Dover (IRC) 316 316 316 302 96% 100%Haslar (IRC) 160 160 160 142 89% 100%Morton Hall (IRC) 392 392 392 291 74% 100%Sub total 868 868 868 735 85% 100%Total 80,843 79,450 90,106 ** 86,352 109% 98%Report produced by <strong>Population</strong> Strategy.The CNA and Operational Capacity figures are taken from the latest signed cell certificates held by PS.*The prison unlock figure may be lower than the '<strong>Population</strong>', as the '<strong>Population</strong>' includes prisoners on authorised absence.** Useable Operational Capacity of the estate is the sum of all establishments’ operational capacity less 2000 places.The report is compiled from data on the last working Friday in June <strong>2012</strong>.
Report Date: 29/06/<strong>2012</strong> Page 4Definitions of Accommodation TermsCertified Normal Accommodation (CNA)Certified Normal Accommodation (CNA), or uncrowded capacity, is the <strong>Prison</strong> Service’s own measure of accommodation. CNArepresents the good, decent standard of accommodation that the Service aspires to provide all prisoners.Baseline CNABaseline CNA is the sum total of all certified accommodation in an establishment except, normally:•Cells in punishment or segregation units.•Healthcare cells or rooms in training prisons and YOIs that are not routinely used to accommodate long stay patients.In-Use CNAIn-use CNA is baseline CNA less those places not available for immediate use, for example: damaged cells, cells affected bybuilding works.Operational CapacityThe operational capacity of a prison is the total number of prisoners that an establishment can hold taking into account control,security and the proper operation of the planned regime. It is determined by Directors of Offender Management on the basis ofoperational judgement and experience.Useable Operational CapacityUseable Operational Capacity of the estate is the sum of all establishments’ operational capacity less 2000 places. This is knownas the operating margin and reflects the constraints imposed by the need to provide separate accommodation for differentclasses of prisoner i.e. by sex, age, security category, conviction status, single cell risk assessment and also due togeographical distribution.Establishments Exceeding their Operational CapacityGoverning governors and Controllers and Directors of contracted out prisons must ensure that the approved operationalcapacity is not normally exceeded other than on an exceptional basis to accommodate pressing operational need.