LESSON 2 - DATA COLLECTION
LESSON 2 - DATA COLLECTION
LESSON 2 - DATA COLLECTION
- No tags were found...

Create successful ePaper yourself
Turn your PDF publications into a flip-book with our unique Google optimized e-Paper software.
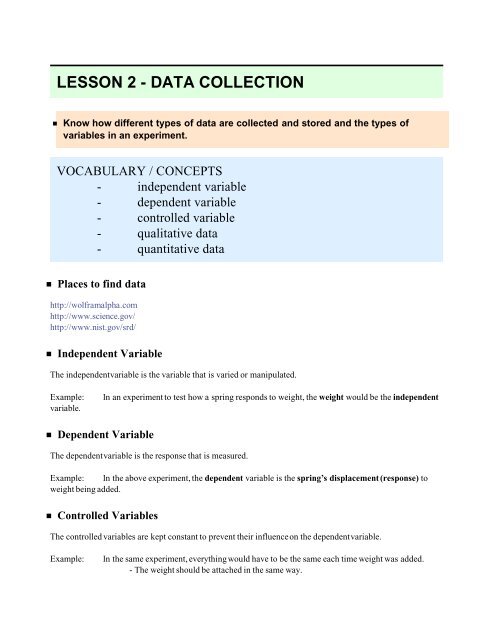
<strong>LESSON</strong> 2 - <strong>DATA</strong> <strong>COLLECTION</strong> Know how different types of data are collected and stored and the types ofvariables in an experiment.VOCABULARY / CONCEPTS- independent variable- dependent variable- controlled variable- qualitative data- quantitative data Places to find datahttp://wolframalpha.comhttp://www.science.gov/http://www.nist.gov/srd/ Independent VariableThe independent variable is the variable that is varied or manipulated.Example:variable.In an experiment to test how a spring responds to weight, the weight would be the independent Dependent VariableThe dependent variable is the response that is measured.Example: In the above experiment, the dependent variable is the spring’s displacement (response) toweight being added. Controlled VariablesThe controlled variables are kept constant to prevent their influence on the dependent variable.Example:In the same experiment, everything would have to be the same each time weight was added.- The weight should be attached in the same way.- The spring should be the same length and temperature- All other conditions that might affect the result must be the same.
The controlled variables are kept constant to prevent their influence on the dependent variable.2 physci_lesson2.nbExample:In the same experiment, everything would have to be the same each time weight was added.- The weight should be attached in the same way.- The spring should be the same length and temperature- All other conditions that might affect the result must be the same. Variables and GraphingTraditionally, when using an x-y axis graph, the x-axis is the independent variable. The y-axis is the dependentvariable. Check out this graph of temperature vs. time (actual data from Colorado Springs, 2005-2010,wolframalpha.com).80604020Ti2005 2006 2007 2008 2009 2010What is the dependent variable?1412108642me02000 2002 2005 2008 2010Week vs. Temperature, Co SpringsMonth vs. Precipitation, Co Springs Qualitative vs. Quantitative DataFrom http://regentsprep.org/REgents/math/ALGEBRA/AD1/qualquant.htm,
From http://regentsprep.org/REgents/math/ALGEBRA/AD1/qualquant.htm, Know why data collection is important, and know the various factors that affectthe validity of data collected.VOCABULARY / CONCEPTS- accuracy- precision- error- statistics- probability AccuracyAccuracy is the closeness of your answer to an accepted ‘true’ value. Sometimes this ‘true’ value may notexist, so it may not always be possible to determine accuracy.Example: A guess of the age of a person might be 17 years old. That person might actually be 19.To calculate accuracy, divide the guess for the value (or measurement for the value) by the ‘true’ value. Thenmultiply by 100. ***If the guess is larger than the true value, like 20, then you must subtract the differencebetween 1 and your answer from 1 (see example).accuracy ⩵1719 ⋆ 100 ⩵ 89.5 physci_lesson2.nb 3
4 physci_lesson2.nbIn this case, the guess was 17 and the actual value was 19.accuracy ⩵ 1 2019 1 ⋆ 100 ⩵ 94.7 In this case, the guess was 20 and the actual value was 19. PrecisionPrecision is the smallest unit of measurement that can be repeated.Examples:1mm.If the smallest unit of measurement on a ruler is millimeters, the precision of the measurement isIf you are measuring distance on a football field, 1yd would be the precision.A good analogy of accuracy and precision is a target board with different patterns.image from http://www.spcforexcel.com/monitoring-test-methods-using-spc ErrorError is how far a prediction or measurement is from the ‘true’ value of something. Error is the opposite ofaccuracy and can be determined by subtracting the accuracy from 100%.Example: If the accuracy of a measurement is 89%, there is error of 11%. Statistics and ProbabilityStatistics are lists of facts.Also, ‘statistics’ is the study of the collection, organization, and interpretation of data.Probability is the likelyhood of something happening. Check out this website for some statistics about thesafety of flying:http://planecrashinfo.com/cause.htm
physci_lesson2.nb 5 Know the types of relationships that exist between variables.VOCABULARY / CONCEPTS- direct relationship- inverse relationship- mean- median- range Direct and Inverse RelationshipsThis graph shows a direct relationship between temperature and carbon dioxide. When one increases, the otherincreases.Graph from zfacts.com.There is inverse relationship between temperature and pressure. If temperature is high, pressure is low. As oneincreases, the other decreases.908070601016101210081004Sun Mon Tue Wed Thu Fri SatAug 7 Aug 8 Aug 9 Aug 10 Aug 11 Aug 12 Aug 13Temperature vs. TimeAir Pressure vs TimeSun Mon Tue Wed Thu Fri SatAug 7 Aug 8 Aug 9 Aug 10 Aug 11 Aug 12 Aug 13
6 physci_lesson2.nbGraphs from wolframalpha.com for Colorado Springs. Mean, Median, and ModeMean: The average value of a set of data points.Median: The number in the middle of a set of data points. If there is an even number of points, it is the averageof the two center points.Mode: Repeated values in a set of data points.Example: Given a set of data points (5,6,7,8,9,9,10,11,11,12,13,15,18 )Mean: 10.3077Median: 10Mode: 9, 11 (two modes)Back to Table of Contents