LESSON 2 - DATA COLLECTION
LESSON 2 - DATA COLLECTION
LESSON 2 - DATA COLLECTION
- No tags were found...

Create successful ePaper yourself
Turn your PDF publications into a flip-book with our unique Google optimized e-Paper software.
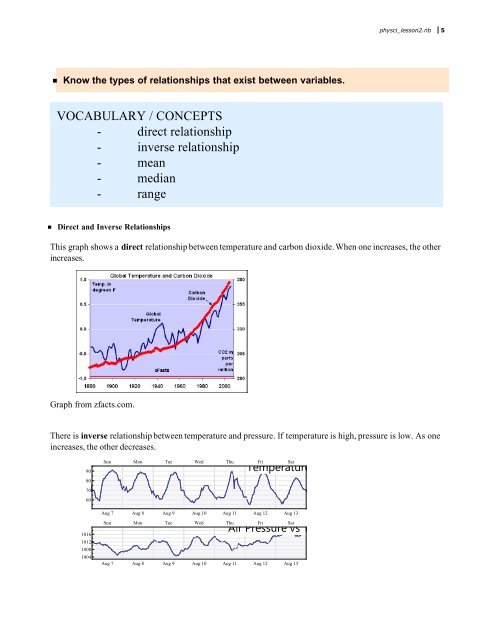
physci_lesson2.nb 5 Know the types of relationships that exist between variables.VOCABULARY / CONCEPTS- direct relationship- inverse relationship- mean- median- range Direct and Inverse RelationshipsThis graph shows a direct relationship between temperature and carbon dioxide. When one increases, the otherincreases.Graph from zfacts.com.There is inverse relationship between temperature and pressure. If temperature is high, pressure is low. As oneincreases, the other decreases.908070601016101210081004Sun Mon Tue Wed Thu Fri SatAug 7 Aug 8 Aug 9 Aug 10 Aug 11 Aug 12 Aug 13Temperature vs. TimeAir Pressure vs TimeSun Mon Tue Wed Thu Fri SatAug 7 Aug 8 Aug 9 Aug 10 Aug 11 Aug 12 Aug 13