Impacts of a Changing Student Learning Culture on Performance in ...
Impacts of a Changing Student Learning Culture on Performance in ...
Impacts of a Changing Student Learning Culture on Performance in ...

You also want an ePaper? Increase the reach of your titles
YUMPU automatically turns print PDFs into web optimized ePapers that Google loves.
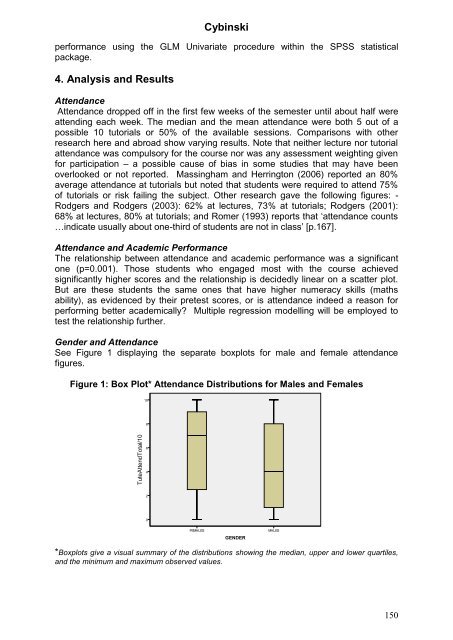
Cyb<strong>in</strong>skiperformance us<strong>in</strong>g the GLM Univariate procedure with<strong>in</strong> the SPSS statisticalpackage.4. Analysis and ResultsAttendanceAttendance dropped <str<strong>on</strong>g>of</str<strong>on</strong>g>f <strong>in</strong> the first few weeks <str<strong>on</strong>g>of</str<strong>on</strong>g> the semester until about half wereattend<strong>in</strong>g each week. The median and the mean attendance were both 5 out <str<strong>on</strong>g>of</str<strong>on</strong>g> apossible 10 tutorials or 50% <str<strong>on</strong>g>of</str<strong>on</strong>g> the available sessi<strong>on</strong>s. Comparis<strong>on</strong>s with otherresearch here and abroad show vary<strong>in</strong>g results. Note that neither lecture nor tutorialattendance was compulsory for the course nor was any assessment weight<strong>in</strong>g givenfor participati<strong>on</strong> – a possible cause <str<strong>on</strong>g>of</str<strong>on</strong>g> bias <strong>in</strong> some studies that may have beenoverlooked or not reported. Mass<strong>in</strong>gham and Herr<strong>in</strong>gt<strong>on</strong> (2006) reported an 80%average attendance at tutorials but noted that students were required to attend 75%<str<strong>on</strong>g>of</str<strong>on</strong>g> tutorials or risk fail<strong>in</strong>g the subject. Other research gave the follow<strong>in</strong>g figures: -Rodgers and Rodgers (2003): 62% at lectures, 73% at tutorials; Rodgers (2001):68% at lectures, 80% at tutorials; and Romer (1993) reports that „attendance counts…<strong>in</strong>dicate usually about <strong>on</strong>e-third <str<strong>on</strong>g>of</str<strong>on</strong>g> students are not <strong>in</strong> class‟ [p.167].Attendance and Academic <strong>Performance</strong>The relati<strong>on</strong>ship between attendance and academic performance was a significant<strong>on</strong>e (p=0.001). Those students who engaged most with the course achievedsignificantly higher scores and the relati<strong>on</strong>ship is decidedly l<strong>in</strong>ear <strong>on</strong> a scatter plot.But are these students the same <strong>on</strong>es that have higher numeracy skills (mathsability), as evidenced by their pretest scores, or is attendance <strong>in</strong>deed a reas<strong>on</strong> forperform<strong>in</strong>g better academically? Multiple regressi<strong>on</strong> modell<strong>in</strong>g will be employed totest the relati<strong>on</strong>ship further.Gender and AttendanceSee Figure 1 display<strong>in</strong>g the separate boxplots for male and female attendancefigures.Figure 1: Box Plot* Attendance Distributi<strong>on</strong>s for Males and Females*Boxplots give a visual summary <str<strong>on</strong>g>of</str<strong>on</strong>g> the distributi<strong>on</strong>s show<strong>in</strong>g the median, upper and lower quartiles,and the m<strong>in</strong>imum and maximum observed values.150