Introduction to Fourier Transform Infrared ... - Nicolet CZ sro
Introduction to Fourier Transform Infrared ... - Nicolet CZ sro
Introduction to Fourier Transform Infrared ... - Nicolet CZ sro
Create successful ePaper yourself
Turn your PDF publications into a flip-book with our unique Google optimized e-Paper software.
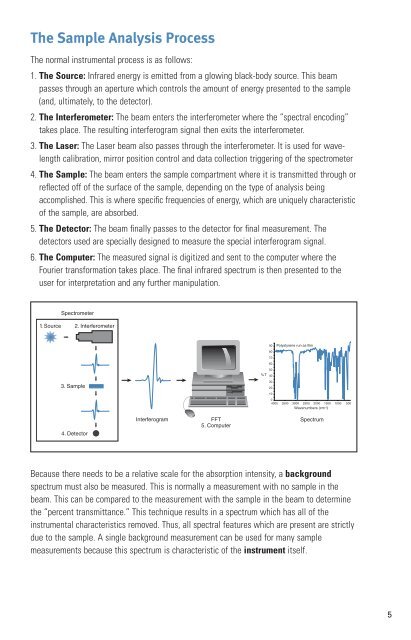
The Sample Analysis ProcessThe normal instrumental process is as follows:1. The Source: <strong>Infrared</strong> energy is emitted from a glowing black-body source. This beampasses through an aperture which controls the amount of energy presented <strong>to</strong> the sample(and, ultimately, <strong>to</strong> the detec<strong>to</strong>r).2. The Interferometer: The beam enters the interferometer where the “spectral encoding”takes place. The resulting interferogram signal then exits the interferometer.3. The Laser: The Laser beam also passes through the interferometer. It is used for wavelengthcalibration, mirror position control and data collection triggering of the spectrometer4. The Sample: The beam enters the sample compartment where it is transmitted through orreflected off of the surface of the sample, depending on the type of analysis beingaccomplished. This is where specific frequencies of energy, which are uniquely characteristicof the sample, are absorbed.5. The Detec<strong>to</strong>r: The beam finally passes <strong>to</strong> the detec<strong>to</strong>r for final measurement. Thedetec<strong>to</strong>rs used are specially designed <strong>to</strong> measure the special interferogram signal.6. The Computer: The measured signal is digitized and sent <strong>to</strong> the computer where the<strong>Fourier</strong> transformation takes place. The final infrared spectrum is then presented <strong>to</strong> theuser for interpretation and any further manipulation.Spectrometer1. Source 2. Interferometer90 Polystyrene run as film80706050% T 403. Sample30201004000 3500 3000 2500 2000 1500 1000 500Wavenumbers (cm-1)4. Detec<strong>to</strong>rInterferogramFFT5. ComputerSpectrumBecause there needs <strong>to</strong> be a relative scale for the absorption intensity, a backgroundspectrum must also be measured. This is normally a measurement with no sample in thebeam. This can be compared <strong>to</strong> the measurement with the sample in the beam <strong>to</strong> determinethe “percent transmittance.” This technique results in a spectrum which has all of theinstrumental characteristics removed. Thus, all spectral features which are present are strictlydue <strong>to</strong> the sample. A single background measurement can be used for many samplemeasurements because this spectrum is characteristic of the instrument itself.5


