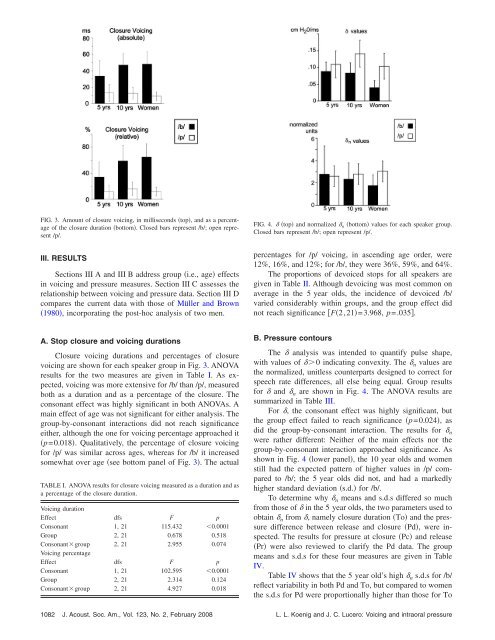
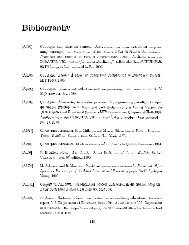
FIG. 3. Amount of closure voicing, in milliseconds top, and as a percentageof the closure duration bottom. Closed bars represent /b/; open represent/p/.III. RESULTSSections III A and III B address group i.e., age effectsin voicing and pressure measures. Section III C assesses therelationship between voicing and pressure data. Section III Dcompares the current data with those of Müller and Brown1980, incorporating the post-hoc analysis of two men.FIG. 4. top and normalized n bottom values for each speaker group.Closed bars represent /b/; open represent /p/.percentages for /p/ voicing, in ascending age order, were12%, 16%, and 12%; for /b/, they were 36%, 59%, and 64%.The proportions of devoiced stops for all speakers aregiven in Table II. Although devoicing was most common onaverage in the 5 year olds, the incidence of devoiced /b/varied considerably within groups, and the group effect didnot reach significance F2,21=3.968, p=.035.A. Stop closure and voicing durationsClosure voicing durations and percentages of closurevoicing are shown for each speaker group in Fig. 3. ANOVAresults for the two measures are given in Table I. As expected,voicing was more extensive for /b/ than /p/, measuredboth as a duration and as a percentage of the closure. Theconsonant effect was highly significant in both ANOVAs. Amain effect of age was not significant for either analysis. Thegroup-by-consonant interactions did not reach significanceeither, although the one for voicing percentage approached itp=0.018. Qualitatively, the percentage of closure voicingfor /p/ was similar across ages, whereas for /b/ it increasedsomewhat over age see bottom panel of Fig. 3. The actualTABLE I. ANOVA results for closure voicing measured as a duration and asa percentage of the closure duration.Voicing durationEffect dfs F pConsonant 1, 21 115.432 0.0001Group 2, 21 0.678 0.518Consonantgroup 2, 21 2.955 0.074Voicing percentageEffect dfs F pConsonant 1, 21 102.595 0.0001Group 2, 21 2.314 0.124Consonantgroup 2, 21 4.927 0.018B. Pressure contoursThe analysis was intended to quantify pulse shape,with values of 0 indicating convexity. The n values arethe normalized, unitless counterparts designed to correct forspeech rate differences, all else being equal. Group resultsfor and n are shown in Fig. 4. The ANOVA results aresummarized in Table III.For , the consonant effect was highly significant, butthe group effect failed to reach significance p=0.024, asdid the group-by-consonant interaction. The results for nwere rather different: Neither of the main effects nor thegroup-by-consonant interaction approached significance. Asshown in Fig. 4 lower panel, the 10 year olds and womenstill had the expected pattern of higher values in /p/ comparedto /b/; the 5 year olds did not, and had a markedlyhigher standard deviation s.d. for /b/.To determine why n means and s.d.s differed so muchfrom those of in the 5 year olds, the two parameters used toobtain n from , namely closure duration To and the pressuredifference between release and closure Pd, were inspected.The results for pressure at closure Pc and releasePr were also reviewed to clarify the Pd data. The groupmeans and s.d.s for these four measures are given in TableIV.Table IV shows that the 5 year old’s high n s.d.s for /b/reflect variability in both Pd and To, but compared to womenthe s.d.s for Pd were proportionally higher than those for To1082 J. Acoust. Soc. Am., Vol. 123, No. 2, February 2008 L. L. Koenig and J. C. Lucero: Voicing and intraoral pressure
TABLE II. Proportions of /b/ productions in which 30% or more of the closure was voiced. In the child groups, the first four speakers are females; the lastfour are males.Speakers 1–8 in each groupGroupaverage5 year olds 0.12 0.35 0.38 0.06 0.79 0.89 1.00 0.11 0.4610 year olds 0.55 0.75 1.00 1.00 0.88 0.23 0.63 1.00 0.75Women 1.00 0.82 0.80 0.87 0.48 0.93 0.97 0.92 0.852.1 vs 1.7. Pd variability, in turn, reflects variability in bothPc and Pr: s.d.s for both are higher in the 5 year olds than thewomen. As for the mean values, both Pd and To are higher inthe 5 year olds than the adults, but proportionally more sofor Pd 1.8 times the adult value than for To 1.4–1.5 timesthe adult value. As laid out in Sec. I, age-related differencesin durations and intraoral pressures were expected for a varietyof reasons. The normalization method proposed byMüller and Brown 1980 is designed to correct for higherpressures that arise simply as a function of longer durations.The current data show both longer durations and higher pressuresin 5 year olds than adults, but the pressure differencesare proportionally greater. Because these two parameters donot change in parallel with age, it appears that this method of normalization is not appropriate for comparing across agegroups.The data presented above indicate that differentiated/p/ and /b/ on average for all age groups. To determine howwell this held for individuals, the difference between /p/and /b/ was obtained for each speaker. If intraoral pressurerises faster in /p/ than /b/, the difference should be positive.The results are given in Fig. 5. Interspeaker variability isconsiderable for all groups, but most values are positive;negative values occur only among the children. 2 Thus, the/p/-/b/ difference observed in the averages is reflective ofmost speakers.C. Relations between stop consonant voicing andpressure measuresTo quantify the relationship between pressure pulse trajectoriesand the degree of stop consonant voicing, withinsubjectcorrelations were run on and closure voicing durationfor /p/ and /b/ combined. 3 The results are given in Fig. 6.As expected, r values are usually negative: As becomesmore positive as for a convex pulse, the amount of voicingdecreases. The three child speakers with positive r values areTABLE III. ANOVA results for the pulse shape measure and its normalizedcounterpart n .Effect dfs F pConsonant 1, 21 35.006 0.0001Group 2, 21 4.497 0.024Consonantgroup 2, 21 2.742 0.087 nEffect dfs F pConsonant 1, 21 1.853 0.188Group 2, 21 0.153 0.859Consonantgroup 2, 21 1.199 0.321the same as those with negative differences between /p/and /b/. Significant correlations using a criterion of0.05/24=0.002 are indicated in Fig. 6 by asterisks. Thenumber of significant correlations increases with age; that is,the relationship between pressure pulse parameters and voicingis more consistent in adults.D. Comparison with Müller and BrownThis section assesses how the current results comparewith those of Müller and Brown 1980. Those authors didnot explicitly measure closure voicing, so this discussion islimited to the measure; n is not considered because of theuneven nature of age-related changes in To and Pd noted inSec. III B.As indicated earlier, the current methods differed in afew ways from those of Müller and Brown 1980: Here,closure and release were measured semiautomatically fromthe acceleration of the flow signal addressed in Sec. II E; astandard pneumotachograph was used, without employingthe adjustments used by Müller and Brown; and the adultgroup consisted of women rather than men. The mask differencerelates only to the airflow-based measures of closureand release, and should not affect the pressure measuresthemselves. The gender difference, however, could affectpressure measures given that women, on average, havesmaller vocal tract sizes than men. Thus, to allow a morevalid comparison with Müller and Brown, equivalent datawere recorded from two men and analyzed in the same manneras the women and children to obtain measures. Valuesof from Müller and Brown were estimated to the nearest0.005 cm H 2 O/ms from their plots for bilabial stops in the/Ä/ vowel context. That study also included alveolar consonantsand a high vowel context. Since Müller and Brown’ssubjects all produced the same number of tokens N=6,group averages could be estimated from the individual subjectaverages.As shown in Table V, values obtained here for both /p/and /b/ were higher than Müller and Brown’s 1980, particularlyfor the children. A general pattern of descending valuesfor /b/ across 5 year olds, 10 year olds, women, and menin Table V provides qualitative support for the hypothesisthat intraoral pressure tends to rise more slowly in those withlarger vocal tracts. This is consistent with the data in TableIV: The pressure rise during closure, Pd, was higher in childrenthan women, and to a greater degree than closure duration,To. The average differences between Müller andBrown’s data and the current adult speakers appear to reflectsampling error, however. Müller and Brown’s data showedconsiderable intersubject variability in , and standard devia-J. Acoust. Soc. Am., Vol. 123, No. 2, February 2008 L. L. Koenig and J. C. Lucero: Voicing and intraoral pressure 1083